| Param | Original file | Final file |
|---|---|---|
| Filename | modeM0/AS1A09_008T06_9000003748_25723cztM0_level2.evt | modeM0/AS1A09_008T06_9000003748_25723cztM0_level2_quad_clean.evt |
| Size (bytes) | 569,957,760 | 105,857,280 |
| Size | 543.6 MB | 101.0 MB |
| Events in quadrant A | 3,210,395 | 735,489 |
| Events in quadrant B | 3,363,056 | 764,474 |
| Events in quadrant C | 3,332,418 | 732,542 |
| Events in quadrant D | 6,930,852 | 536,287 |
| Mode M0 | |||
|---|---|---|---|
| Quadrant | BADHDUFLAG | Total packets | Discarded packets |
| A | 0 | 13479 | 0 |
| B | 0 | 13957 | 0 |
| C | 0 | 13793 | 0 |
| D | 0 | 24884 | 0 |
| Mode M9 | |||
|---|---|---|---|
| Quadrant | BADHDUFLAG | Total packets | Discarded packets |
| A | 0 | 21 | 0 |
| B | 0 | 22 | 0 |
| C | 0 | 22 | 0 |
| D | 0 | 22 | 0 |
| Quadrant | Total seconds | Saturated seconds | Saturation percentage |
|---|---|---|---|
| A | 6253 | 51 | 0.815609% |
| B | 6253 | 69 | 1.103470% |
| C | 6253 | 123 | 1.967056% |
| D | 6253 | 1608 | 25.715656% |
Noise dominated data is calculated using 1-second bins in cleaned event files. If a bin has >2000 counts, and if more than 50% of those come from <1% of pixels, then it is considered to be noise-dominated and hence unusable.
| Quadrant | # 1 sec bins | Bins with >0 counts | Bins with >2000 counts | High rate bins dominated by noise | Noise dominated (total time) | Noise dominated (detector-on time) | Marked lightcurve |
|---|---|---|---|---|---|---|---|
| A | 7583 | 6254 | 0 | 0 | 0.00% | 0.00% | 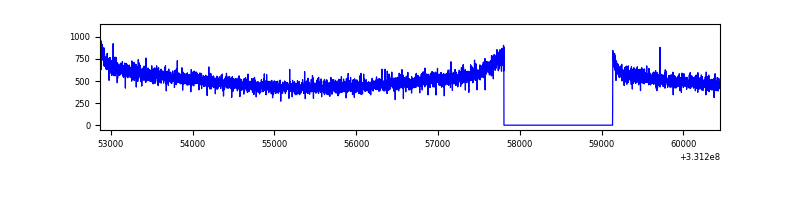 |
| B | 7583 | 6254 | 3 | 3 | 0.04% | 0.05% | 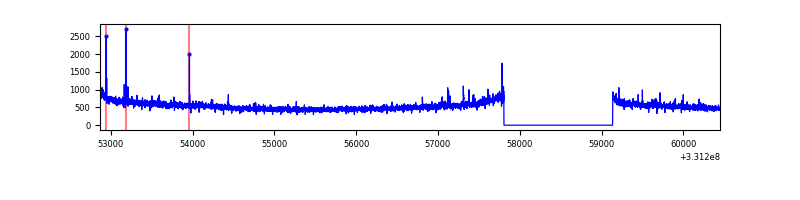 |
| C | 7583 | 6253 | 0 | 0 | 0.00% | 0.00% | 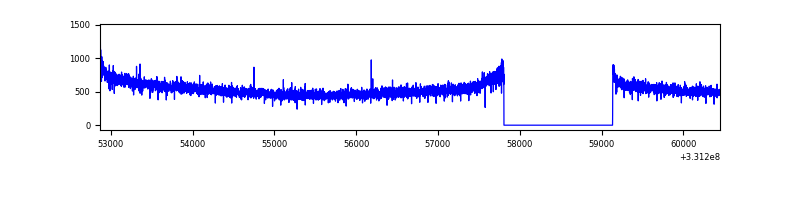 |
| D | 7583 | 6253 | 1219 | 1219 | 16.08% | 19.49% | 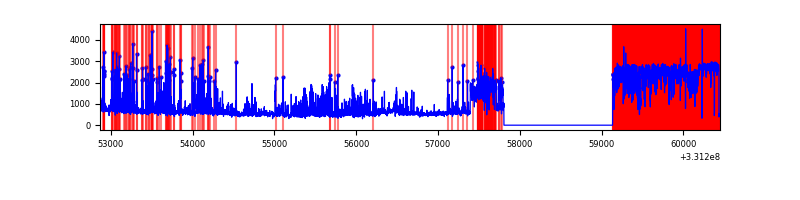 |
Top three noisy pixels from each quadrant. If the there are fewer than three noisy pixels in the level2.evt file, extra rows are filled as -1
| Pixel properties | Quadrant properties | ||||||
|---|---|---|---|---|---|---|---|
| Quadrant | DetID | PixID | Counts | Sigma | Mean | Median | Sigma |
| A | 13 | 254 | 10472 | 58.35 | 830 | 816 | 165.5 |
| A | 0 | 226 | 7136 | 38.19 | 830 | 816 | 165.5 |
| A | 3 | 137 | 7070 | 37.79 | 830 | 816 | 165.5 |
| B | 0 | 245 | 20153 | 122.7 | 840 | 820 | 157.6 |
| B | 12 | 111 | 17816 | 107.87 | 840 | 820 | 157.6 |
| B | 0 | 190 | 17792 | 107.72 | 840 | 820 | 157.6 |
| C | 14 | 238 | 130267 | 684.47 | 816 | 827 | 189.1 |
| C | 3 | 233 | 13407 | 66.52 | 816 | 827 | 189.1 |
| C | 1 | 16 | 9504 | 45.88 | 816 | 827 | 189.1 |
| D | 1 | 52 | 4136846 | 25708.86 | 661 | 643 | 160.9 |
| D | 8 | 195 | 156512 | 968.81 | 661 | 643 | 160.9 |
| D | 2 | 244 | 78176 | 481.91 | 661 | 643 | 160.9 |
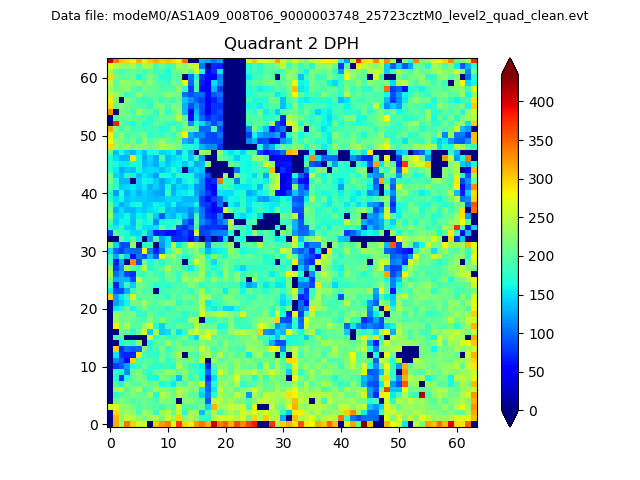
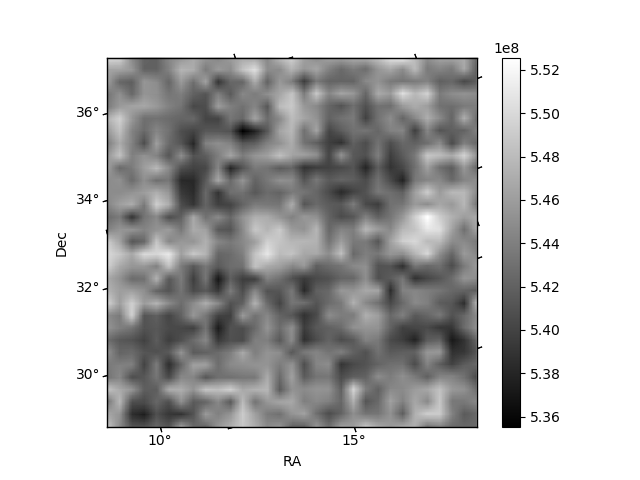
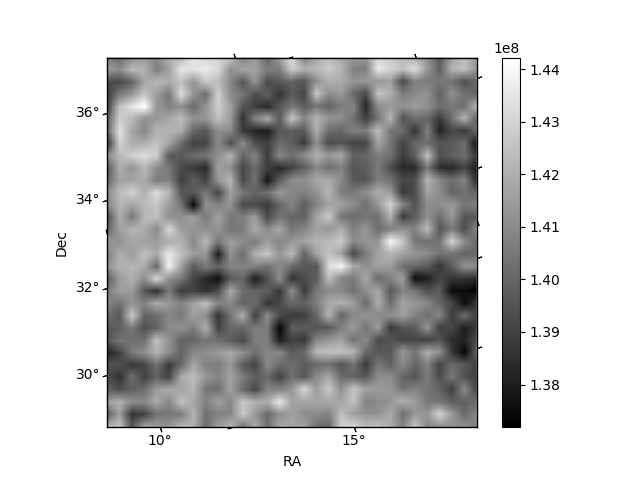
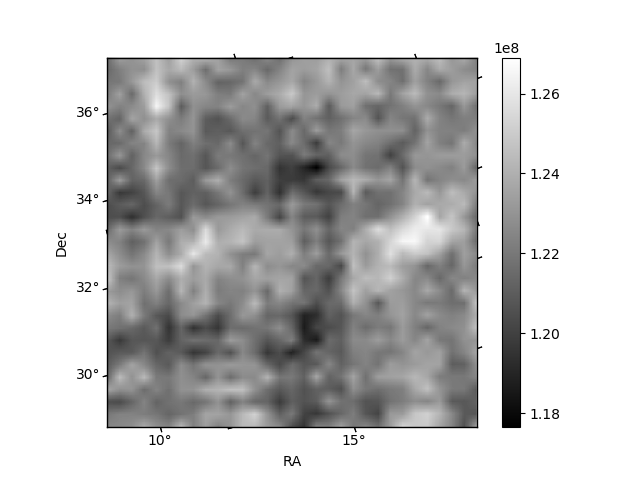
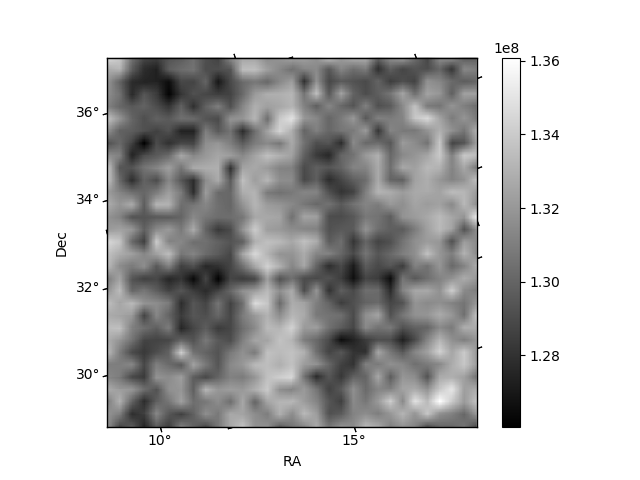
Histogram calculated using DETX and DETY for each event in the final _common_clean file
| Quadrant A | 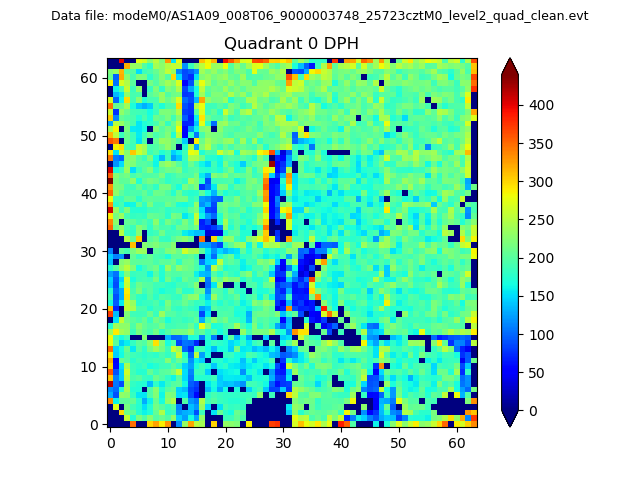 |
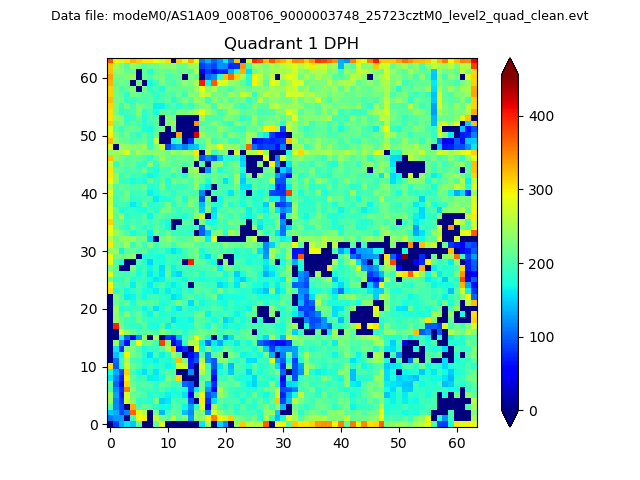 |
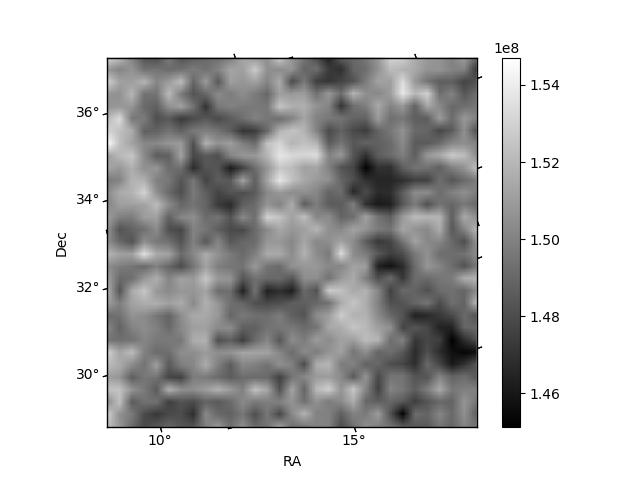
Quadrant B |
|---|---|---|---|
| Quadrant D | 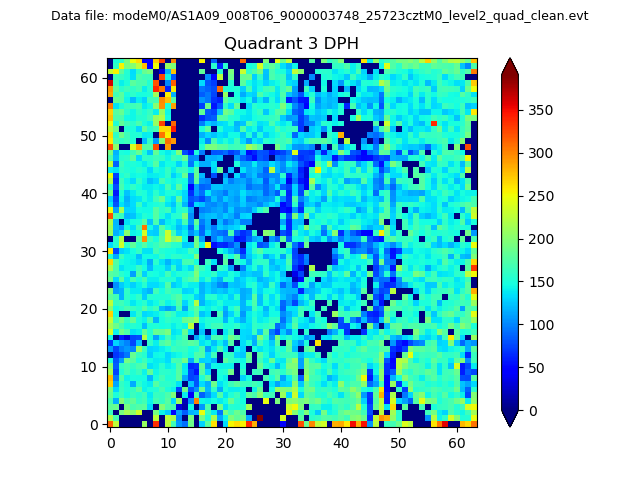 |
 |
Quadrant C |
| Plot type | Count rate plots | Images |
|---|---|---|
| Comparison with Poisson distribution Blue bars denote a histogram of data divided into 1 sec bins. Red curve is a Poisson curve with rate = median count rate of data. |
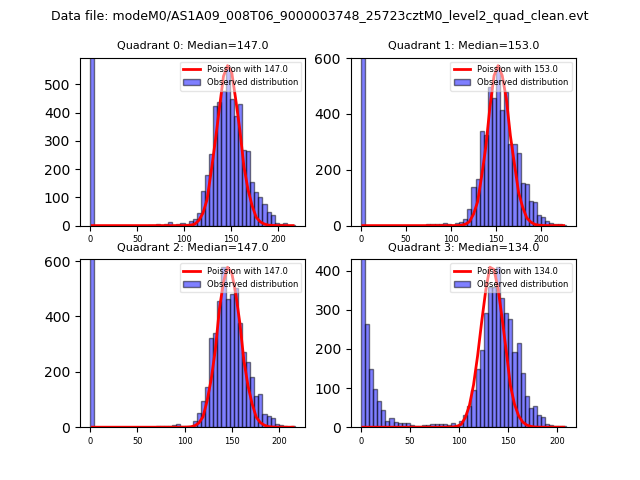 |
 |
| Quadrant-wise count rates Data is divided into 100 sec bins |
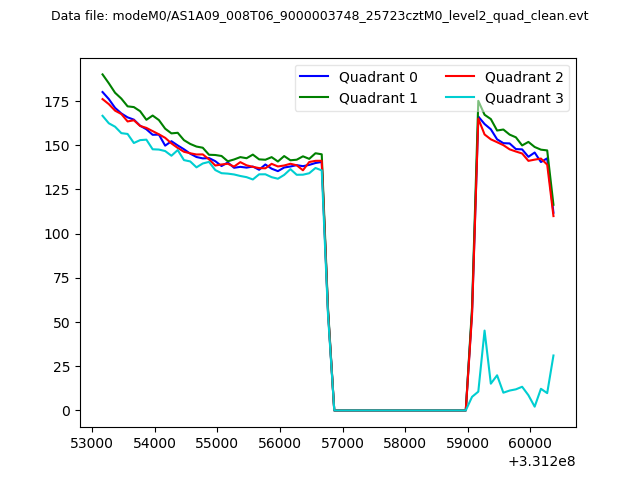 |
|
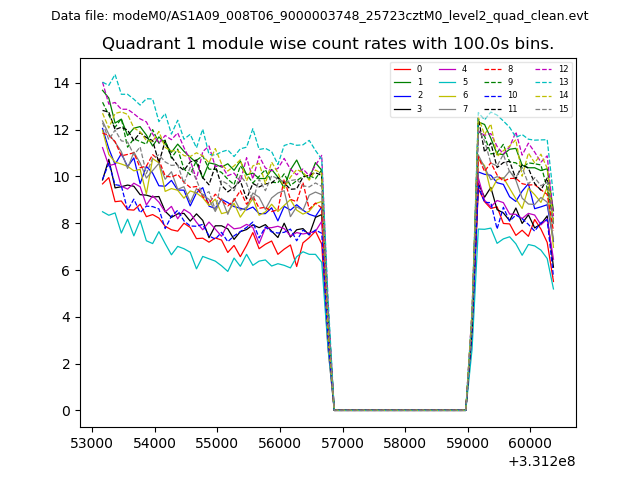
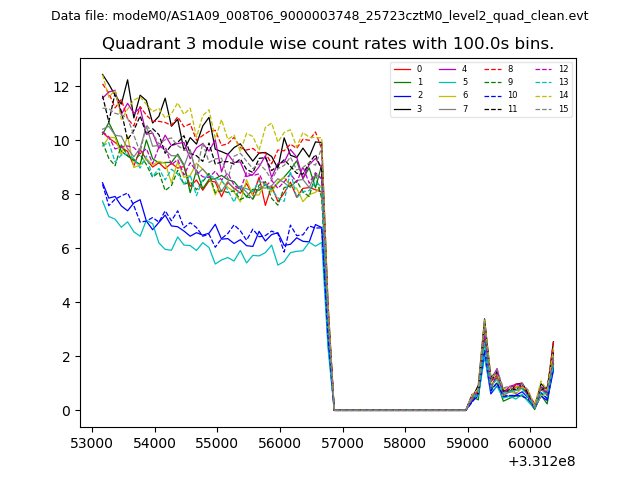
| Module-wise count rates for Quadrant A Data is divided into 100 sec bins |
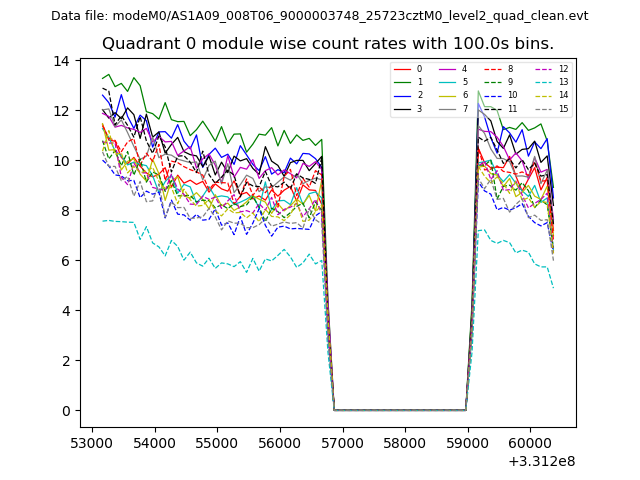 |
 |
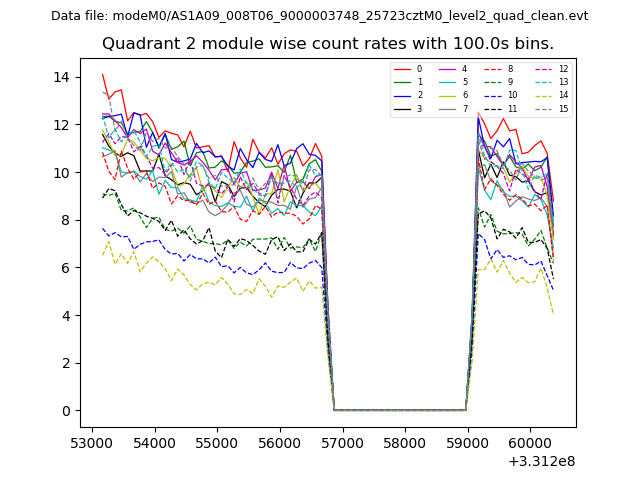
| Module-wise count rates for Quadrant B Data is divided into 100 sec bins |
 |
 |
| Module-wise count rates for Quadrant C Data is divided into 100 sec bins |
 |
 |
| Module-wise count rates for Quadrant D Data is divided into 100 sec bins |
 |
 |
| Parameter | Plot |
|---|---|
| CZT HV Monitor | 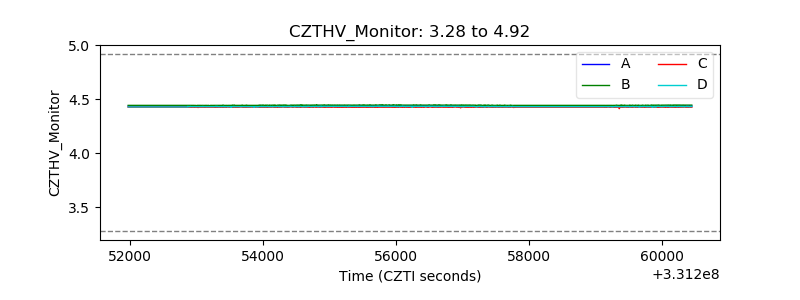 |
| D_VDD | 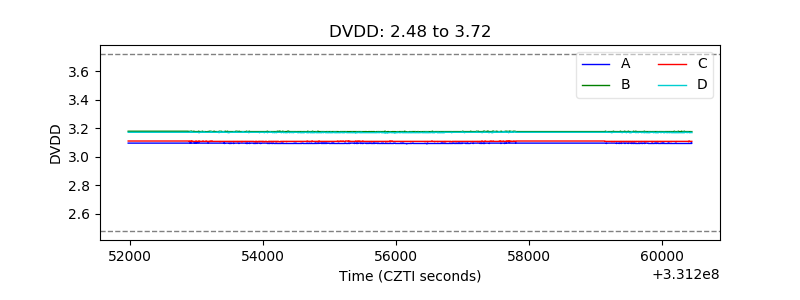 |
| Temperature 1 | 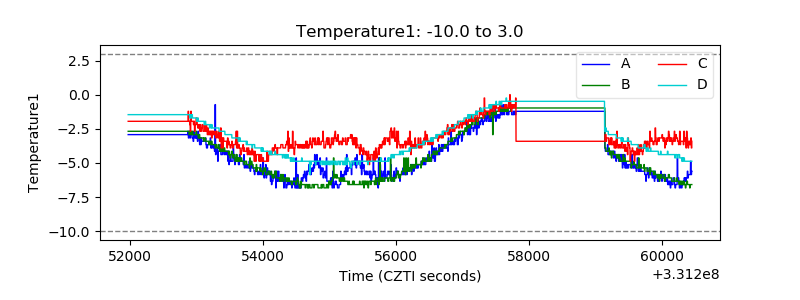 |
| Veto HV Monitor |  |
| Veto LLD | 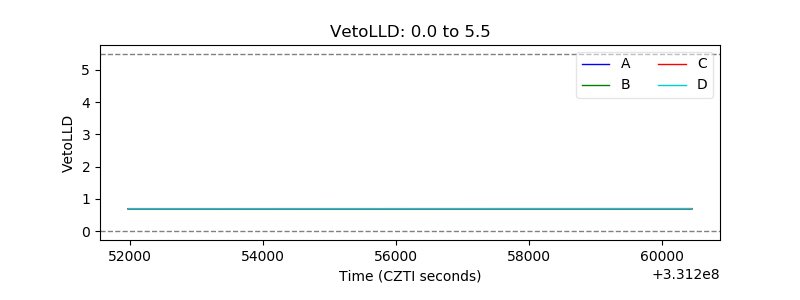 |
| Alpha Counter | 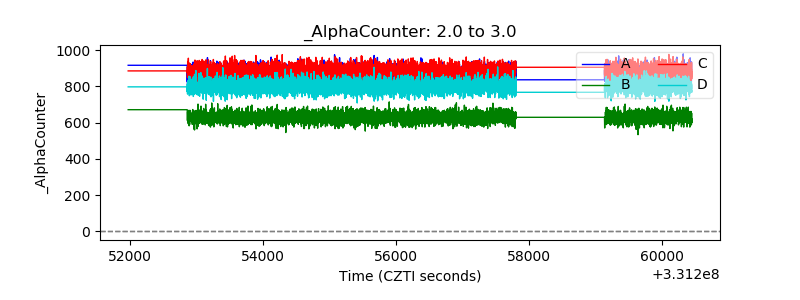 |
| _CPM_Rate |  |
| CZT Counter | 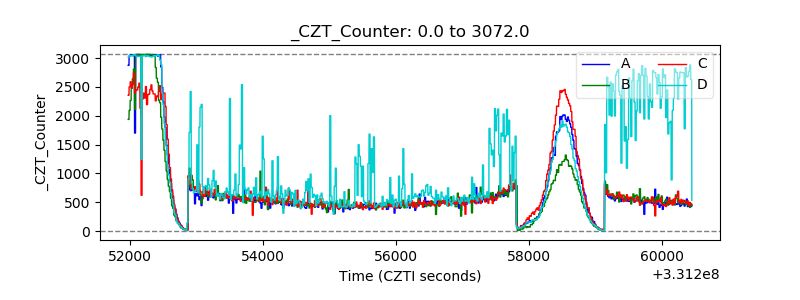 |
| +2.5 Volts monitor | 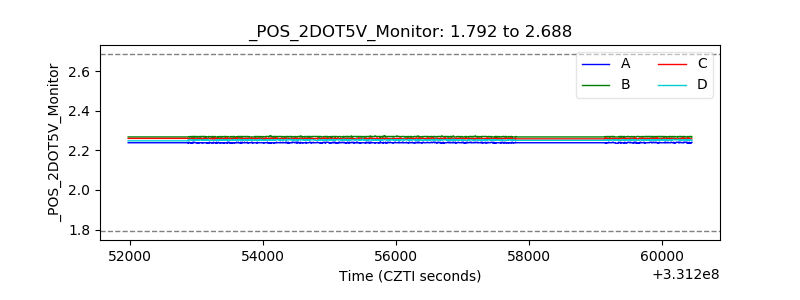 |
| +5 Volts monitor |  |
| _ROLL_ROT | 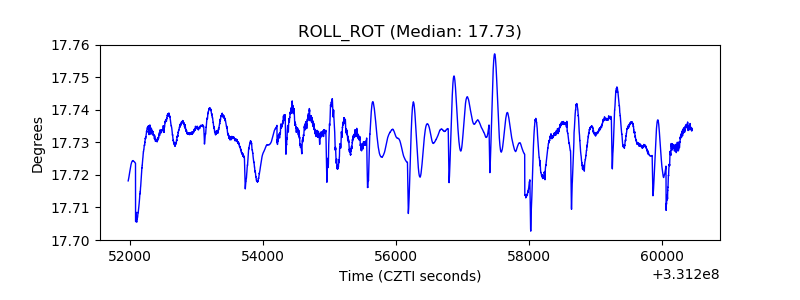 |
| _Roll_DEC | 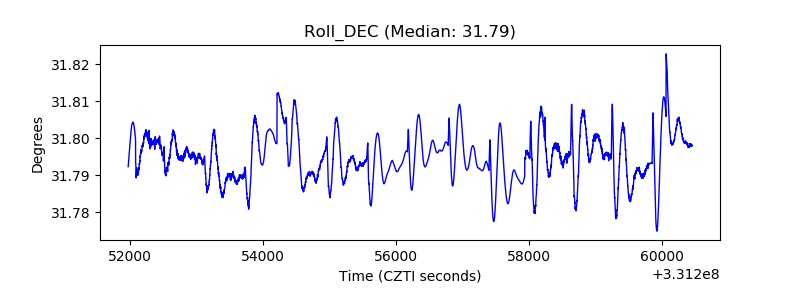 |
| _Roll_RA | 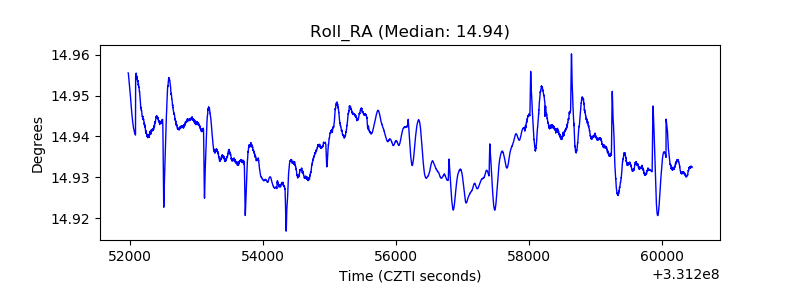 |
| Veto Counter | 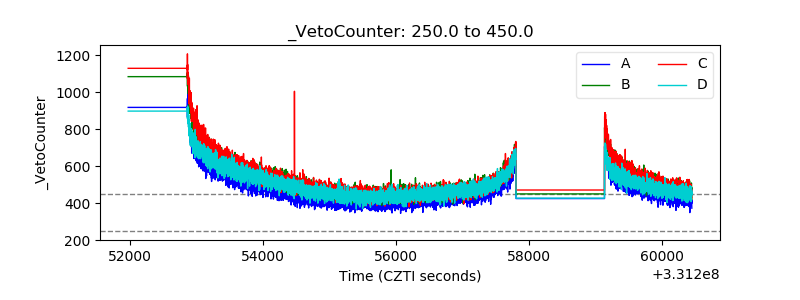 |