| Param | Original file | Final file |
|---|---|---|
| Filename | modeM0/AS1A09_008T06_9000003748_25724cztM0_level2.evt | modeM0/AS1A09_008T06_9000003748_25724cztM0_level2_quad_clean.evt |
| Size (bytes) | 691,663,680 | 91,304,640 |
| Size | 659.6 MB | 87.1 MB |
| Events in quadrant A | 3,207,761 | 677,417 |
| Events in quadrant B | 3,436,336 | 700,946 |
| Events in quadrant C | 3,374,812 | 669,537 |
| Events in quadrant D | 10,480,587 | 255,308 |
| Mode M0 | |||
|---|---|---|---|
| Quadrant | BADHDUFLAG | Total packets | Discarded packets |
| A | 0 | 13757 | 0 |
| B | 0 | 14387 | 0 |
| C | 0 | 14115 | 0 |
| D | 0 | 35544 | 0 |
| Mode M9 | |||
|---|---|---|---|
| Quadrant | BADHDUFLAG | Total packets | Discarded packets |
| A | 0 | 11 | 0 |
| B | 0 | 12 | 0 |
| C | 0 | 12 | 0 |
| D | 0 | 12 | 0 |
| Quadrant | Total seconds | Saturated seconds | Saturation percentage |
|---|---|---|---|
| A | 6601 | 26 | 0.393880% |
| B | 6601 | 86 | 1.302833% |
| C | 6601 | 114 | 1.727011% |
| D | 6601 | 3549 | 53.764581% |
Noise dominated data is calculated using 1-second bins in cleaned event files. If a bin has >2000 counts, and if more than 50% of those come from <1% of pixels, then it is considered to be noise-dominated and hence unusable.
| Quadrant | # 1 sec bins | Bins with >0 counts | Bins with >2000 counts | High rate bins dominated by noise | Noise dominated (total time) | Noise dominated (detector-on time) | Marked lightcurve |
|---|---|---|---|---|---|---|---|
| A | 7596 | 6602 | 0 | 0 | 0.00% | 0.00% | 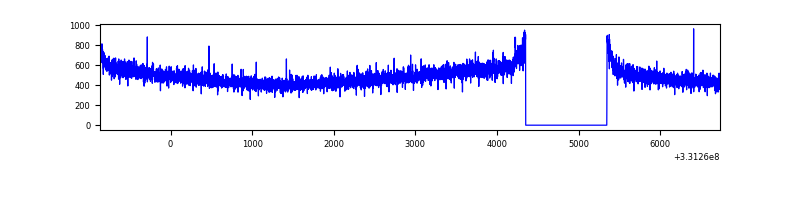 |
| B | 7596 | 6601 | 10 | 10 | 0.13% | 0.15% | 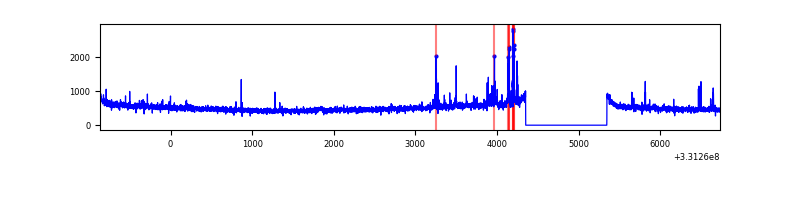 |
| C | 7596 | 6602 | 23 | 23 | 0.30% | 0.35% | 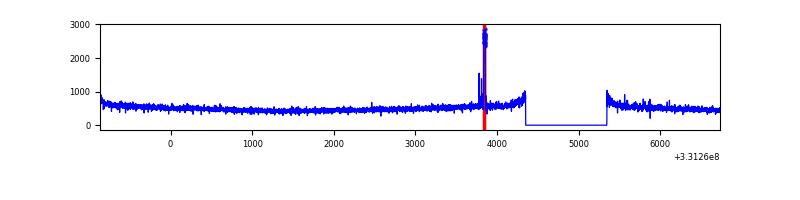 |
| D | 7595 | 6600 | 3002 | 3002 | 39.53% | 45.48% | 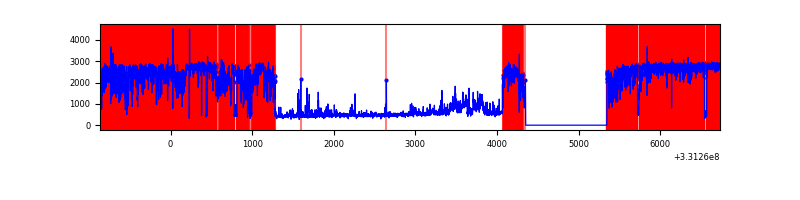 |
Top three noisy pixels from each quadrant. If the there are fewer than three noisy pixels in the level2.evt file, extra rows are filled as -1
| Pixel properties | Quadrant properties | ||||||
|---|---|---|---|---|---|---|---|
| Quadrant | DetID | PixID | Counts | Sigma | Mean | Median | Sigma |
| A | 13 | 254 | 10765 | 59.87 | 830 | 815 | 166.2 |
| A | 3 | 137 | 7585 | 40.74 | 830 | 815 | 166.2 |
| A | 0 | 226 | 7119 | 37.93 | 830 | 815 | 166.2 |
| B | 5 | 172 | 67362 | 422.27 | 836 | 814 | 157.6 |
| B | 0 | 229 | 30421 | 187.87 | 836 | 814 | 157.6 |
| B | 12 | 111 | 18754 | 113.84 | 836 | 814 | 157.6 |
| C | 14 | 238 | 131748 | 695.54 | 806 | 811 | 188.3 |
| C | 9 | 54 | 69457 | 364.65 | 806 | 811 | 188.3 |
| C | 3 | 233 | 22465 | 115.03 | 806 | 811 | 188.3 |
| D | 1 | 52 | 8447131 | 78969.09 | 436 | 424 | 107.0 |
| D | 12 | 227 | 219288 | 2046.18 | 436 | 424 | 107.0 |
| D | 8 | 195 | 67300 | 625.23 | 436 | 424 | 107.0 |
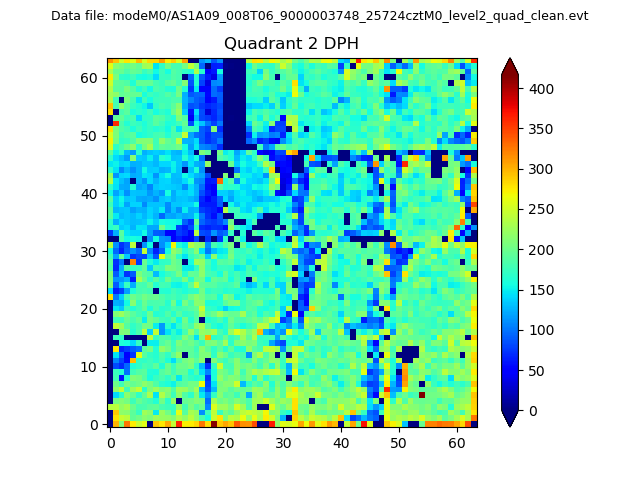
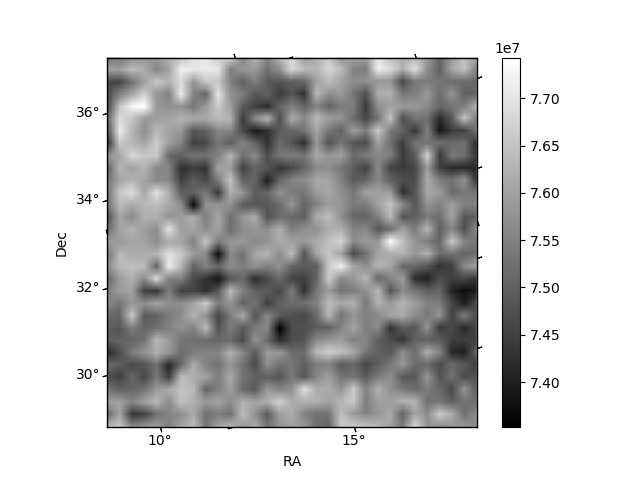
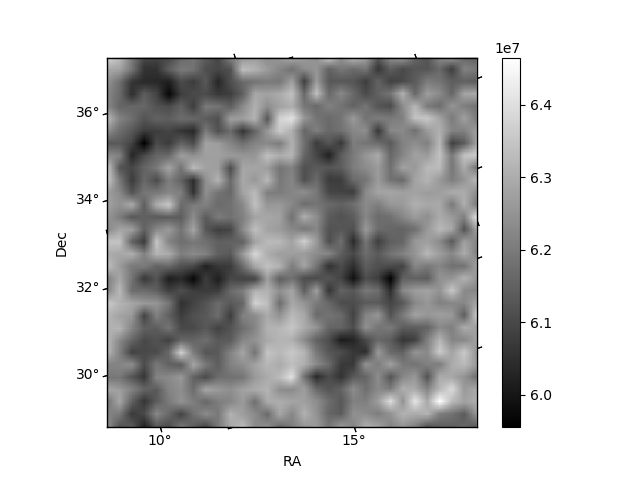
Histogram calculated using DETX and DETY for each event in the final _common_clean file
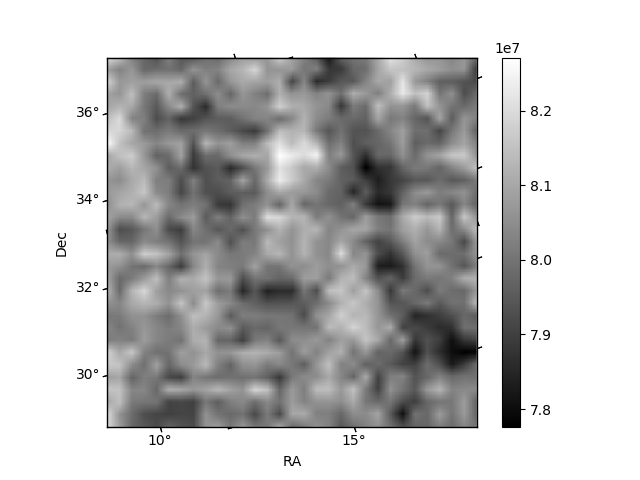
| Quadrant A | 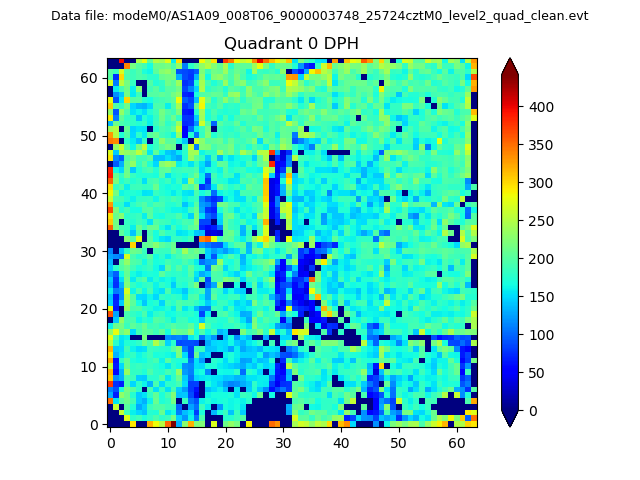 |
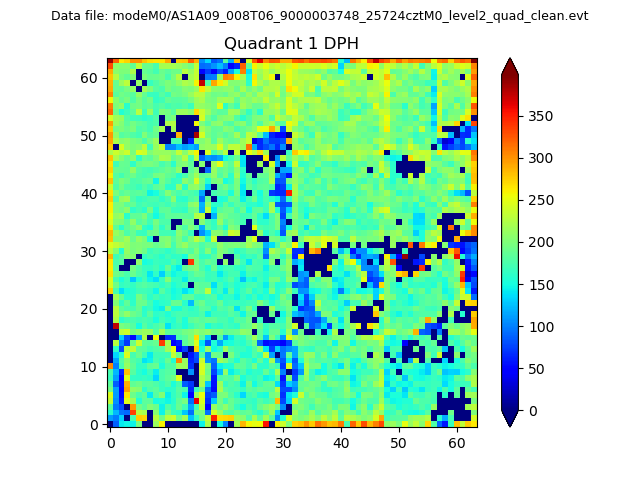 |
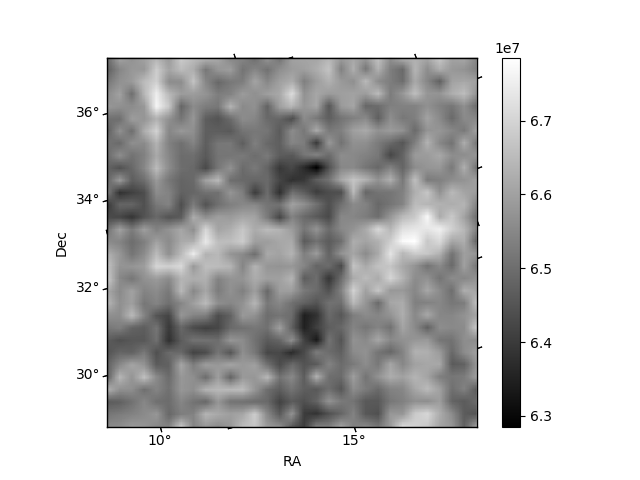
Quadrant B |
|---|---|---|---|
| Quadrant D | 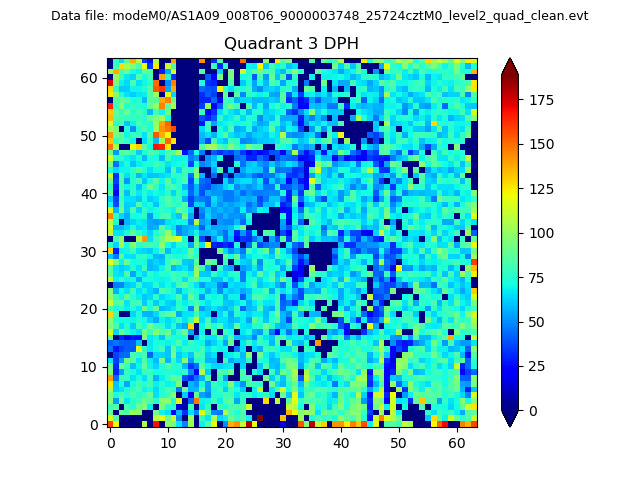 |
 |
Quadrant C |
| Plot type | Count rate plots | Images |
|---|---|---|
| Comparison with Poisson distribution Blue bars denote a histogram of data divided into 1 sec bins. Red curve is a Poisson curve with rate = median count rate of data. |
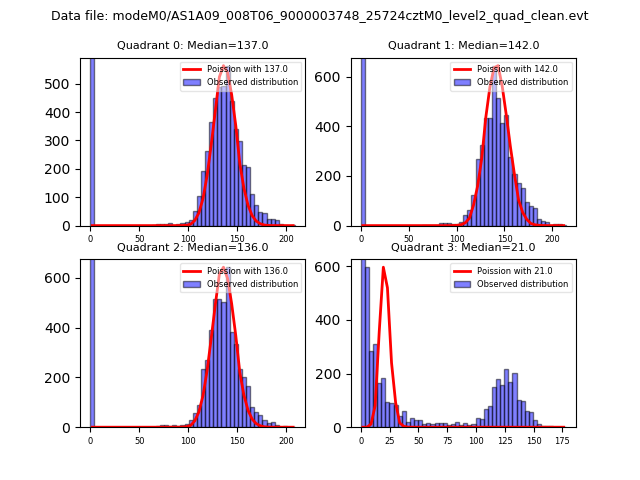 |
 |
| Quadrant-wise count rates Data is divided into 100 sec bins |
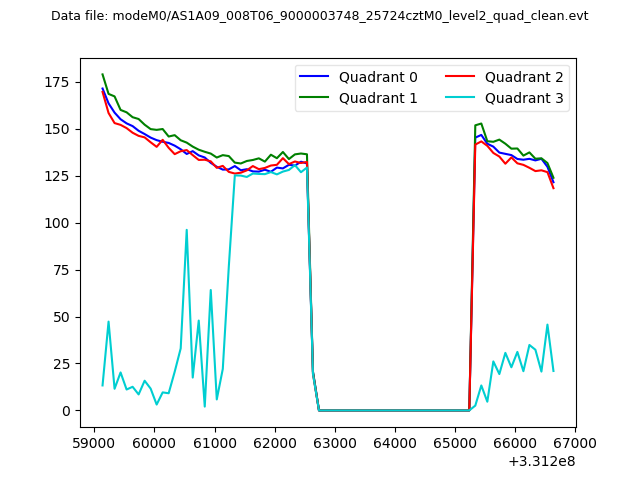 |
|
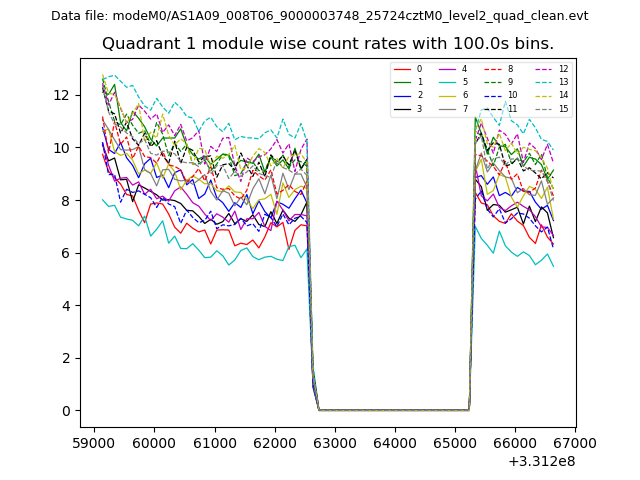
| Module-wise count rates for Quadrant A Data is divided into 100 sec bins |
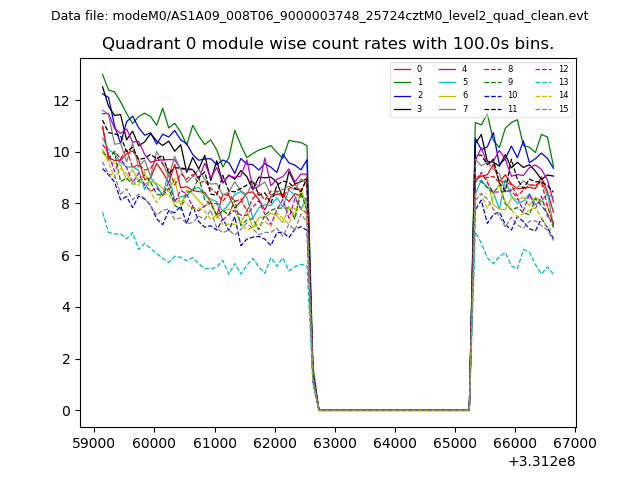 |
 |
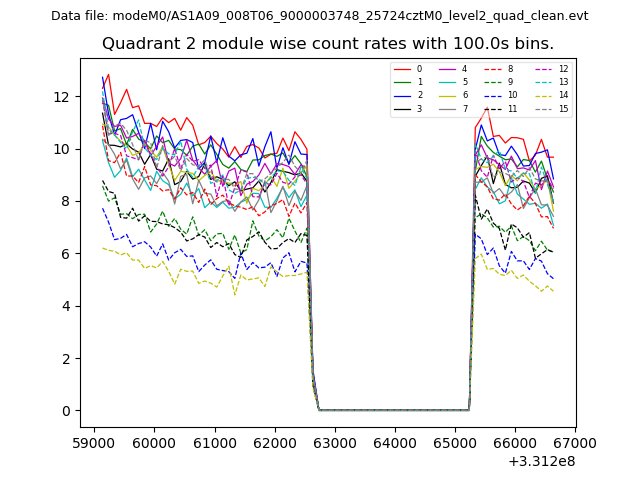
| Module-wise count rates for Quadrant B Data is divided into 100 sec bins |
 |
 |
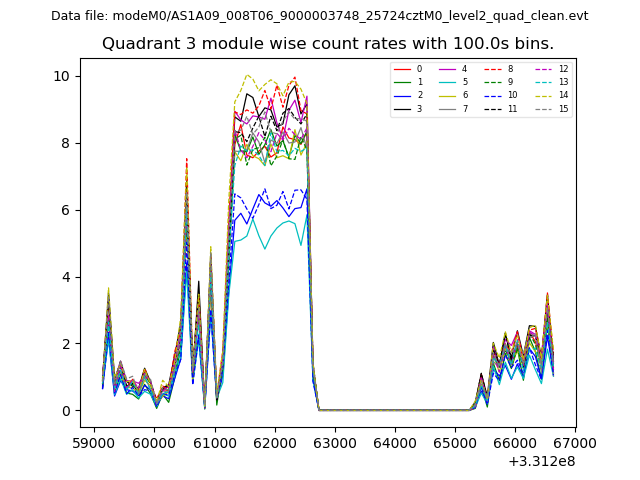
| Module-wise count rates for Quadrant C Data is divided into 100 sec bins |
 |
 |
| Module-wise count rates for Quadrant D Data is divided into 100 sec bins |
 |
 |
| Parameter | Plot |
|---|---|
| CZT HV Monitor | 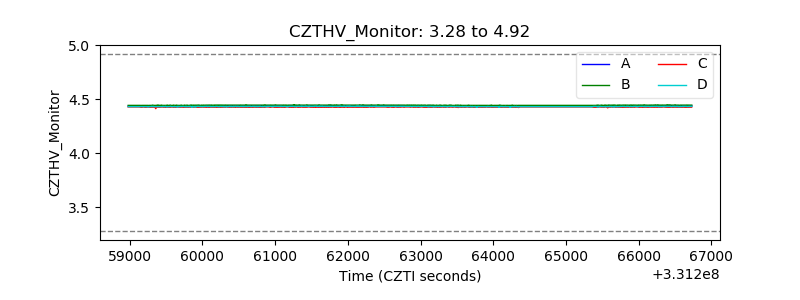 |
| D_VDD | 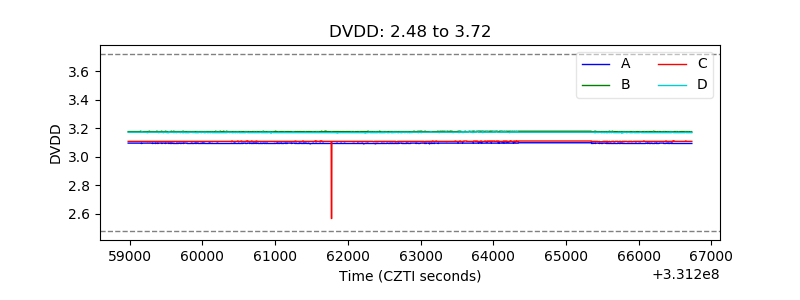 |
| Temperature 1 | 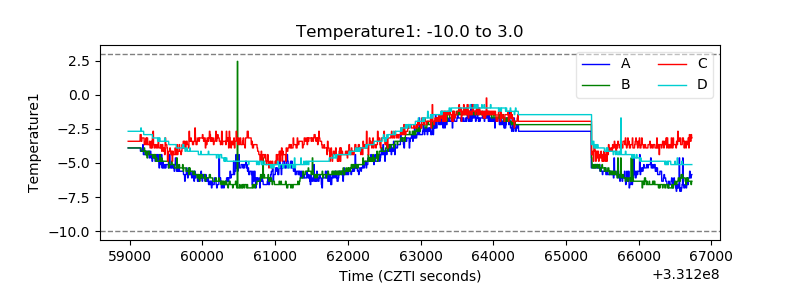 |
| Veto HV Monitor | 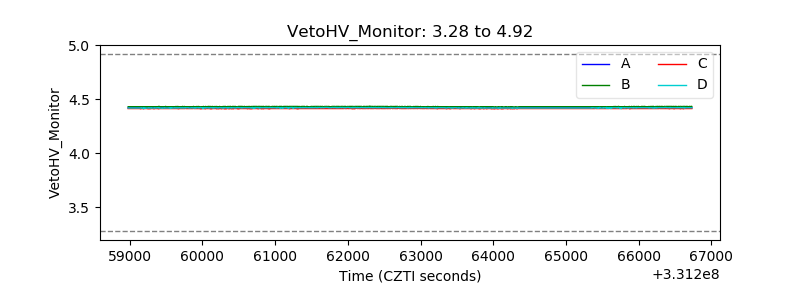 |
| Veto LLD | 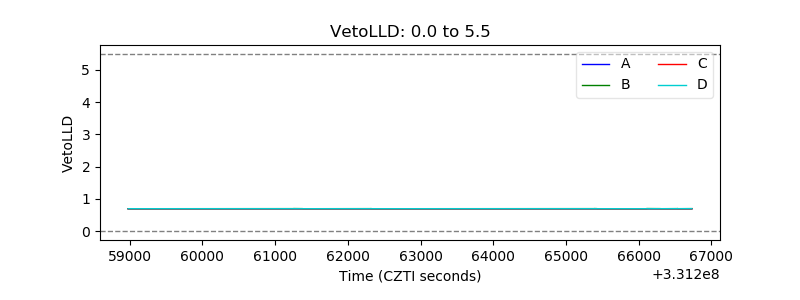 |
| Alpha Counter | 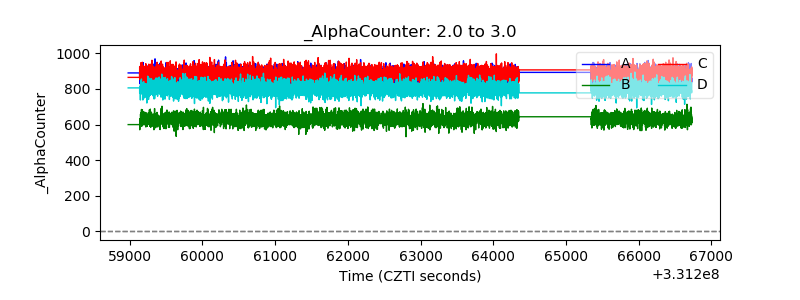 |
| _CPM_Rate | 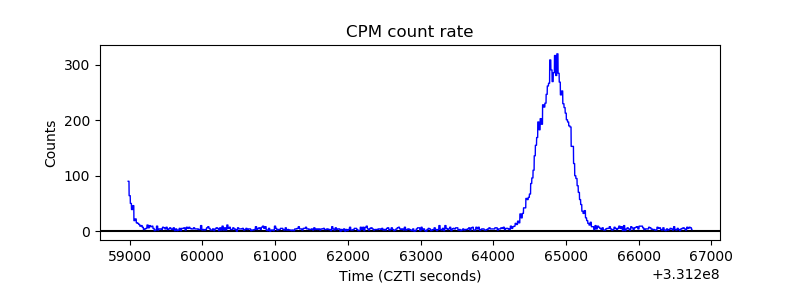 |
| CZT Counter | 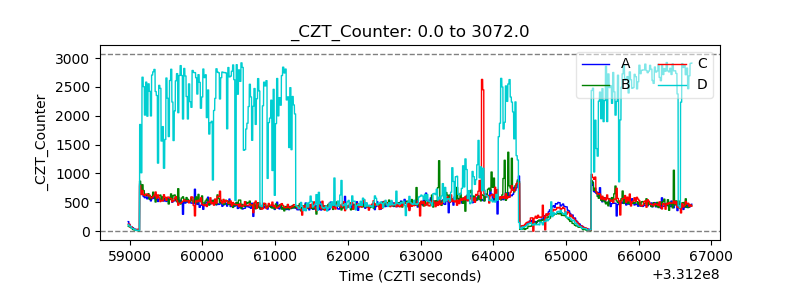 |
| +2.5 Volts monitor | 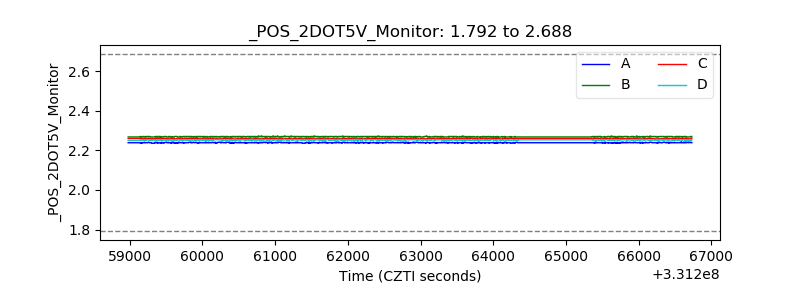 |
| +5 Volts monitor |  |
| _ROLL_ROT | 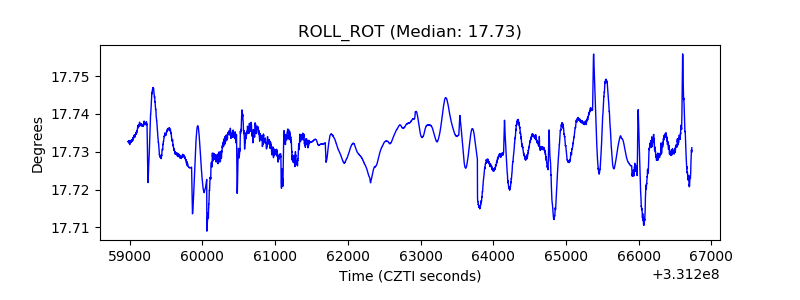 |
| _Roll_DEC | 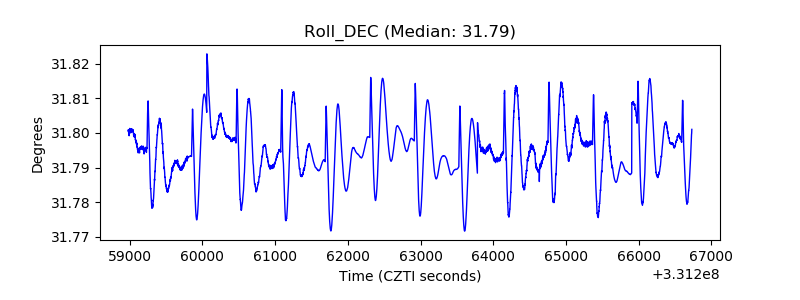 |
| _Roll_RA | 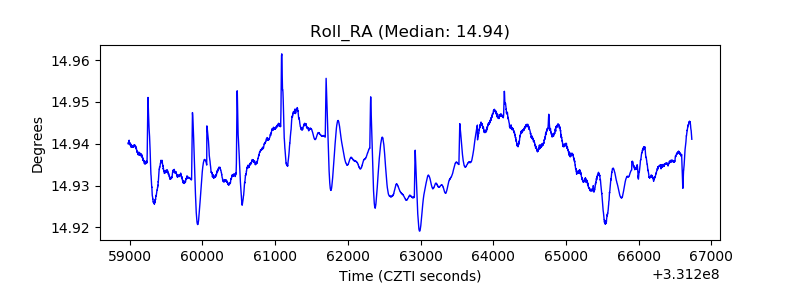 |
| Veto Counter | 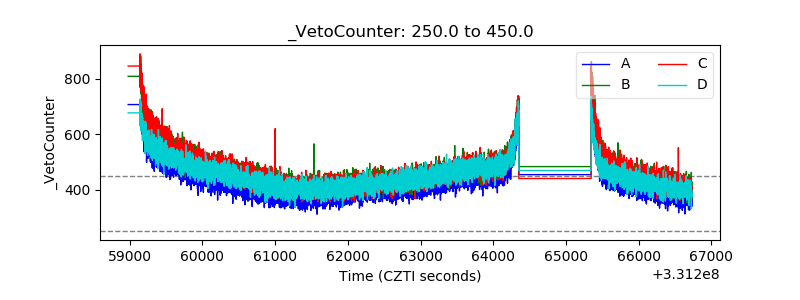 |