| Param | Original file | Final file |
|---|---|---|
| Filename | modeM0/AS1A09_008T06_9000003748_25725cztM0_level2.evt | modeM0/AS1A09_008T06_9000003748_25725cztM0_level2_quad_clean.evt |
| Size (bytes) | 704,404,800 | 84,421,440 |
| Size | 671.8 MB | 80.5 MB |
| Events in quadrant A | 3,239,852 | 592,058 |
| Events in quadrant B | 3,442,938 | 605,194 |
| Events in quadrant C | 3,307,527 | 581,362 |
| Events in quadrant D | 10,884,636 | 305,403 |
| Mode M0 | |||
|---|---|---|---|
| Quadrant | BADHDUFLAG | Total packets | Discarded packets |
| A | 0 | 14098 | 0 |
| B | 0 | 14691 | 0 |
| C | 0 | 14135 | 0 |
| D | 0 | 37021 | 0 |
| Mode M9 | |||
|---|---|---|---|
| Quadrant | BADHDUFLAG | Total packets | Discarded packets |
| A | 0 | 4 | 0 |
| B | 0 | 4 | 0 |
| C | 0 | 4 | 0 |
| D | 0 | 4 | 0 |
| Quadrant | Total seconds | Saturated seconds | Saturation percentage |
|---|---|---|---|
| A | 6751 | 103 | 1.525700% |
| B | 6751 | 152 | 2.251518% |
| C | 6751 | 156 | 2.310769% |
| D | 6751 | 2983 | 44.186047% |
Noise dominated data is calculated using 1-second bins in cleaned event files. If a bin has >2000 counts, and if more than 50% of those come from <1% of pixels, then it is considered to be noise-dominated and hence unusable.
| Quadrant | # 1 sec bins | Bins with >0 counts | Bins with >2000 counts | High rate bins dominated by noise | Noise dominated (total time) | Noise dominated (detector-on time) | Marked lightcurve |
|---|---|---|---|---|---|---|---|
| A | 7211 | 6753 | 0 | 0 | 0.00% | 0.00% | 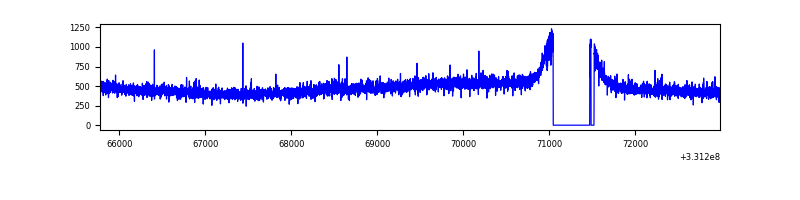 |
| B | 7211 | 6752 | 10 | 10 | 0.14% | 0.15% | 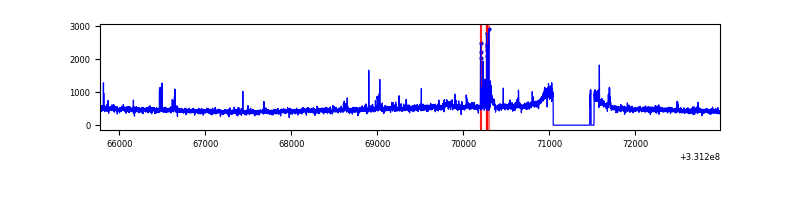 |
| C | 7211 | 6752 | 0 | 0 | 0.00% | 0.00% | 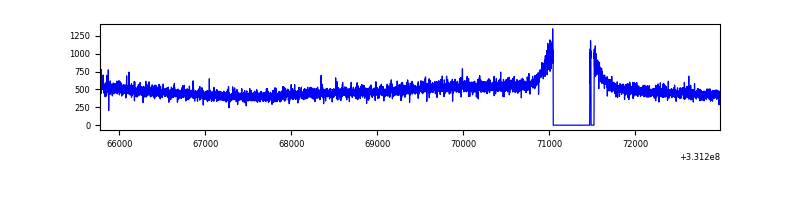 |
| D | 7211 | 6752 | 2565 | 2565 | 35.57% | 37.99% | 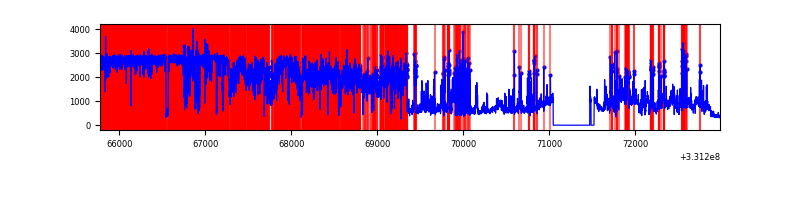 |
Top three noisy pixels from each quadrant. If the there are fewer than three noisy pixels in the level2.evt file, extra rows are filled as -1
| Pixel properties | Quadrant properties | ||||||
|---|---|---|---|---|---|---|---|
| Quadrant | DetID | PixID | Counts | Sigma | Mean | Median | Sigma |
| A | 13 | 254 | 11285 | 62.04 | 838 | 821 | 168.7 |
| A | 3 | 137 | 7836 | 41.59 | 838 | 821 | 168.7 |
| A | 0 | 226 | 7085 | 37.14 | 838 | 821 | 168.7 |
| B | 5 | 172 | 61287 | 375.25 | 837 | 817 | 161.1 |
| B | 4 | 171 | 37849 | 229.8 | 837 | 817 | 161.1 |
| B | 15 | 33 | 26549 | 159.68 | 837 | 817 | 161.1 |
| C | 14 | 238 | 131208 | 688.68 | 807 | 811 | 189.3 |
| C | 3 | 233 | 27183 | 139.28 | 807 | 811 | 189.3 |
| C | 1 | 16 | 5791 | 26.3 | 807 | 811 | 189.3 |
| D | 1 | 52 | 8204560 | 55939.83 | 597 | 579 | 146.7 |
| D | 7 | 80 | 300572 | 2045.54 | 597 | 579 | 146.7 |
| D | 12 | 227 | 63911 | 431.84 | 597 | 579 | 146.7 |
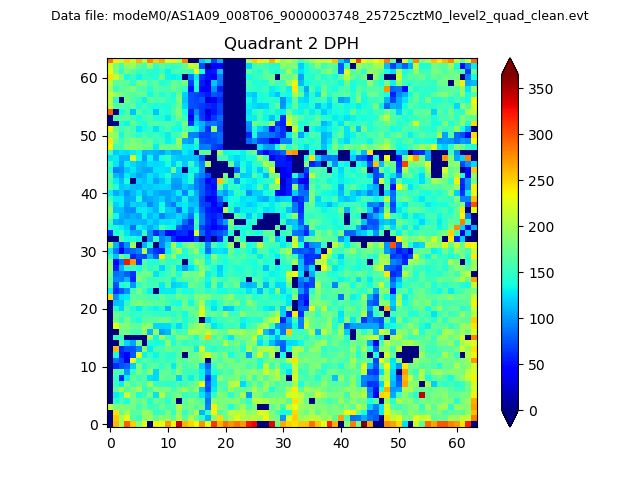
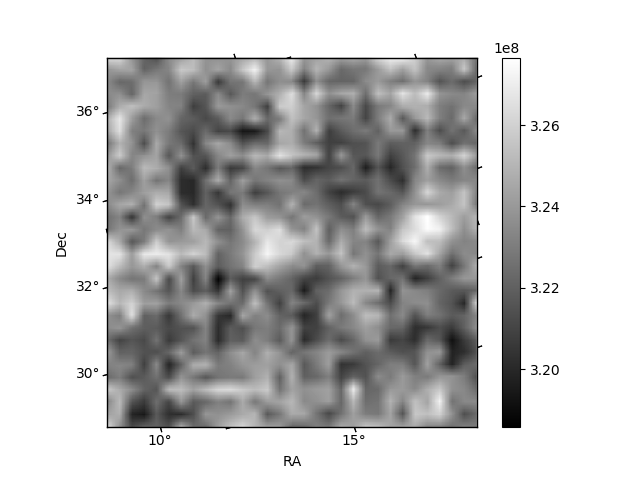
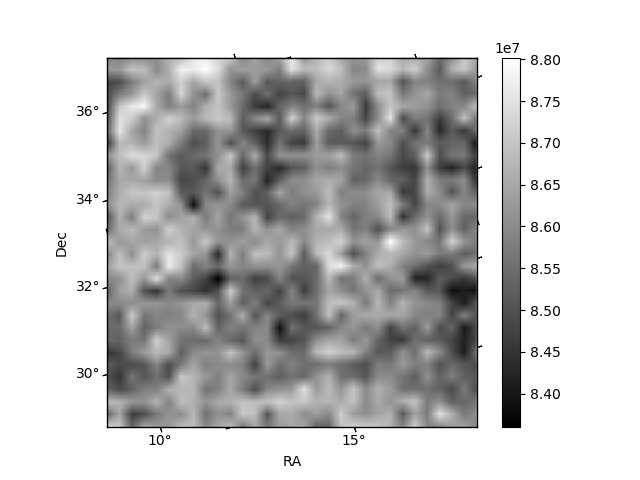
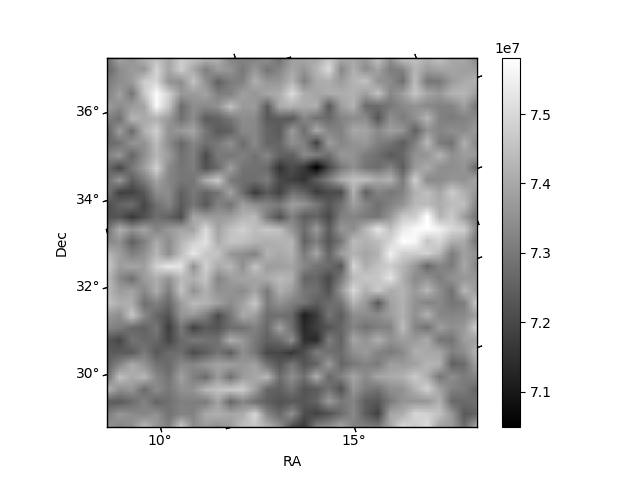
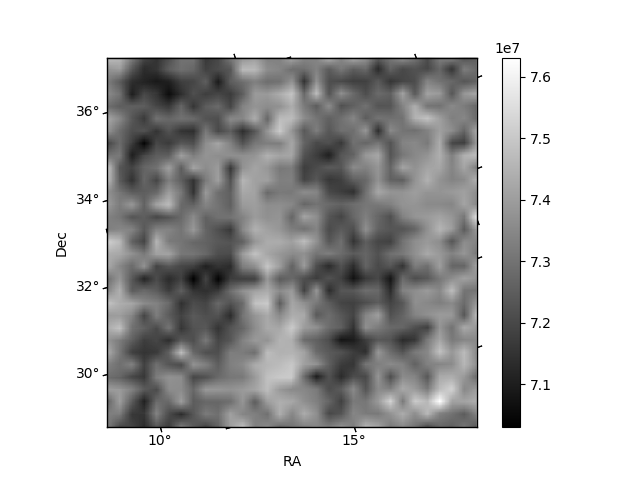
Histogram calculated using DETX and DETY for each event in the final _common_clean file
| Quadrant A | 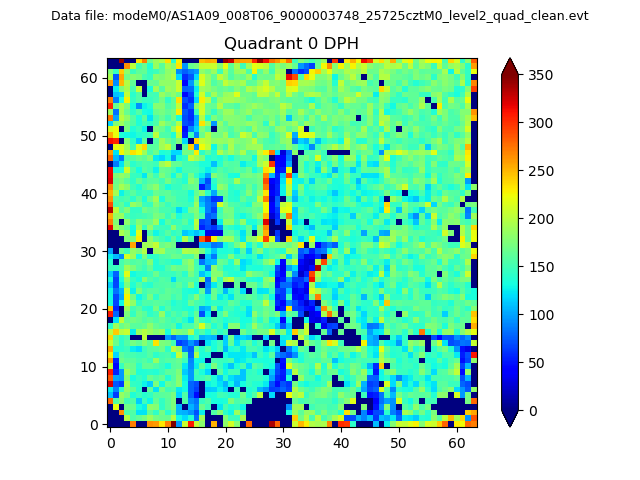 |
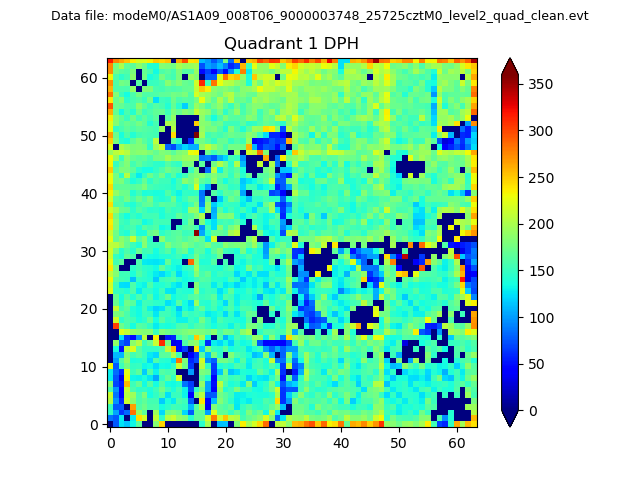 |
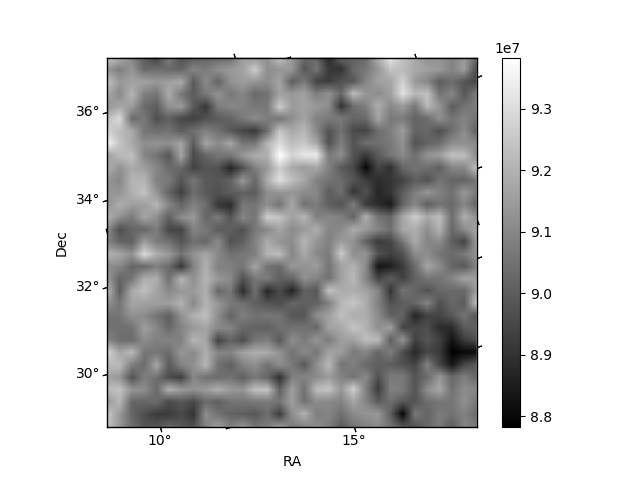
Quadrant B |
|---|---|---|---|
| Quadrant D | 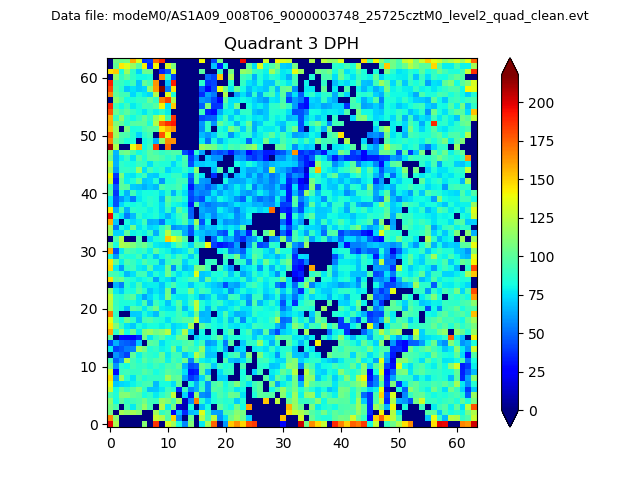 |
 |
Quadrant C |
| Plot type | Count rate plots | Images |
|---|---|---|
| Comparison with Poisson distribution Blue bars denote a histogram of data divided into 1 sec bins. Red curve is a Poisson curve with rate = median count rate of data. |
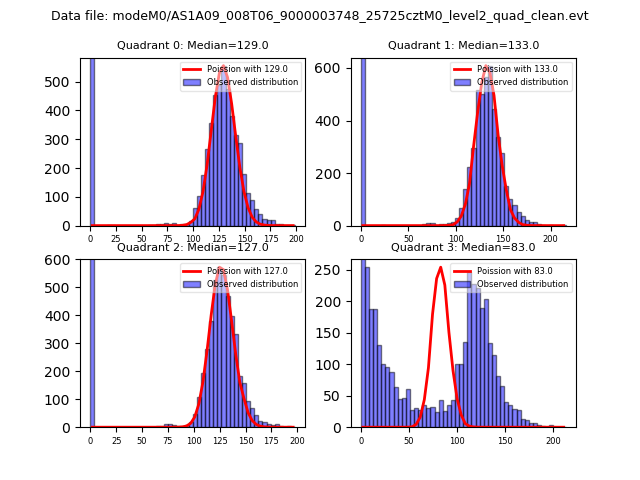 |
 |
| Quadrant-wise count rates Data is divided into 100 sec bins |
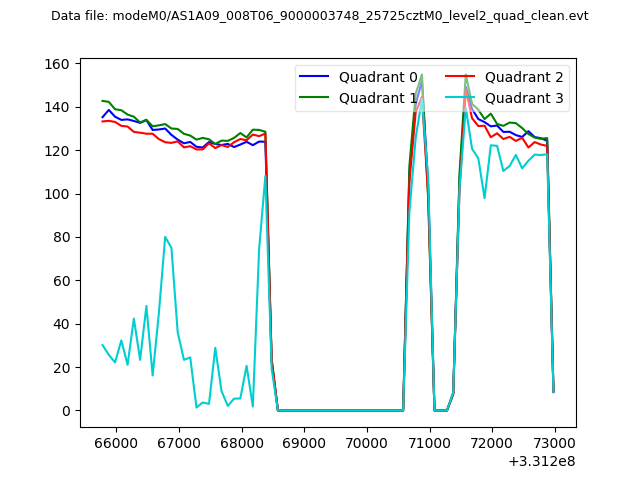 |
|
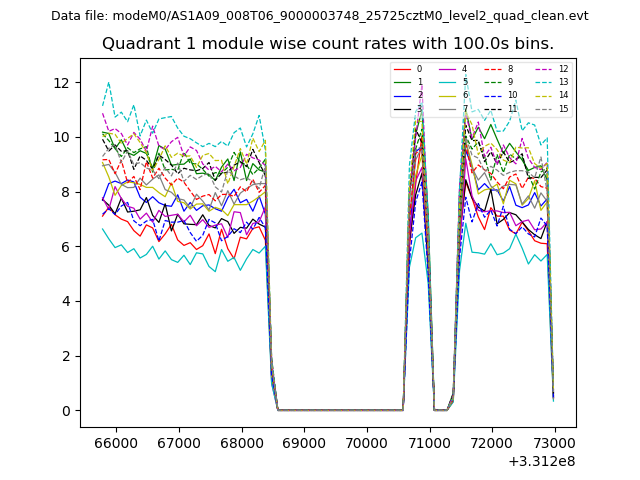
| Module-wise count rates for Quadrant A Data is divided into 100 sec bins |
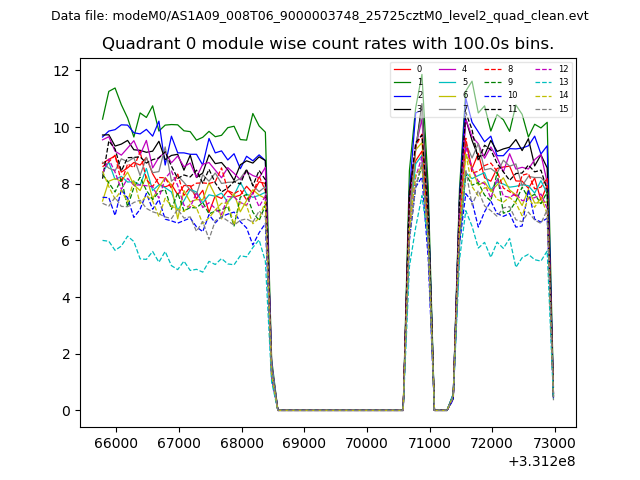 |
 |
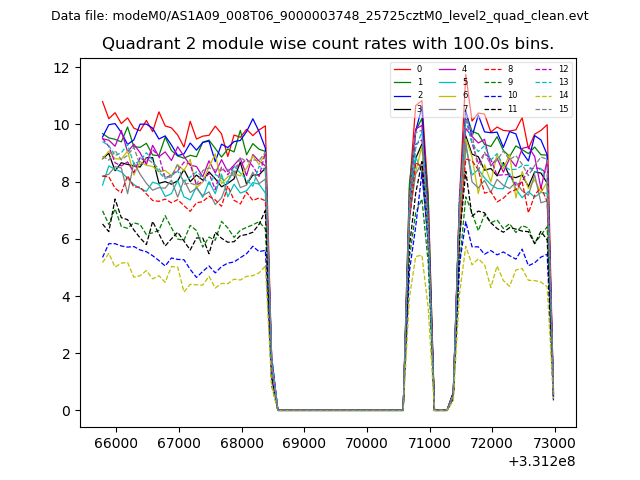
| Module-wise count rates for Quadrant B Data is divided into 100 sec bins |
 |
 |
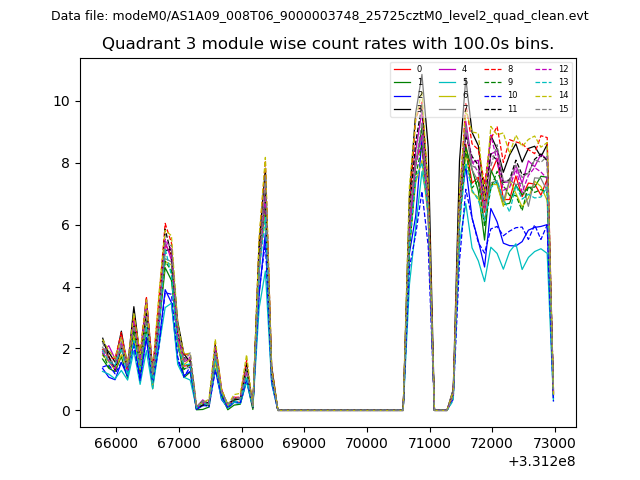
| Module-wise count rates for Quadrant C Data is divided into 100 sec bins |
 |
 |
| Module-wise count rates for Quadrant D Data is divided into 100 sec bins |
 |
 |
| Parameter | Plot |
|---|---|
| CZT HV Monitor | 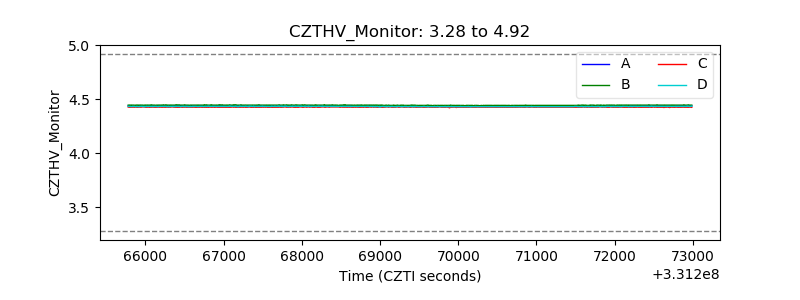 |
| D_VDD | 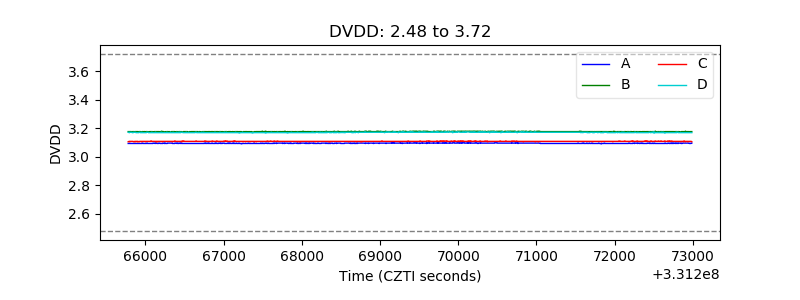 |
| Temperature 1 | 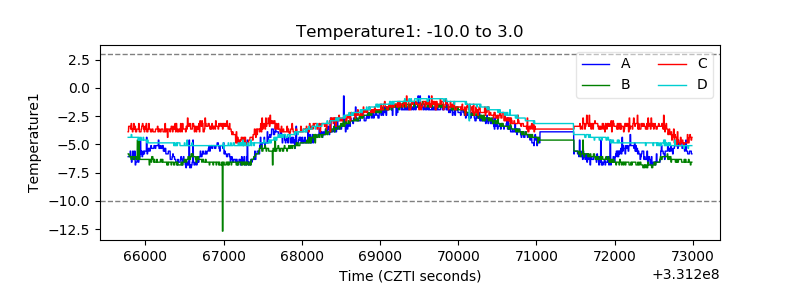 |
| Veto HV Monitor | 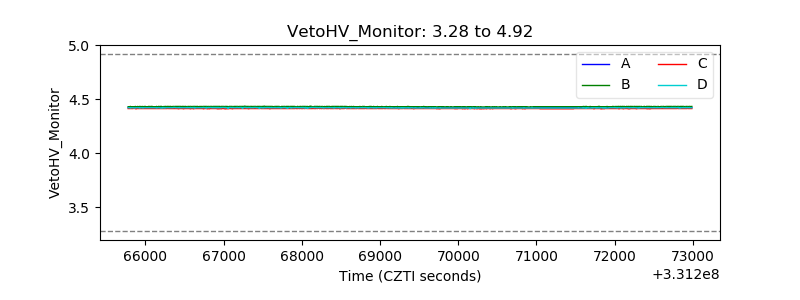 |
| Veto LLD | 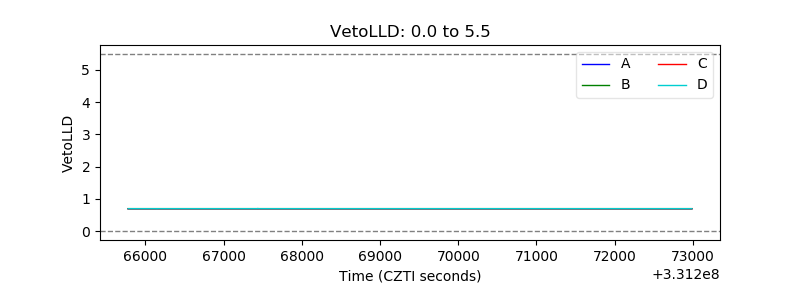 |
| Alpha Counter |  |
| _CPM_Rate | 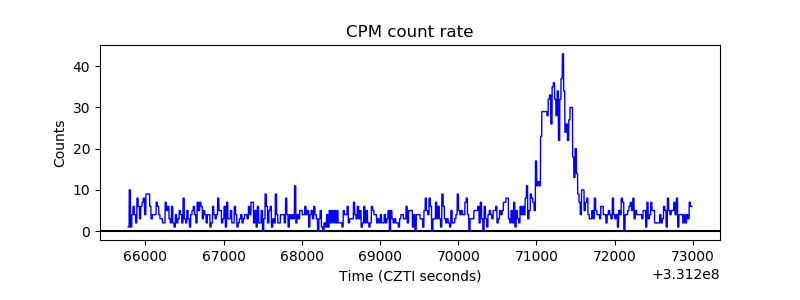 |
| CZT Counter |  |
| +2.5 Volts monitor | 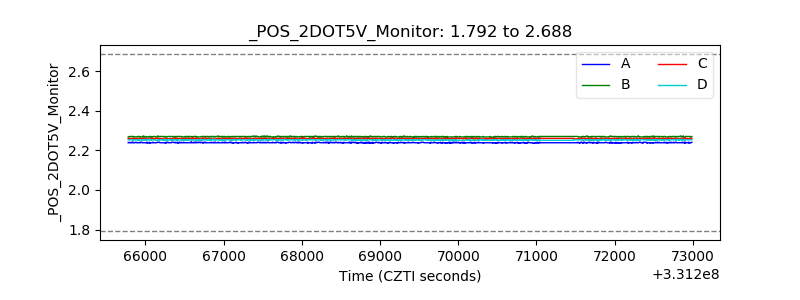 |
| +5 Volts monitor |  |
| _ROLL_ROT | 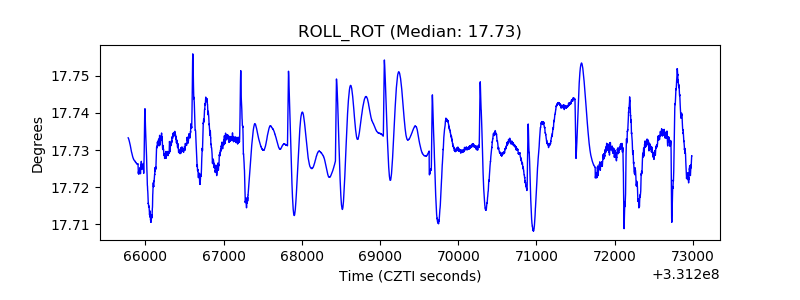 |
| _Roll_DEC | 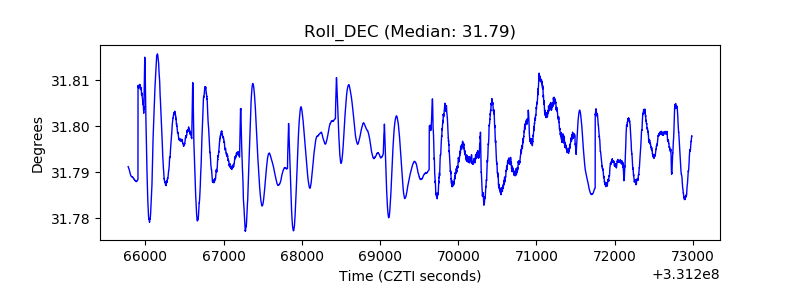 |
| _Roll_RA | 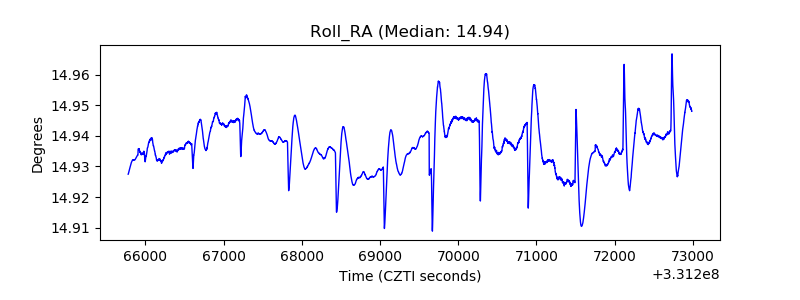 |
| Veto Counter | 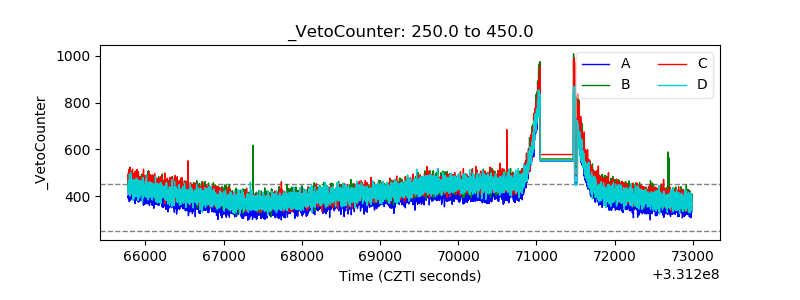 |