| Param | Original file | Final file |
|---|---|---|
| Filename | modeM0/AS1A09_008T06_9000003748_25726cztM0_level2.evt | modeM0/AS1A09_008T06_9000003748_25726cztM0_level2_quad_clean.evt |
| Size (bytes) | 388,915,200 | 59,077,440 |
| Size | 370.9 MB | 56.3 MB |
| Events in quadrant A | 2,335,946 | 377,365 |
| Events in quadrant B | 2,438,772 | 382,746 |
| Events in quadrant C | 2,360,005 | 368,129 |
| Events in quadrant D | 4,324,508 | 331,290 |
| Mode M0 | |||
|---|---|---|---|
| Quadrant | BADHDUFLAG | Total packets | Discarded packets |
| A | 0 | 9783 | 0 |
| B | 0 | 10055 | 0 |
| C | 0 | 9784 | 0 |
| D | 0 | 16009 | 0 |
| Mode M9 | |||
|---|---|---|---|
| Quadrant | BADHDUFLAG | Total packets | Discarded packets |
| A | 0 | 2 | 1 |
| B | 0 | 1 | 0 |
| C | 0 | 1 | 0 |
| D | 0 | 2 | 1 |
| Quadrant | Total seconds | Saturated seconds | Saturation percentage |
|---|---|---|---|
| A | 4607 | 107 | 2.322553% |
| B | 4576 | 182 | 3.977273% |
| C | 4618 | 136 | 2.944998% |
| D | 4563 | 612 | 13.412229% |
Noise dominated data is calculated using 1-second bins in cleaned event files. If a bin has >2000 counts, and if more than 50% of those come from <1% of pixels, then it is considered to be noise-dominated and hence unusable.
| Quadrant | # 1 sec bins | Bins with >0 counts | Bins with >2000 counts | High rate bins dominated by noise | Noise dominated (total time) | Noise dominated (detector-on time) | Marked lightcurve |
|---|---|---|---|---|---|---|---|
| A | 5352 | 4784 | 0 | 0 | 0.00% | 0.00% | 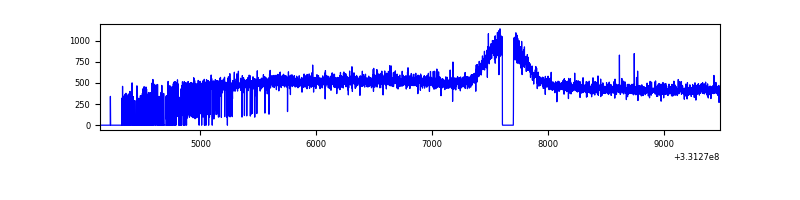 |
| B | 5177 | 4757 | 25 | 25 | 0.48% | 0.53% | 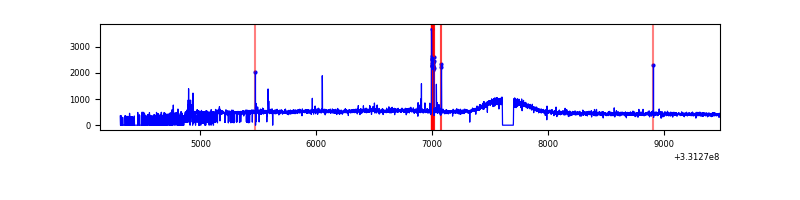 |
| C | 5189 | 4768 | 0 | 0 | 0.00% | 0.00% | 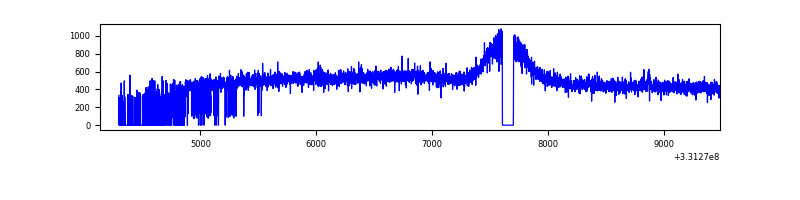 |
| D | 5346 | 4722 | 432 | 432 | 8.08% | 9.15% | 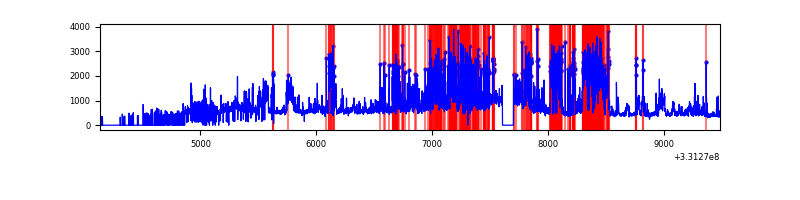 |
Top three noisy pixels from each quadrant. If the there are fewer than three noisy pixels in the level2.evt file, extra rows are filled as -1
| Pixel properties | Quadrant properties | ||||||
|---|---|---|---|---|---|---|---|
| Quadrant | DetID | PixID | Counts | Sigma | Mean | Median | Sigma |
| A | 0 | 13 | 12270 | 94.44 | 601 | 586 | 123.7 |
| A | 13 | 254 | 7378 | 54.9 | 601 | 586 | 123.7 |
| A | 3 | 137 | 5784 | 42.02 | 601 | 586 | 123.7 |
| B | 4 | 171 | 65712 | 559.32 | 594 | 578 | 116.5 |
| B | 12 | 111 | 14421 | 118.87 | 594 | 578 | 116.5 |
| B | 0 | 245 | 13174 | 108.16 | 594 | 578 | 116.5 |
| C | 14 | 238 | 91407 | 654.85 | 578 | 580 | 138.7 |
| C | 3 | 233 | 9420 | 63.74 | 578 | 580 | 138.7 |
| C | 8 | 128 | 4374 | 27.35 | 578 | 580 | 138.7 |
| D | 7 | 80 | 1549370 | 11172.84 | 555 | 537 | 138.6 |
| D | 1 | 52 | 471420 | 3396.82 | 555 | 537 | 138.6 |
| D | 2 | 244 | 99945 | 717.1 | 555 | 537 | 138.6 |
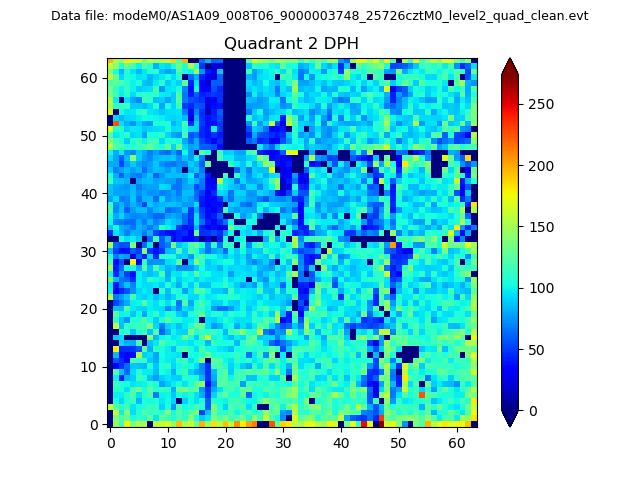
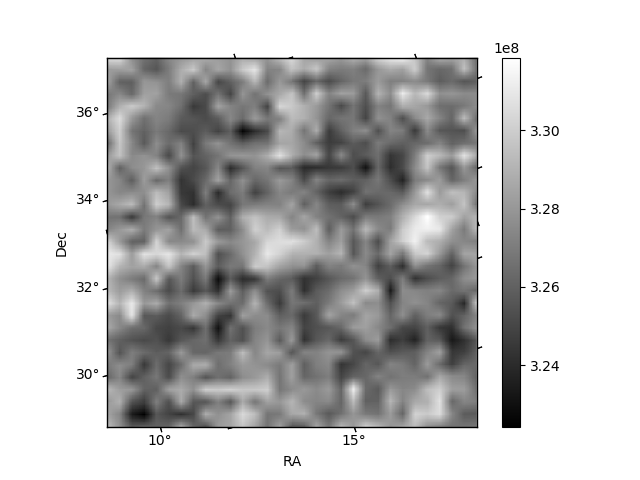
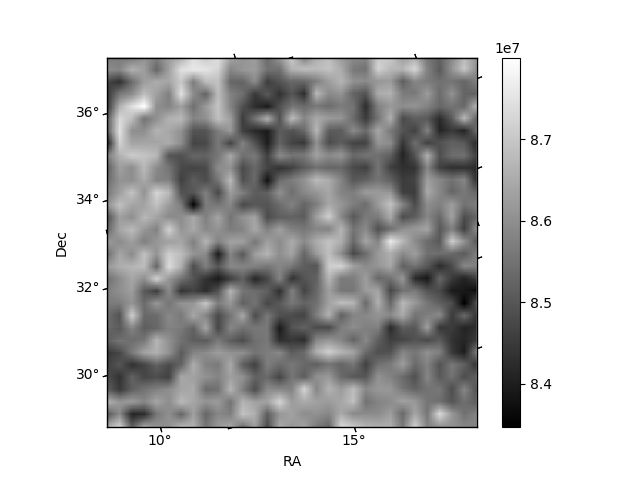
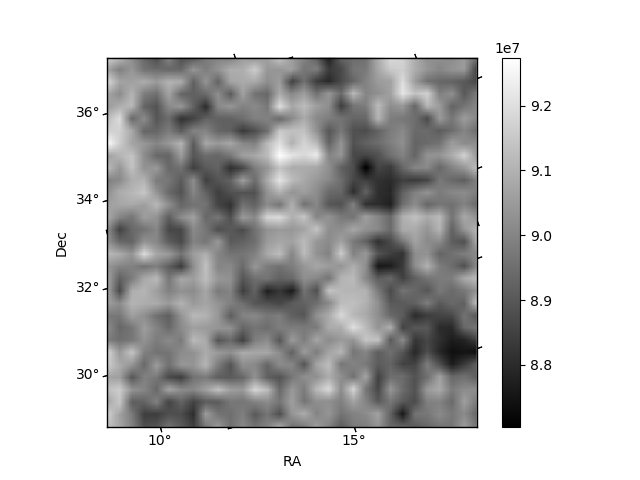
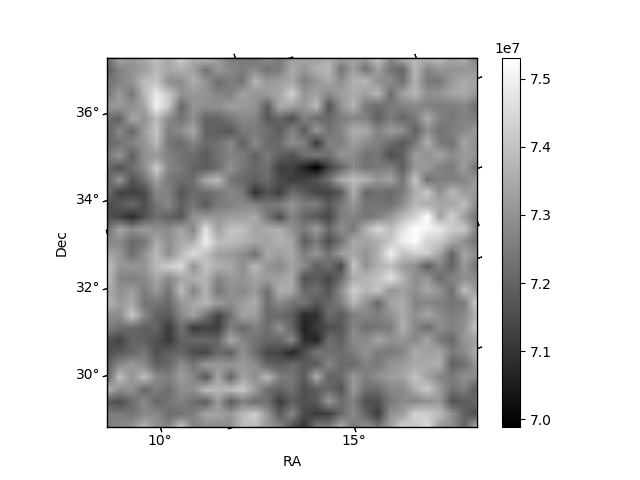
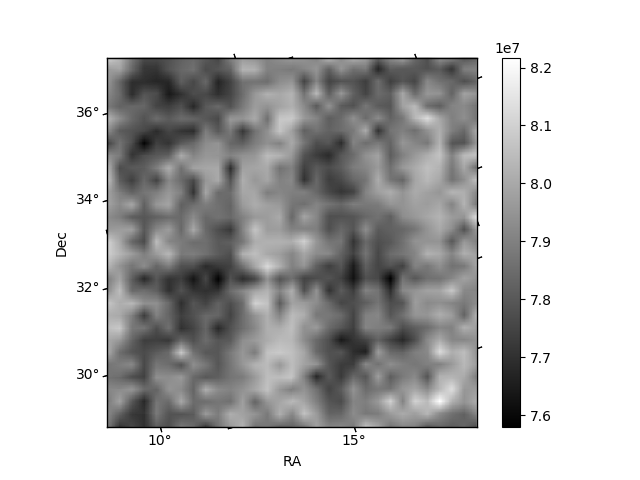
Histogram calculated using DETX and DETY for each event in the final _common_clean file
| Quadrant A | 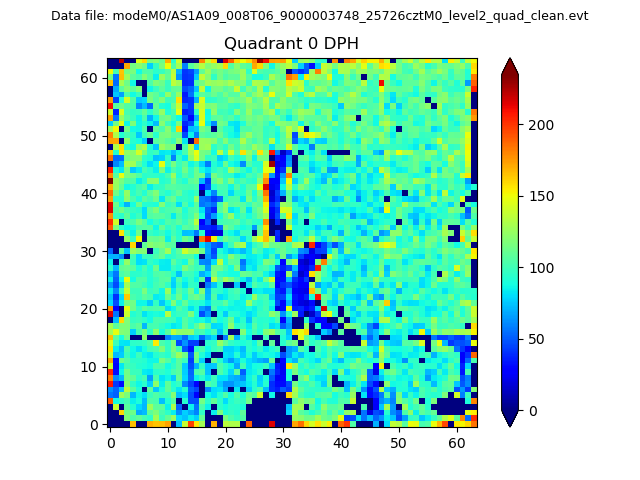 |
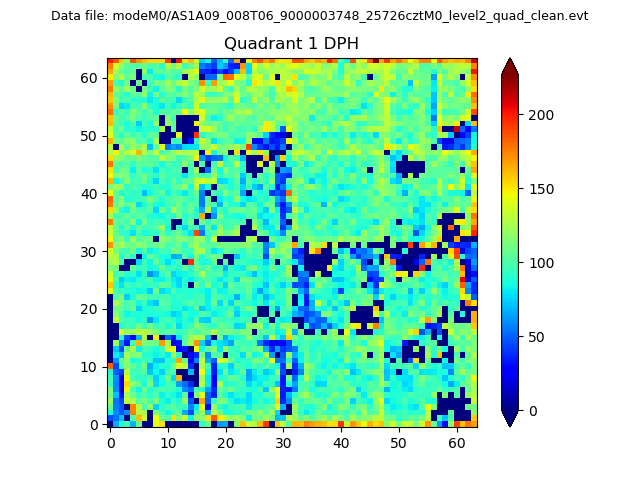 |
Quadrant B |
|---|---|---|---|
| Quadrant D | 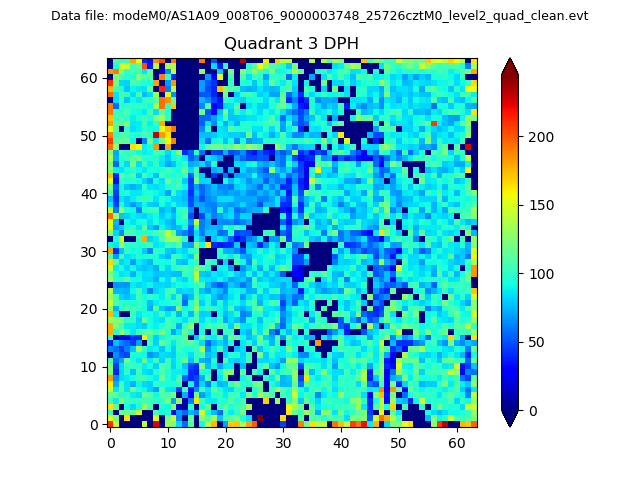 |
 |
Quadrant C |
| Plot type | Count rate plots | Images |
|---|---|---|
| Comparison with Poisson distribution Blue bars denote a histogram of data divided into 1 sec bins. Red curve is a Poisson curve with rate = median count rate of data. |
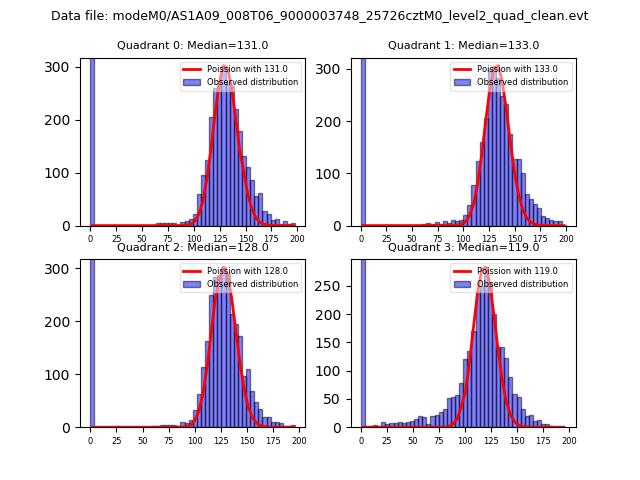 |
 |
| Quadrant-wise count rates Data is divided into 100 sec bins |
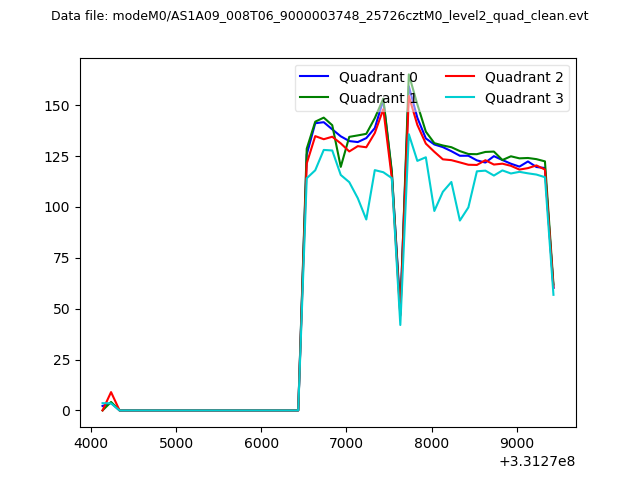 |
|
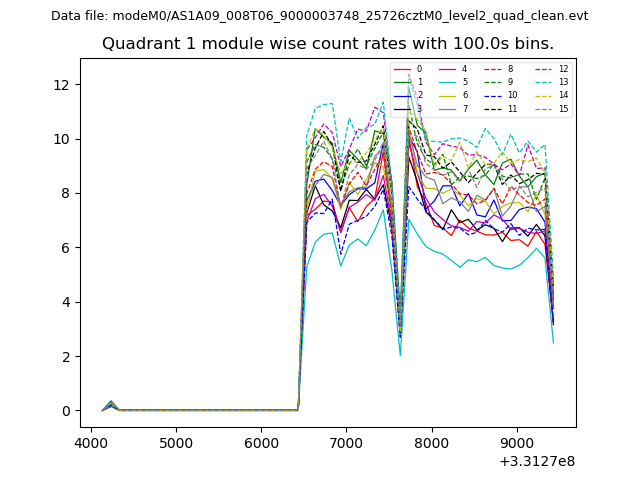
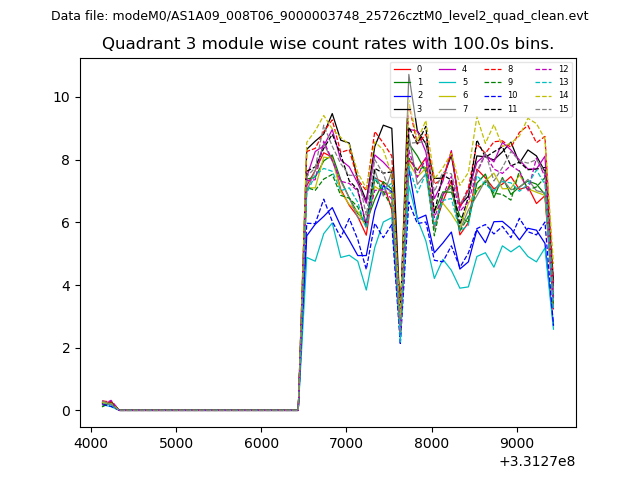
| Module-wise count rates for Quadrant A Data is divided into 100 sec bins |
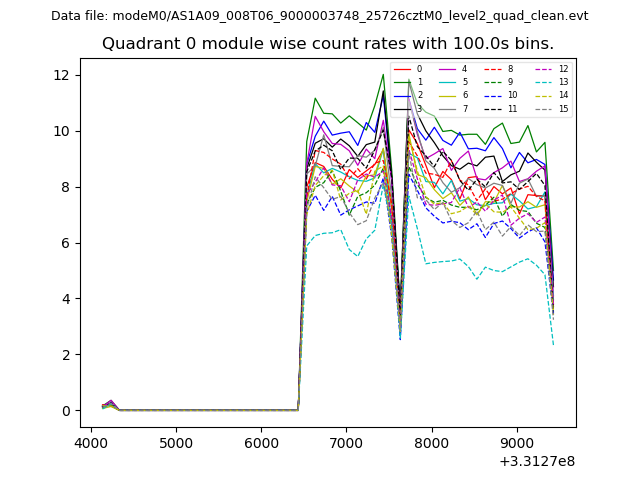 |
 |
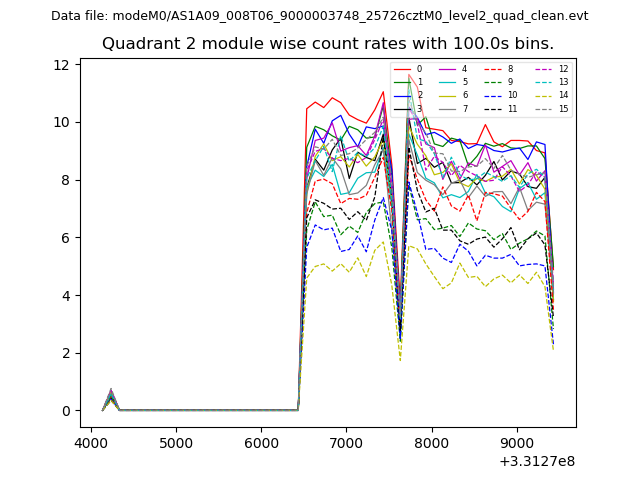
| Module-wise count rates for Quadrant B Data is divided into 100 sec bins |
 |
 |
| Module-wise count rates for Quadrant C Data is divided into 100 sec bins |
 |
 |
| Module-wise count rates for Quadrant D Data is divided into 100 sec bins |
 |
 |
| Parameter | Plot |
|---|---|
| CZT HV Monitor | 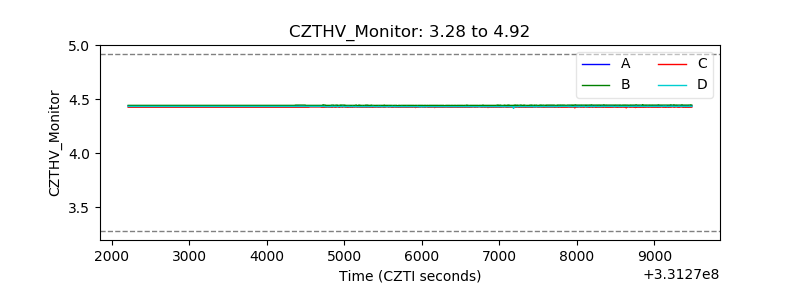 |
| D_VDD |  |
| Temperature 1 | 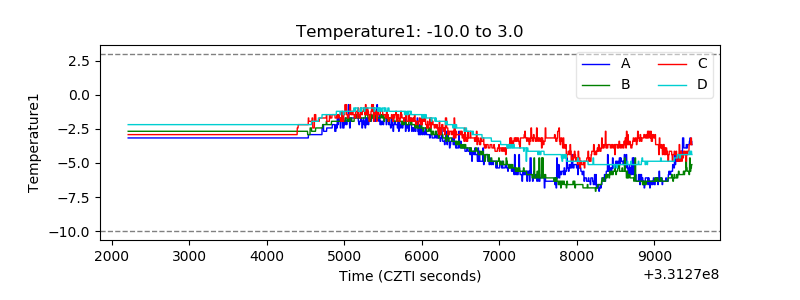 |
| Veto HV Monitor | 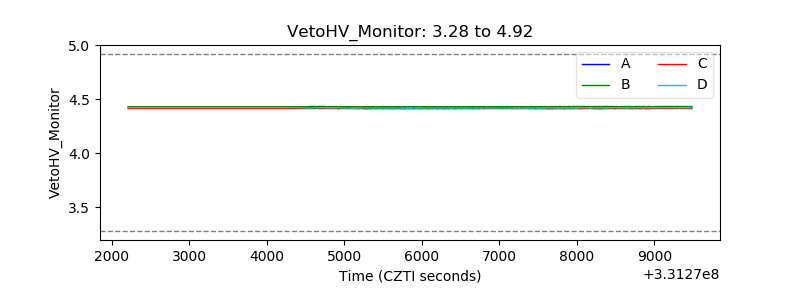 |
| Veto LLD | 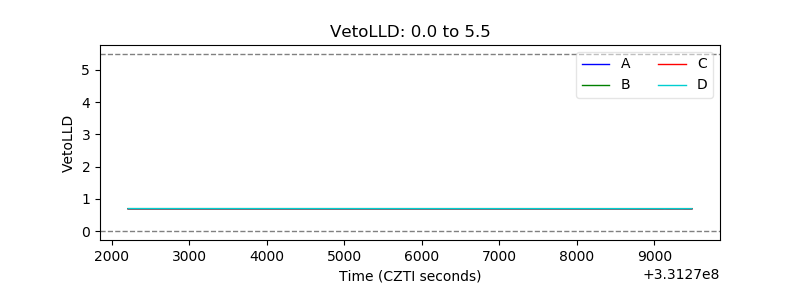 |
| Alpha Counter | 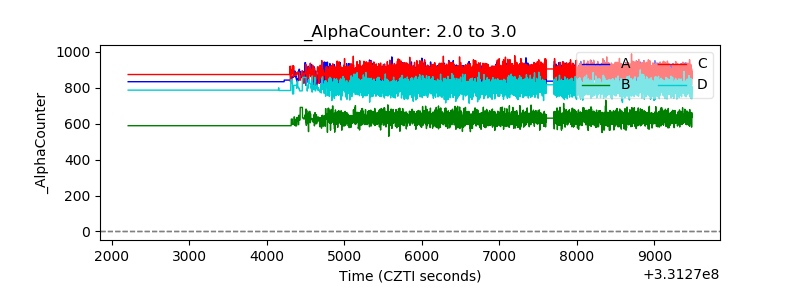 |
| _CPM_Rate | 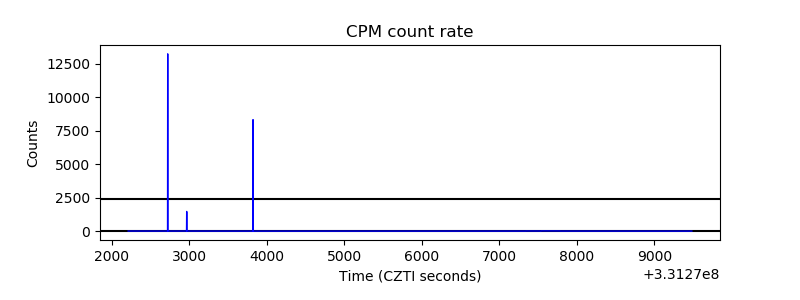 |
| CZT Counter | 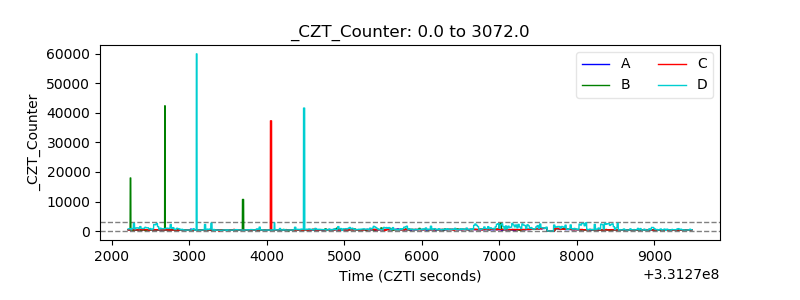 |
| +2.5 Volts monitor | 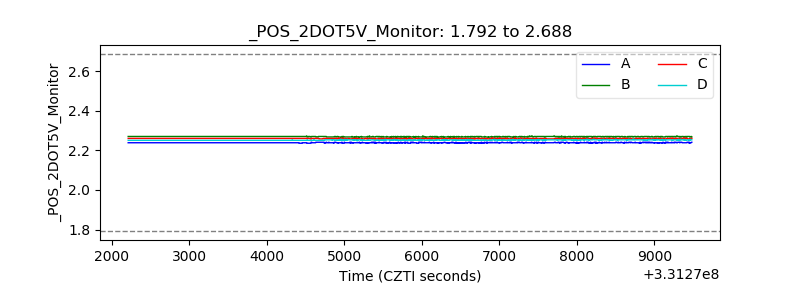 |
| +5 Volts monitor |  |
| _ROLL_ROT | 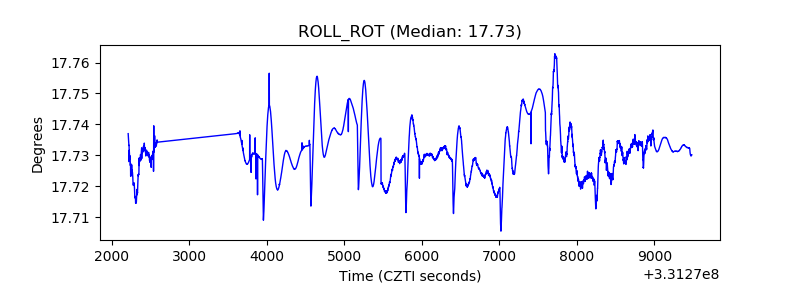 |
| _Roll_DEC | 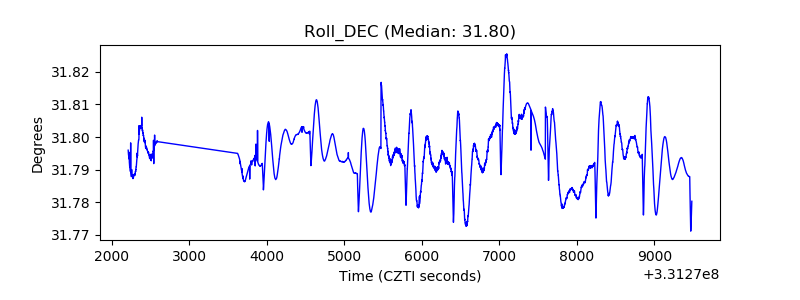 |
| _Roll_RA | 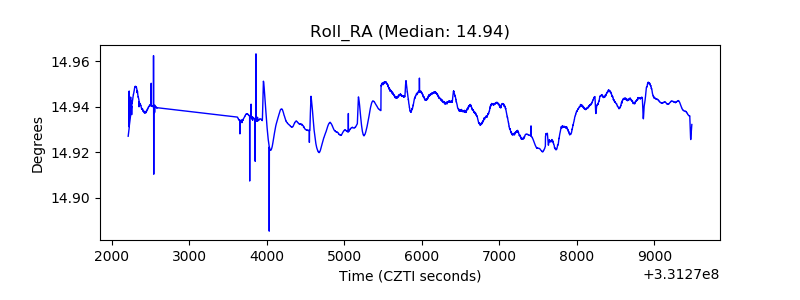 |
| Veto Counter | 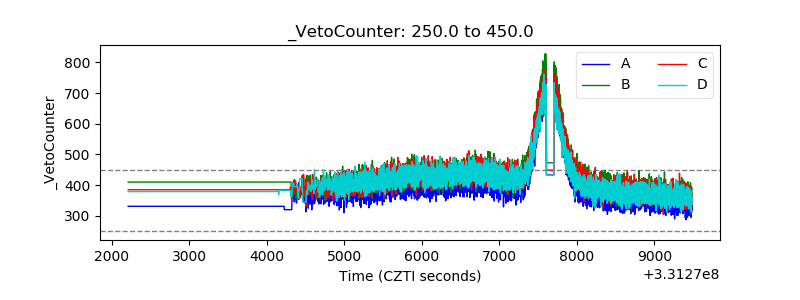 |