| Param | Original file | Final file |
|---|---|---|
| Filename | modeM0/AS1A09_008T06_9000003748_25727cztM0_level2.evt | modeM0/AS1A09_008T06_9000003748_25727cztM0_level2_quad_clean.evt |
| Size (bytes) | 1,010,085,120 | 168,802,560 |
| Size | 963.3 MB | 161.0 MB |
| Events in quadrant A | 6,155,710 | 1,077,406 |
| Events in quadrant B | 6,382,060 | 1,100,373 |
| Events in quadrant C | 6,205,127 | 1,059,971 |
| Events in quadrant D | 10,977,036 | 984,380 |
| Mode M0 | |||
|---|---|---|---|
| Quadrant | BADHDUFLAG | Total packets | Discarded packets |
| A | 0 | 26606 | 0 |
| B | 0 | 27158 | 0 |
| C | 0 | 26660 | 0 |
| D | 0 | 41646 | 0 |
| Mode M9 | |||
|---|---|---|---|
| Quadrant | BADHDUFLAG | Total packets | Discarded packets |
| A | 0 | 4 | 0 |
| B | 0 | 4 | 0 |
| C | 0 | 4 | 0 |
| D | 0 | 4 | 0 |
| Quadrant | Total seconds | Saturated seconds | Saturation percentage |
|---|---|---|---|
| A | 12856 | 177 | 1.376789% |
| B | 12850 | 273 | 2.124514% |
| C | 12869 | 227 | 1.763929% |
| D | 12853 | 1170 | 9.102933% |
Noise dominated data is calculated using 1-second bins in cleaned event files. If a bin has >2000 counts, and if more than 50% of those come from <1% of pixels, then it is considered to be noise-dominated and hence unusable.
| Quadrant | # 1 sec bins | Bins with >0 counts | Bins with >2000 counts | High rate bins dominated by noise | Noise dominated (total time) | Noise dominated (detector-on time) | Marked lightcurve |
|---|---|---|---|---|---|---|---|
| A | 13550 | 12941 | 0 | 0 | 0.00% | 0.00% | 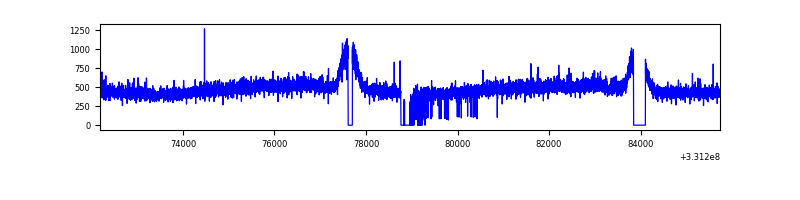 |
| B | 13551 | 12932 | 27 | 27 | 0.20% | 0.21% | 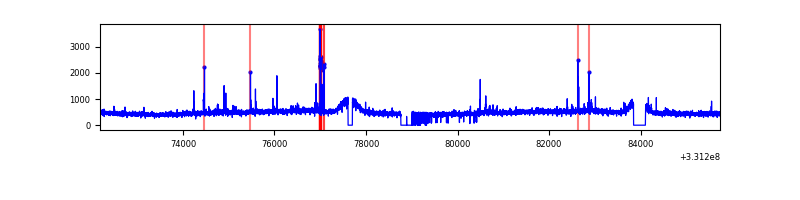 |
| C | 13551 | 12946 | 0 | 0 | 0.00% | 0.00% | 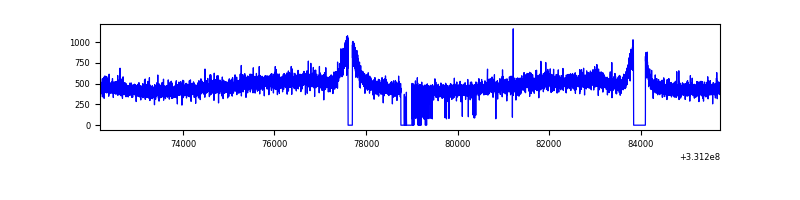 |
| D | 13551 | 12937 | 750 | 750 | 5.53% | 5.80% | 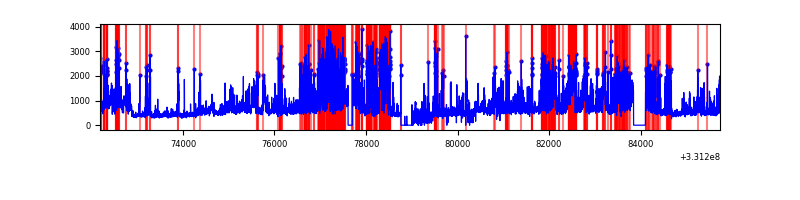 |
Top three noisy pixels from each quadrant. If the there are fewer than three noisy pixels in the level2.evt file, extra rows are filled as -1
| Pixel properties | Quadrant properties | ||||||
|---|---|---|---|---|---|---|---|
| Quadrant | DetID | PixID | Counts | Sigma | Mean | Median | Sigma |
| A | 0 | 13 | 36020 | 108.11 | 1577 | 1545 | 318.9 |
| A | 6 | 16 | 35824 | 107.49 | 1577 | 1545 | 318.9 |
| A | 13 | 254 | 20888 | 60.66 | 1577 | 1545 | 318.9 |
| B | 4 | 171 | 87461 | 286.58 | 1570 | 1529 | 299.9 |
| B | 3 | 112 | 56938 | 184.78 | 1570 | 1529 | 299.9 |
| B | 12 | 111 | 37272 | 119.2 | 1570 | 1529 | 299.9 |
| C | 14 | 238 | 240274 | 673.36 | 1511 | 1518 | 354.6 |
| C | 3 | 233 | 38939 | 105.54 | 1511 | 1518 | 354.6 |
| C | 1 | 16 | 21998 | 57.76 | 1511 | 1518 | 354.6 |
| D | 1 | 52 | 2669438 | 7263.68 | 1490 | 1443 | 367.3 |
| D | 7 | 80 | 1965483 | 5347.15 | 1490 | 1443 | 367.3 |
| D | 8 | 195 | 306302 | 829.99 | 1490 | 1443 | 367.3 |
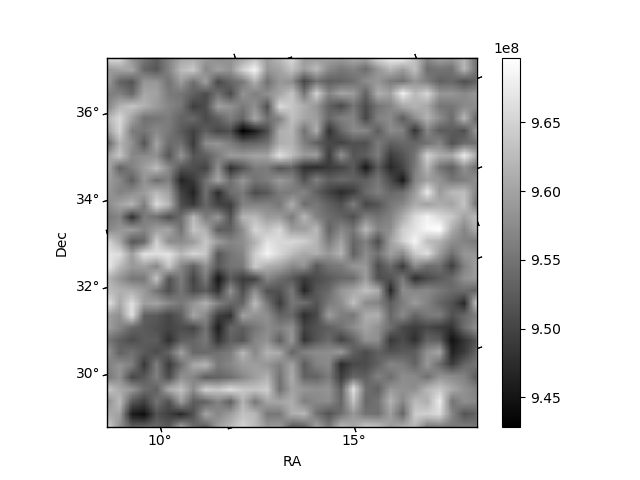
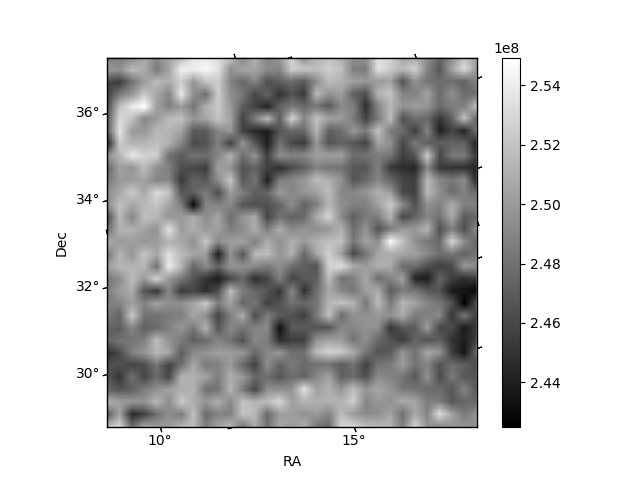
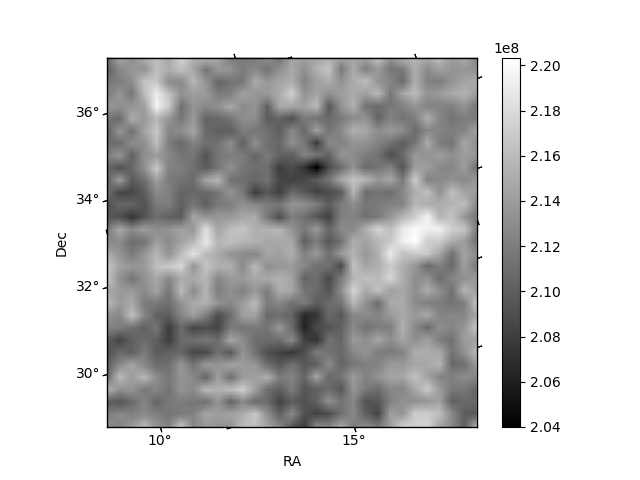
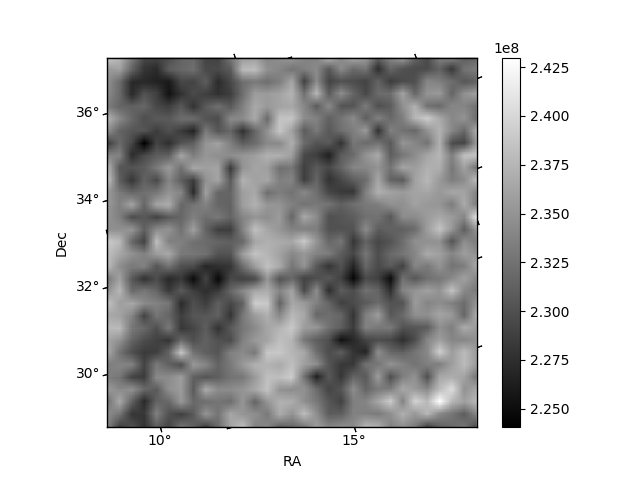
Histogram calculated using DETX and DETY for each event in the final _common_clean file
| Quadrant A | 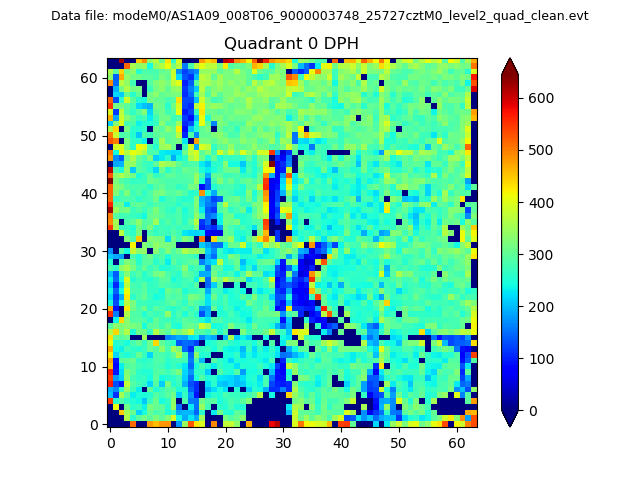 |
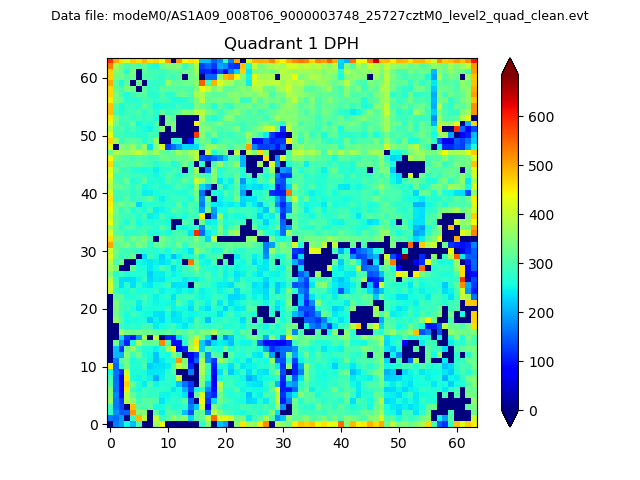 |
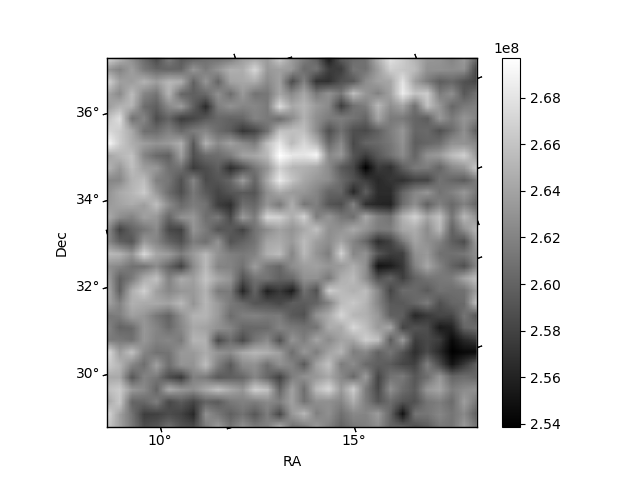
Quadrant B |
|---|---|---|---|
| Quadrant D | 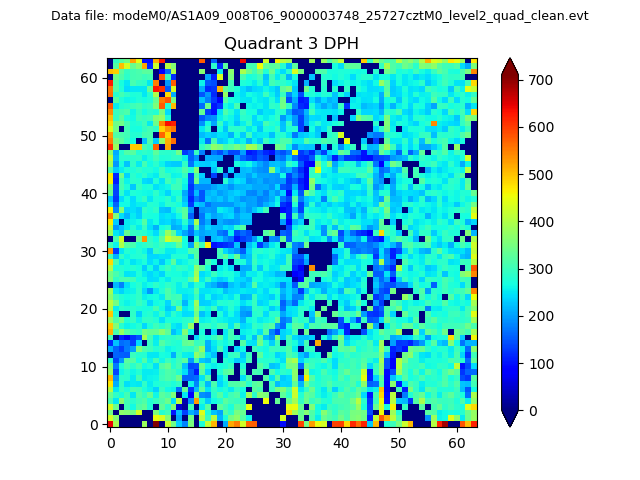 |
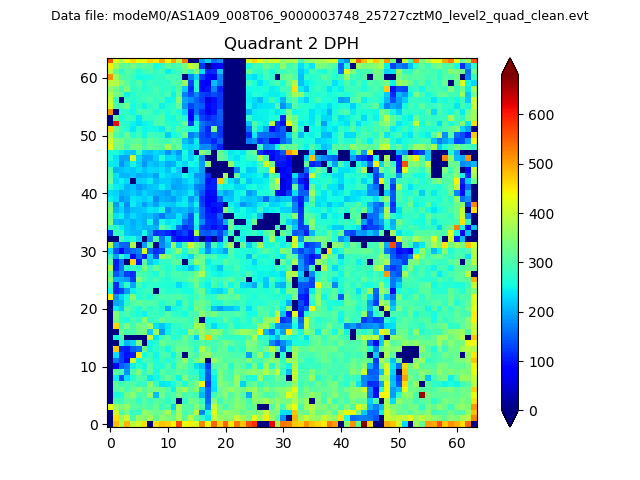 |
Quadrant C |
| Plot type | Count rate plots | Images |
|---|---|---|
| Comparison with Poisson distribution Blue bars denote a histogram of data divided into 1 sec bins. Red curve is a Poisson curve with rate = median count rate of data. |
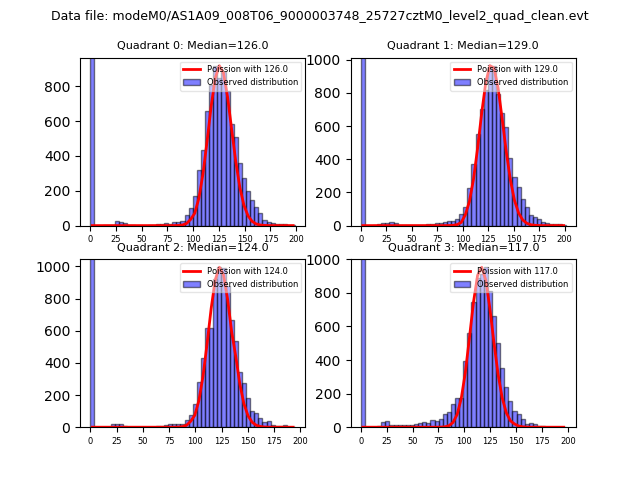 |
 |
| Quadrant-wise count rates Data is divided into 100 sec bins |
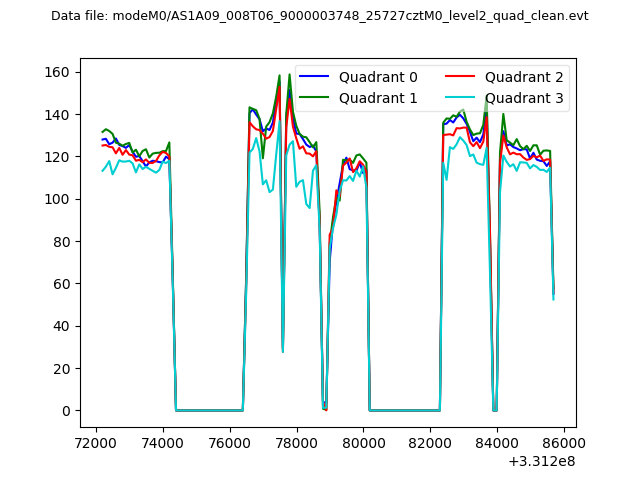 |
|
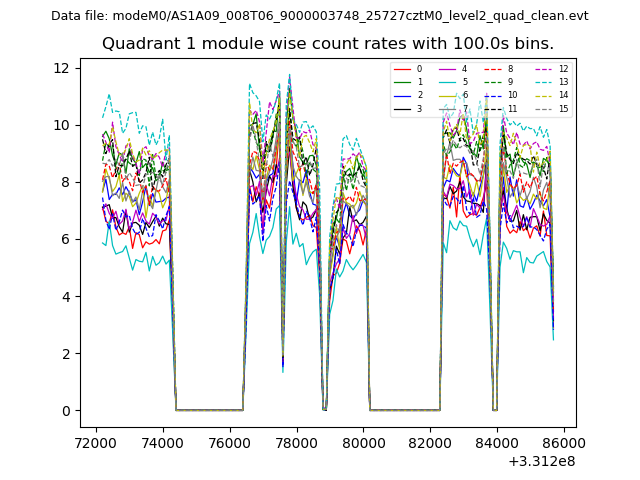
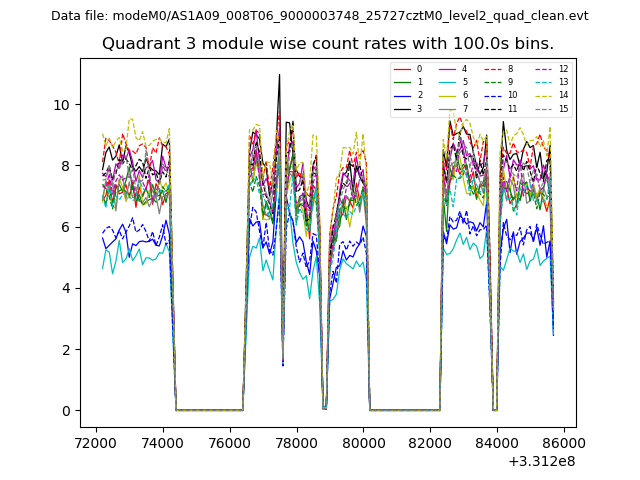
| Module-wise count rates for Quadrant A Data is divided into 100 sec bins |
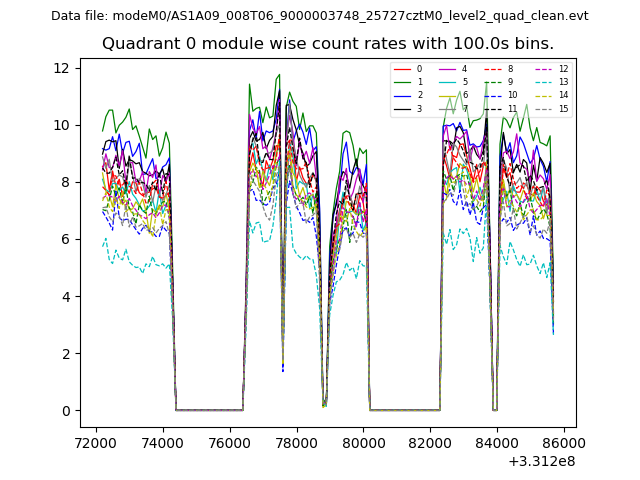 |
 |
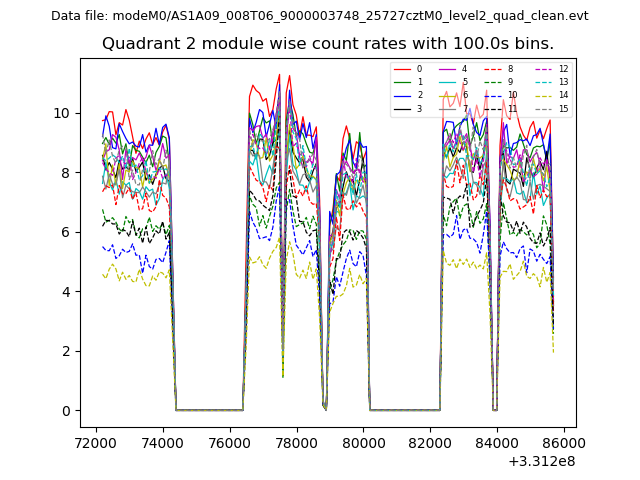
| Module-wise count rates for Quadrant B Data is divided into 100 sec bins |
 |
 |
| Module-wise count rates for Quadrant C Data is divided into 100 sec bins |
 |
 |
| Module-wise count rates for Quadrant D Data is divided into 100 sec bins |
 |
 |
| Parameter | Plot |
|---|---|
| CZT HV Monitor | 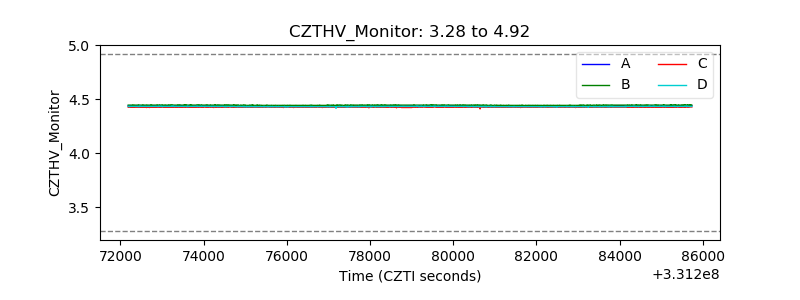 |
| D_VDD | 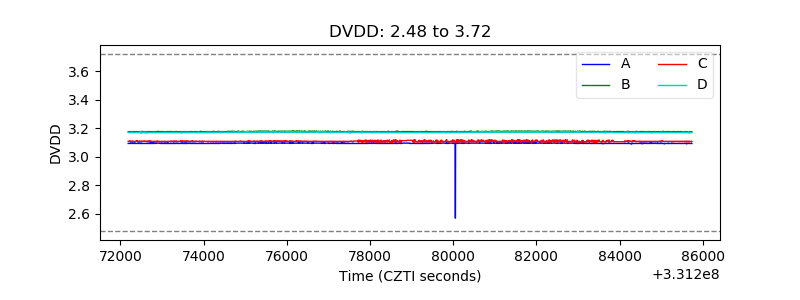 |
| Temperature 1 | 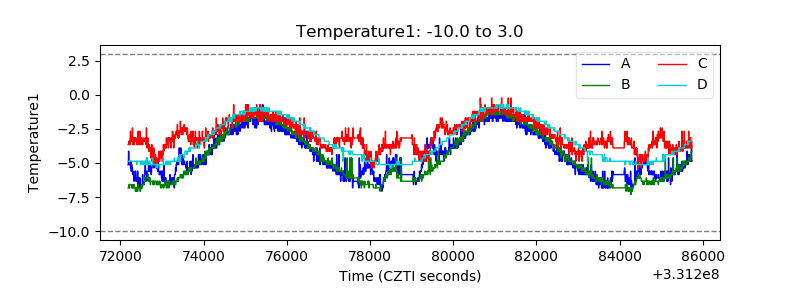 |
| Veto HV Monitor | 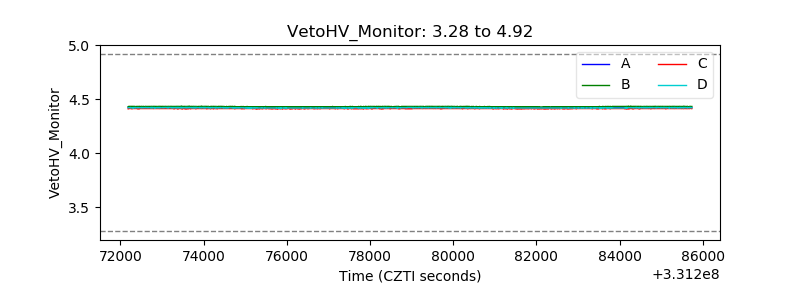 |
| Veto LLD | 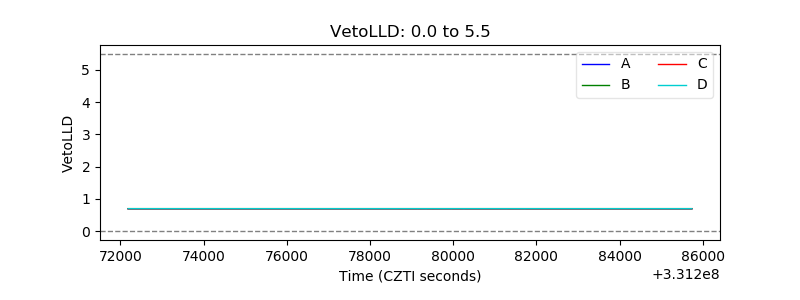 |
| Alpha Counter | 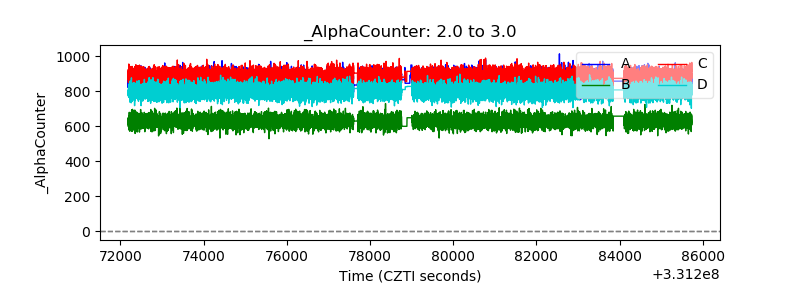 |
| _CPM_Rate | 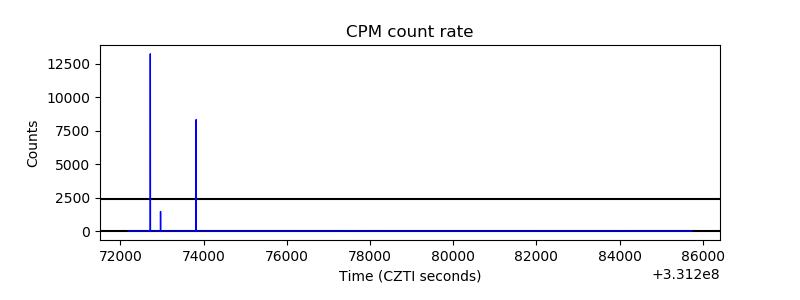 |
| CZT Counter | 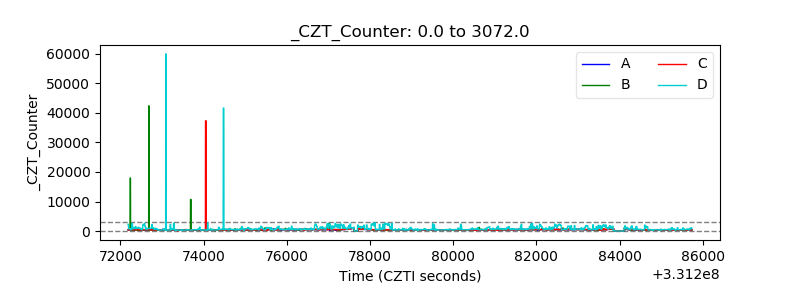 |
| +2.5 Volts monitor | 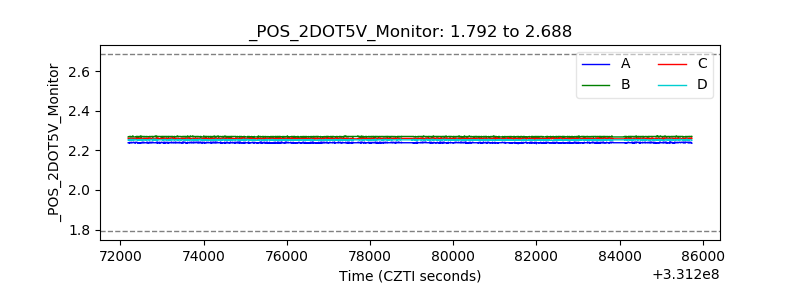 |
| +5 Volts monitor |  |
| _ROLL_ROT | 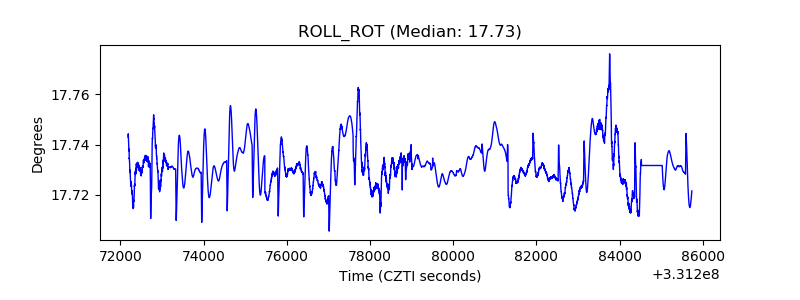 |
| _Roll_DEC | 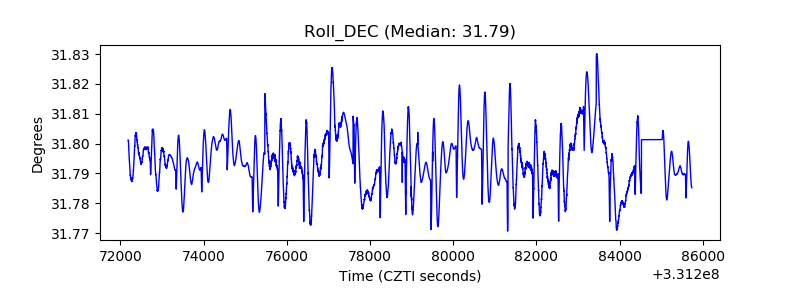 |
| _Roll_RA | 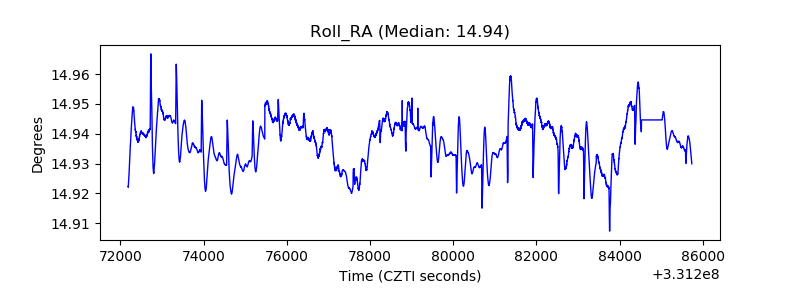 |
| Veto Counter | 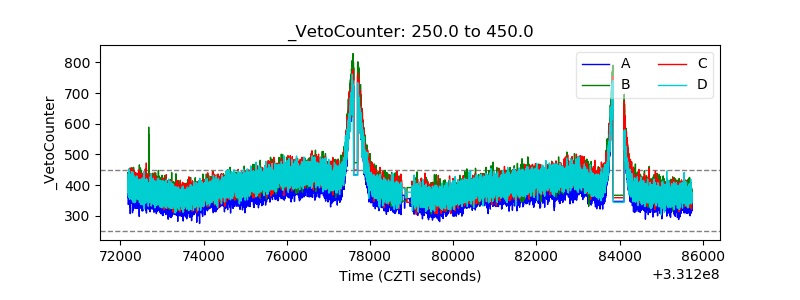 |