| Param | Original file | Final file |
|---|---|---|
| Filename | modeM0/AS1A09_008T06_9000003748_25730cztM0_level2.evt | modeM0/AS1A09_008T06_9000003748_25730cztM0_level2_quad_clean.evt |
| Size (bytes) | 1,615,089,600 | 206,115,840 |
| Size | 1.5 GB | 196.6 MB |
| Events in quadrant A | 8,710,218 | 1,335,805 |
| Events in quadrant B | 8,833,474 | 1,364,326 |
| Events in quadrant C | 8,648,003 | 1,305,961 |
| Events in quadrant D | 21,502,865 | 990,604 |
| Mode M0 | |||
|---|---|---|---|
| Quadrant | BADHDUFLAG | Total packets | Discarded packets |
| A | 0 | 37227 | 0 |
| B | 0 | 37248 | 0 |
| C | 0 | 36875 | 0 |
| D | 0 | 75910 | 0 |
| Mode M9 | |||
|---|---|---|---|
| Quadrant | BADHDUFLAG | Total packets | Discarded packets |
| A | 0 | 19 | 0 |
| B | 0 | 19 | 0 |
| C | 0 | 19 | 0 |
| D | 0 | 19 | 0 |
| Quadrant | Total seconds | Saturated seconds | Saturation percentage |
|---|---|---|---|
| A | 18057 | 182 | 1.007919% |
| B | 18058 | 224 | 1.240447% |
| C | 18058 | 243 | 1.345664% |
| D | 18058 | 5072 | 28.087274% |
Noise dominated data is calculated using 1-second bins in cleaned event files. If a bin has >2000 counts, and if more than 50% of those come from <1% of pixels, then it is considered to be noise-dominated and hence unusable.
| Quadrant | # 1 sec bins | Bins with >0 counts | Bins with >2000 counts | High rate bins dominated by noise | Noise dominated (total time) | Noise dominated (detector-on time) | Marked lightcurve |
|---|---|---|---|---|---|---|---|
| A | 19897 | 18058 | 1 | 1 | 0.01% | 0.01% |  |
| B | 19898 | 18059 | 19 | 19 | 0.10% | 0.11% |  |
| C | 19898 | 18059 | 0 | 0 | 0.00% | 0.00% |  |
| D | 19898 | 18059 | 4194 | 4194 | 21.08% | 23.22% | 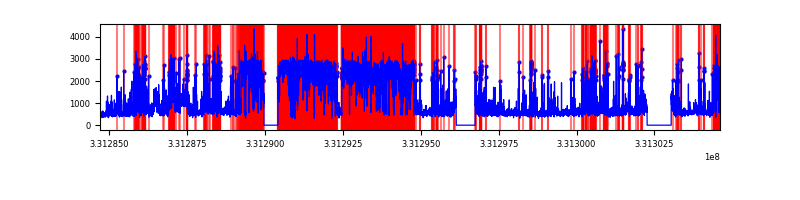 |
Top three noisy pixels from each quadrant. If the there are fewer than three noisy pixels in the level2.evt file, extra rows are filled as -1
| Pixel properties | Quadrant properties | ||||||
|---|---|---|---|---|---|---|---|
| Quadrant | DetID | PixID | Counts | Sigma | Mean | Median | Sigma |
| A | 6 | 16 | 203129 | 456.12 | 2194 | 2144 | 440.6 |
| A | 3 | 243 | 38539 | 82.6 | 2194 | 2144 | 440.6 |
| A | 13 | 254 | 28193 | 59.12 | 2194 | 2144 | 440.6 |
| B | 0 | 245 | 63902 | 148.53 | 2184 | 2128 | 415.9 |
| B | 5 | 172 | 56150 | 129.89 | 2184 | 2128 | 415.9 |
| B | 12 | 111 | 52151 | 120.28 | 2184 | 2128 | 415.9 |
| C | 14 | 238 | 337700 | 683.77 | 2095 | 2105 | 490.8 |
| C | 3 | 233 | 133616 | 267.95 | 2095 | 2105 | 490.8 |
| C | 1 | 16 | 20124 | 36.71 | 2095 | 2105 | 490.8 |
| D | 1 | 52 | 12204809 | 29060.99 | 1721 | 1669 | 419.9 |
| D | 7 | 80 | 1427591 | 3395.74 | 1721 | 1669 | 419.9 |
| D | 8 | 195 | 768107 | 1825.22 | 1721 | 1669 | 419.9 |
Histogram calculated using DETX and DETY for each event in the final _common_clean file
| Quadrant A | 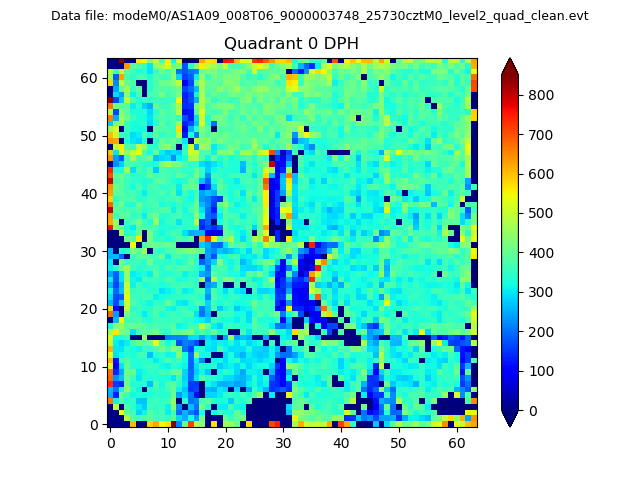 |
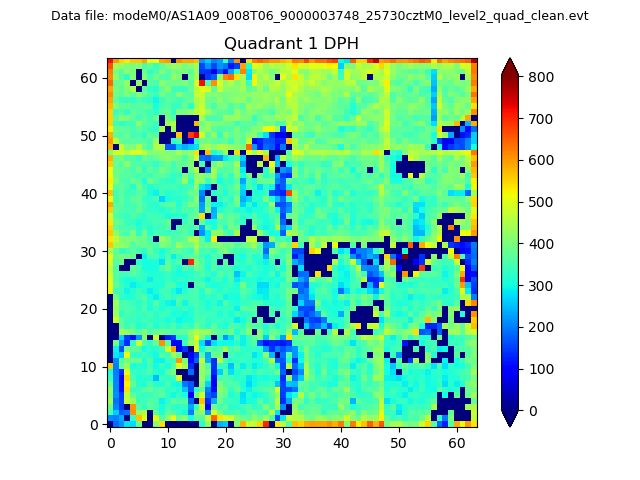 |
Quadrant B |
|---|---|---|---|
| Quadrant D |  |
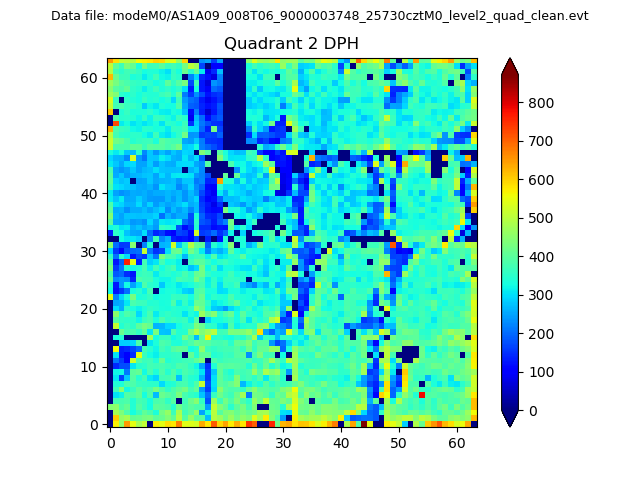 |
Quadrant C |
| Plot type | Count rate plots | Images |
|---|---|---|
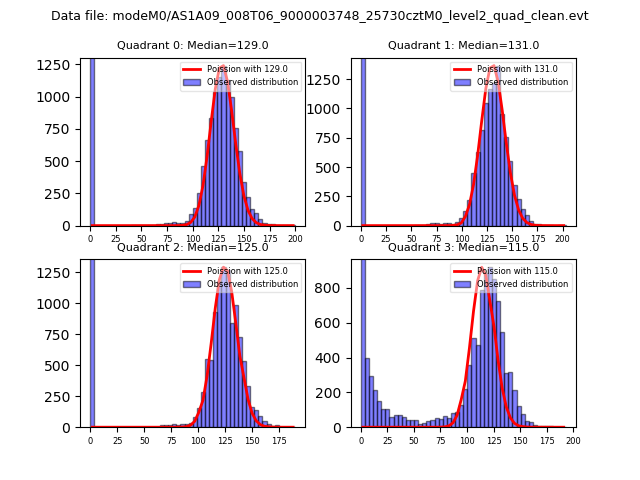
| Comparison with Poisson distribution Blue bars denote a histogram of data divided into 1 sec bins. Red curve is a Poisson curve with rate = median count rate of data. |
 |
 |
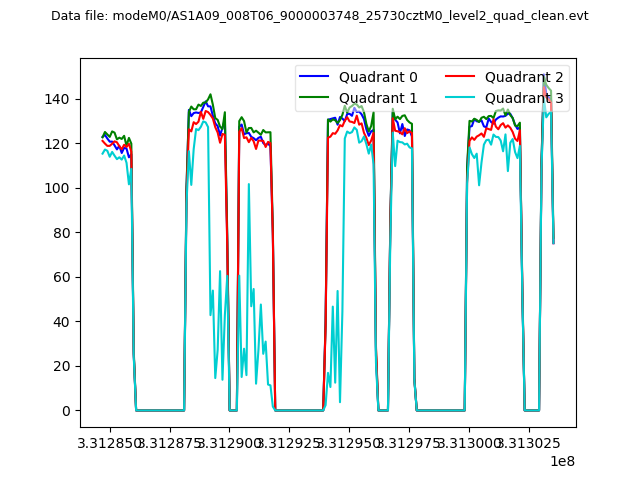
| Quadrant-wise count rates Data is divided into 100 sec bins |
 |
|
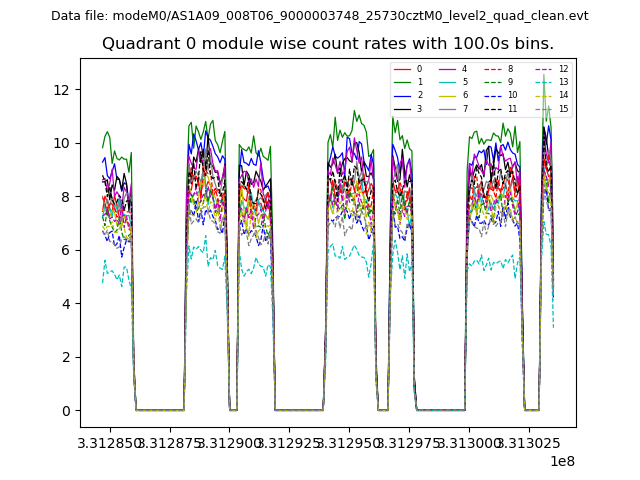
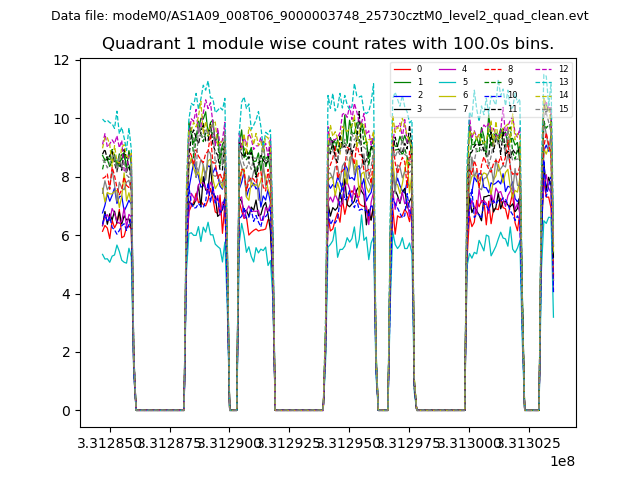
| Module-wise count rates for Quadrant A Data is divided into 100 sec bins |
 |
 |
| Module-wise count rates for Quadrant B Data is divided into 100 sec bins |
 |
 |
| Module-wise count rates for Quadrant C Data is divided into 100 sec bins |
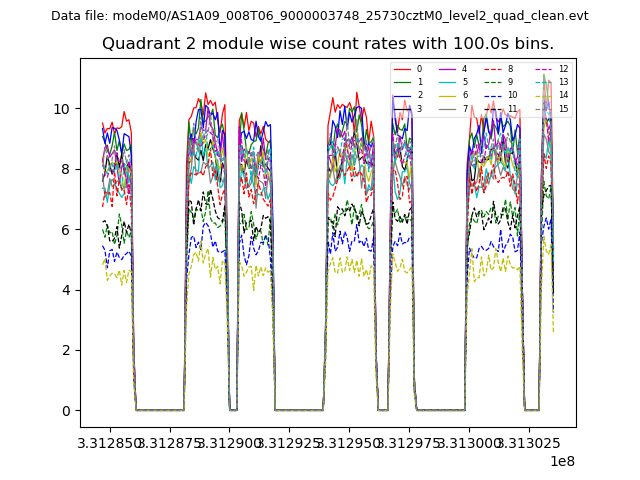 |
 |
| Module-wise count rates for Quadrant D Data is divided into 100 sec bins |
 |
 |
| Parameter | Plot |
|---|---|
| CZT HV Monitor | 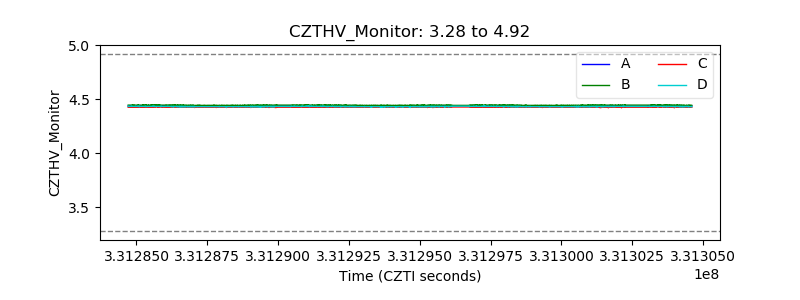 |
| D_VDD | 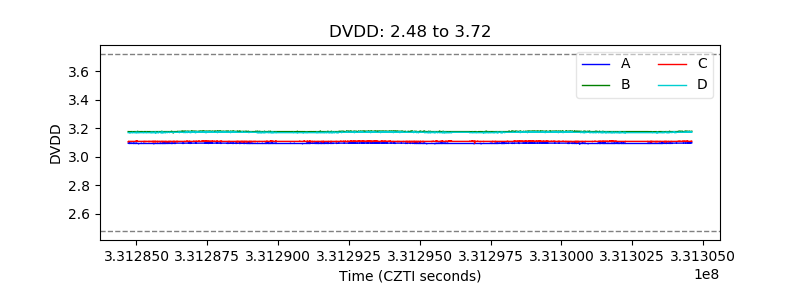 |
| Temperature 1 | 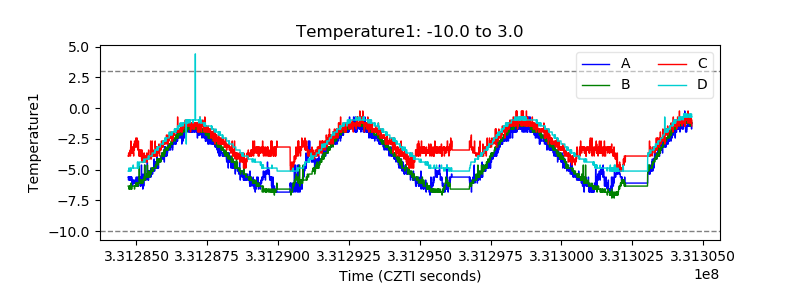 |
| Veto HV Monitor | 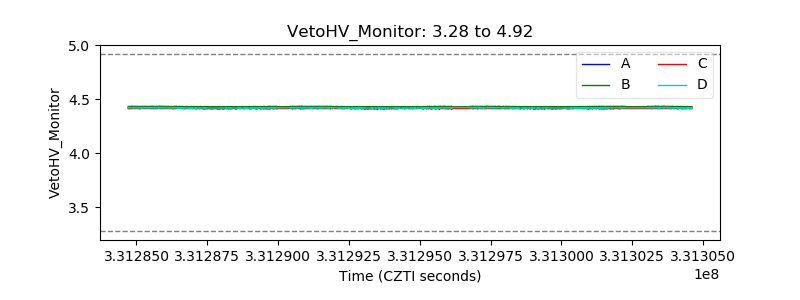 |
| Veto LLD | 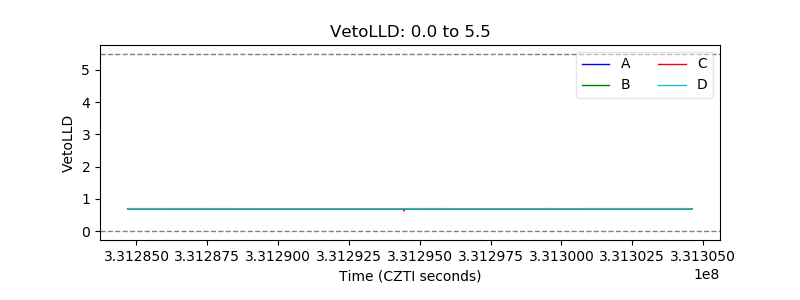 |
| Alpha Counter | 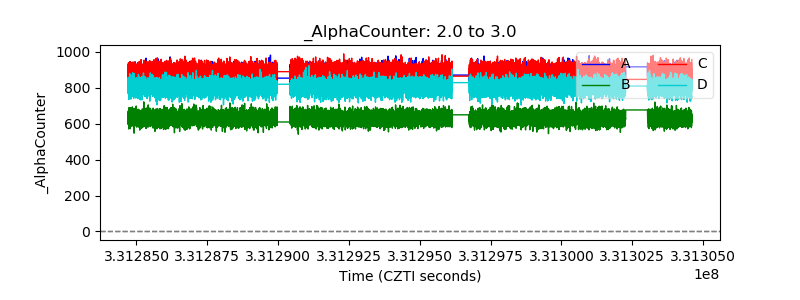 |
| _CPM_Rate | 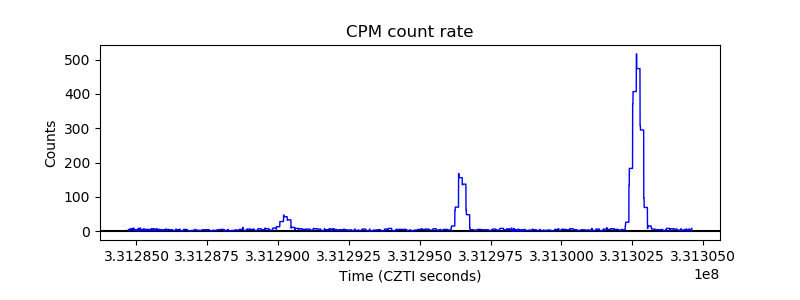 |
| CZT Counter | 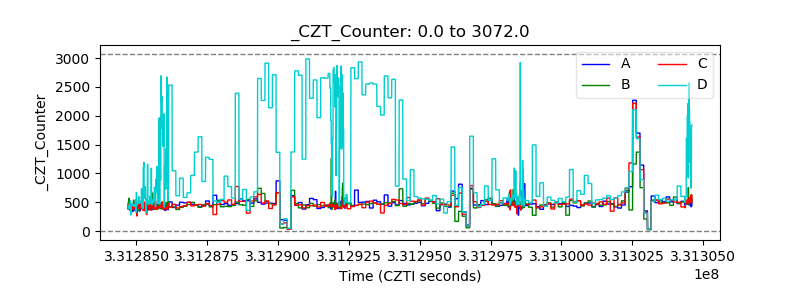 |
| +2.5 Volts monitor |  |
| +5 Volts monitor | 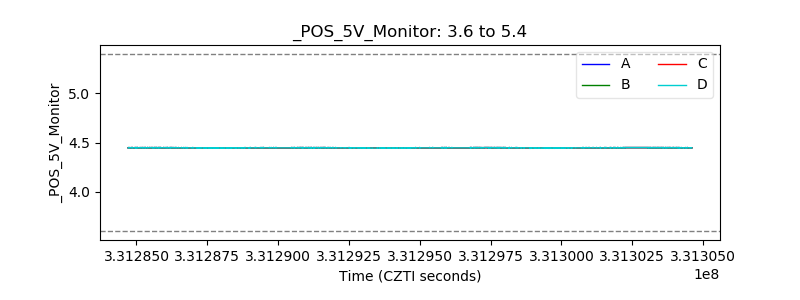 |
| _ROLL_ROT | 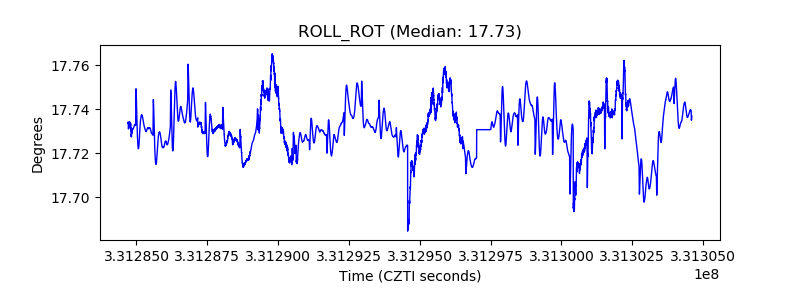 |
| _Roll_DEC | 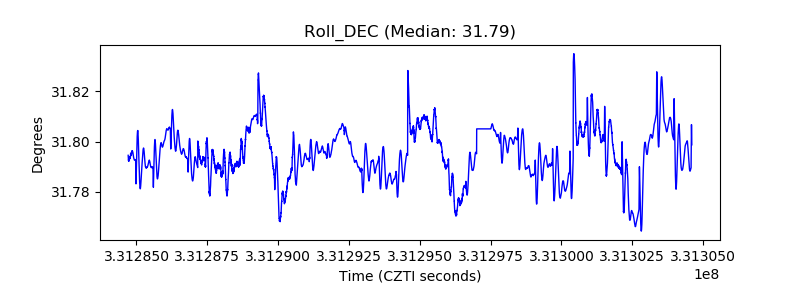 |
| _Roll_RA | 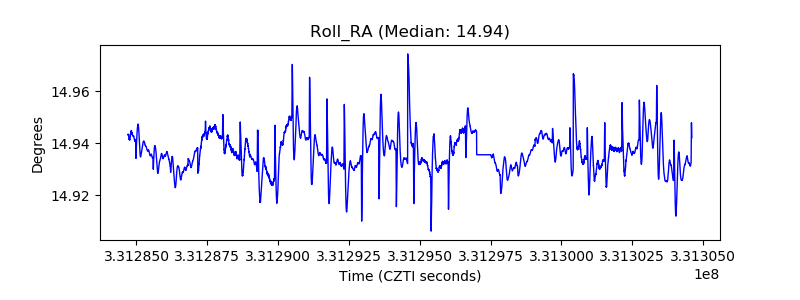 |
| Veto Counter | 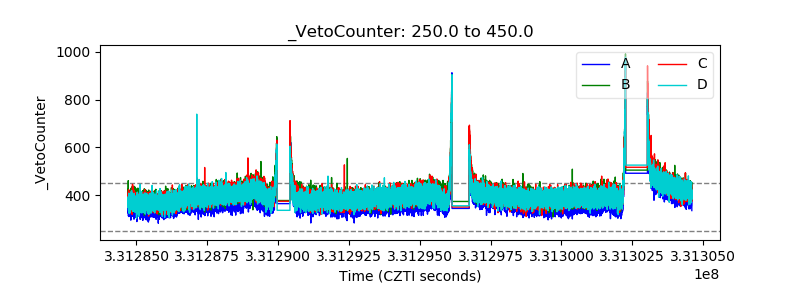 |