| Param | Original file | Final file |
|---|---|---|
| Filename | modeM0/AS1A09_008T06_9000003748_25731cztM0_level2.evt | modeM0/AS1A09_008T06_9000003748_25731cztM0_level2_quad_clean.evt |
| Size (bytes) | 566,835,840 | 65,715,840 |
| Size | 540.6 MB | 62.7 MB |
| Events in quadrant A | 3,251,835 | 395,589 |
| Events in quadrant B | 3,457,100 | 398,957 |
| Events in quadrant C | 4,569,620 | 366,924 |
| Events in quadrant D | 5,442,328 | 369,474 |
| Mode M0 | |||
|---|---|---|---|
| Quadrant | BADHDUFLAG | Total packets | Discarded packets |
| A | 0 | 13705 | 0 |
| B | 0 | 14240 | 0 |
| C | 0 | 17588 | 0 |
| D | 0 | 20679 | 0 |
| Mode M9 | |||
|---|---|---|---|
| Quadrant | BADHDUFLAG | Total packets | Discarded packets |
| A | 0 | 10 | 0 |
| B | 0 | 10 | 0 |
| C | 0 | 10 | 0 |
| D | 0 | 10 | 0 |
| Quadrant | Total seconds | Saturated seconds | Saturation percentage |
|---|---|---|---|
| A | 6575 | 49 | 0.745247% |
| B | 6575 | 75 | 1.140684% |
| C | 6575 | 599 | 9.110266% |
| D | 6576 | 449 | 6.827859% |
Noise dominated data is calculated using 1-second bins in cleaned event files. If a bin has >2000 counts, and if more than 50% of those come from <1% of pixels, then it is considered to be noise-dominated and hence unusable.
| Quadrant | # 1 sec bins | Bins with >0 counts | Bins with >2000 counts | High rate bins dominated by noise | Noise dominated (total time) | Noise dominated (detector-on time) | Marked lightcurve |
|---|---|---|---|---|---|---|---|
| A | 7555 | 6575 | 0 | 0 | 0.00% | 0.00% | 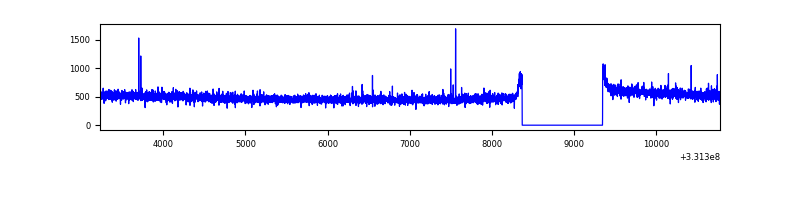 |
| B | 7555 | 6575 | 7 | 7 | 0.09% | 0.11% | 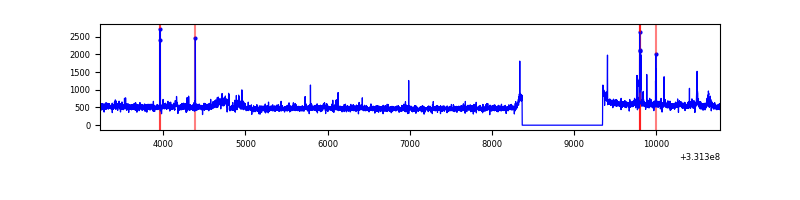 |
| C | 7555 | 6575 | 439 | 439 | 5.81% | 6.68% | 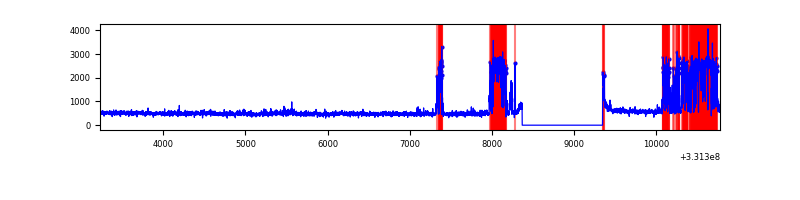 |
| D | 7556 | 6576 | 358 | 358 | 4.74% | 5.44% | 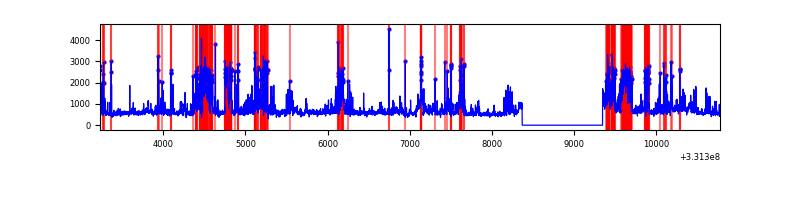 |
Top three noisy pixels from each quadrant. If the there are fewer than three noisy pixels in the level2.evt file, extra rows are filled as -1
| Pixel properties | Quadrant properties | ||||||
|---|---|---|---|---|---|---|---|
| Quadrant | DetID | PixID | Counts | Sigma | Mean | Median | Sigma |
| A | 13 | 254 | 9930 | 53.99 | 839 | 821 | 168.7 |
| A | 6 | 16 | 9457 | 51.18 | 839 | 821 | 168.7 |
| A | 3 | 137 | 7622 | 40.31 | 839 | 821 | 168.7 |
| B | 15 | 33 | 41763 | 257.89 | 830 | 811 | 158.8 |
| B | 4 | 171 | 36720 | 226.13 | 830 | 811 | 158.8 |
| B | 0 | 190 | 28088 | 171.77 | 830 | 811 | 158.8 |
| C | 3 | 233 | 1462722 | 8150.77 | 765 | 769 | 179.4 |
| C | 14 | 238 | 123240 | 682.81 | 765 | 769 | 179.4 |
| C | 13 | 61 | 5231 | 24.88 | 765 | 769 | 179.4 |
| D | 7 | 80 | 1054046 | 5400.55 | 797 | 774 | 195.0 |
| D | 1 | 52 | 728929 | 3733.54 | 797 | 774 | 195.0 |
| D | 8 | 195 | 440779 | 2256.08 | 797 | 774 | 195.0 |
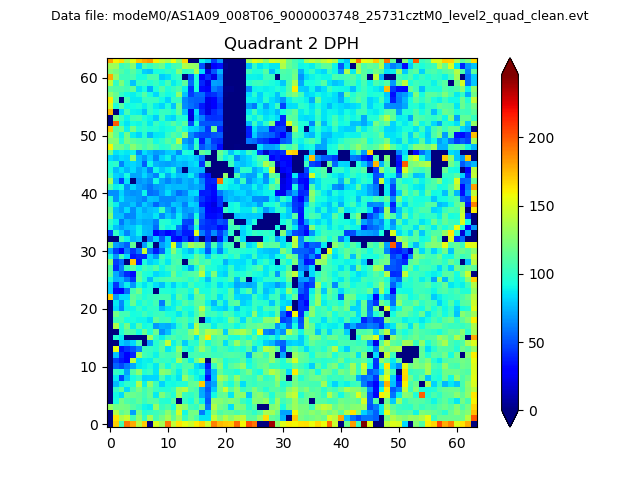
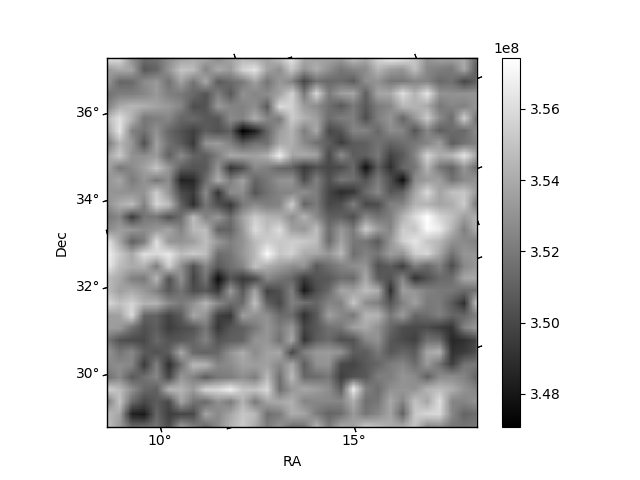
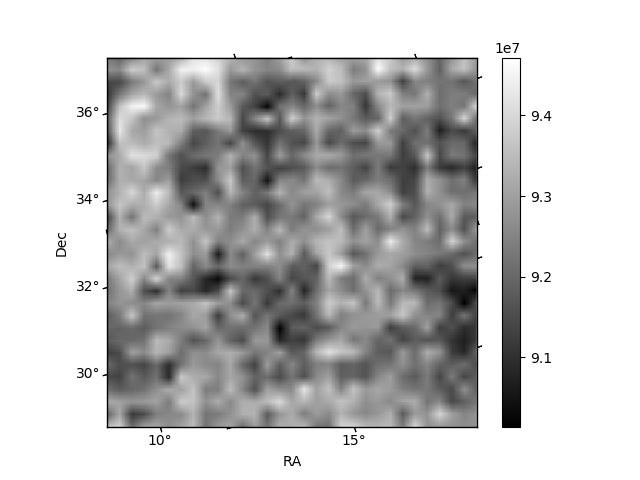
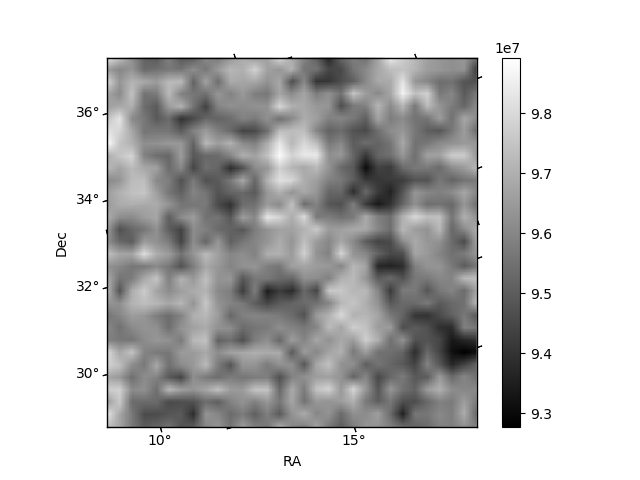
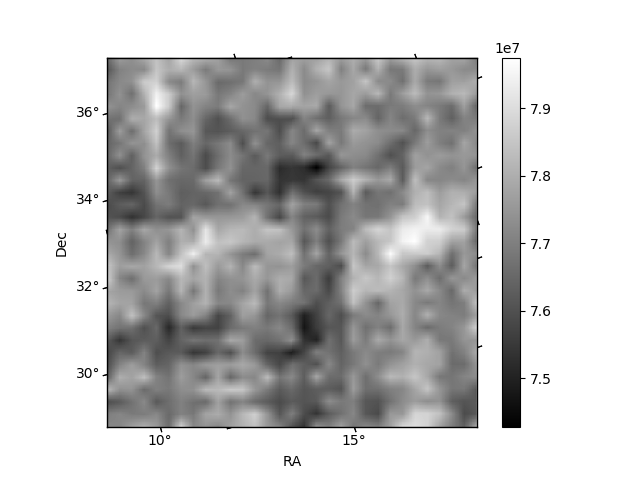
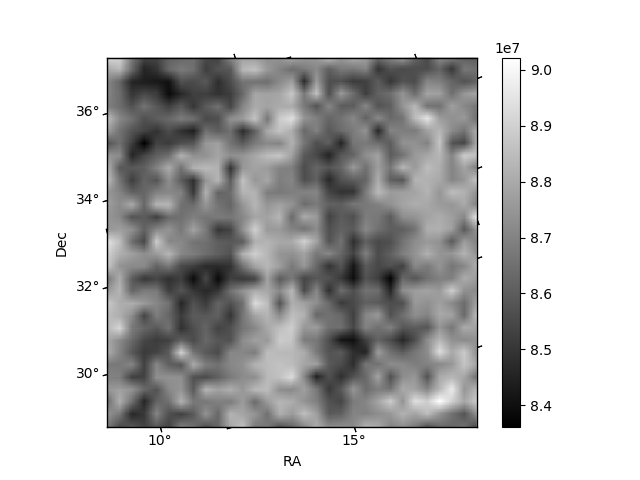
Histogram calculated using DETX and DETY for each event in the final _common_clean file
| Quadrant A | 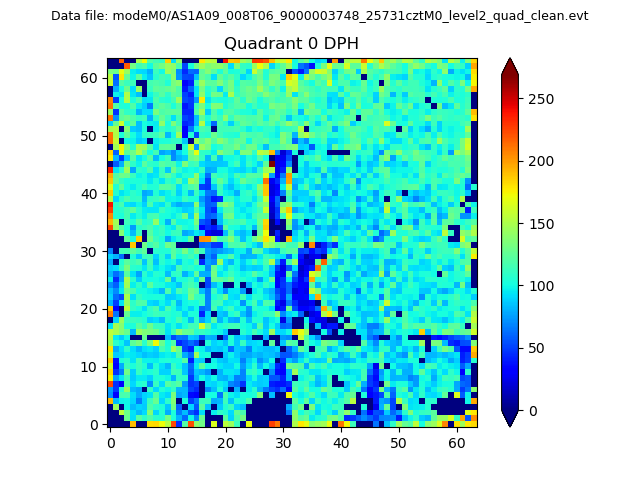 |
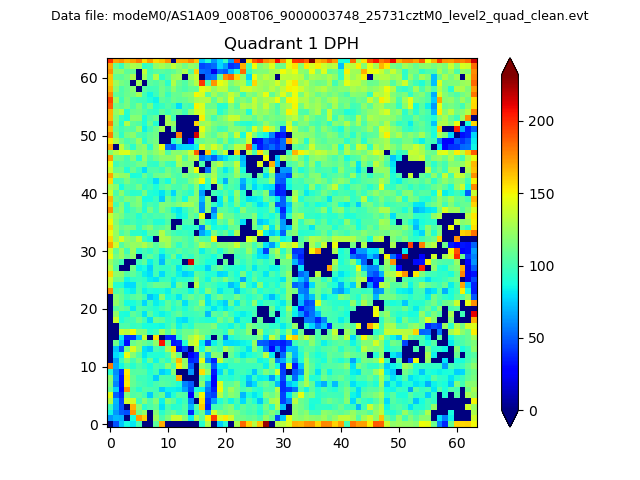 |
Quadrant B |
|---|---|---|---|
| Quadrant D | 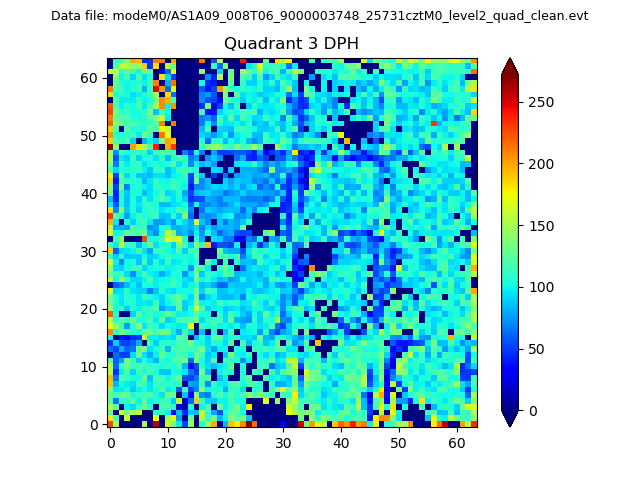 |
 |
Quadrant C |
| Plot type | Count rate plots | Images |
|---|---|---|
| Comparison with Poisson distribution Blue bars denote a histogram of data divided into 1 sec bins. Red curve is a Poisson curve with rate = median count rate of data. |
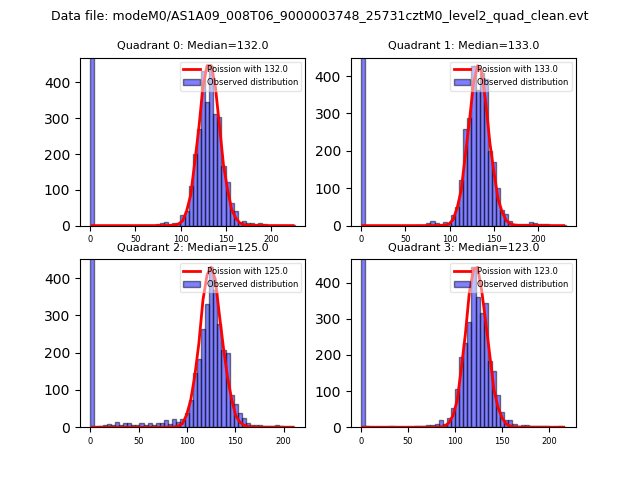 |
 |
| Quadrant-wise count rates Data is divided into 100 sec bins |
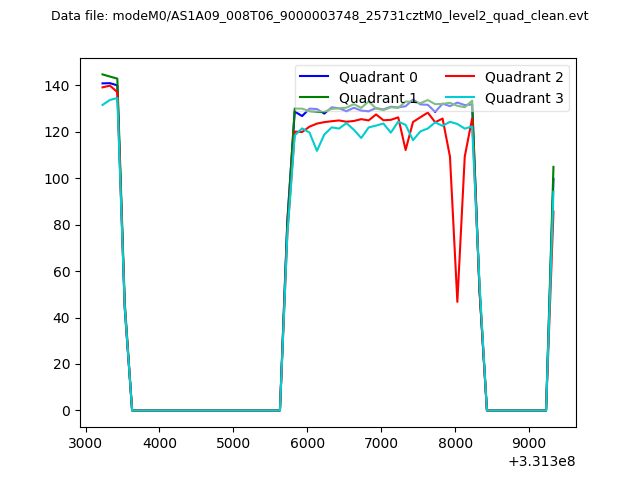 |
|
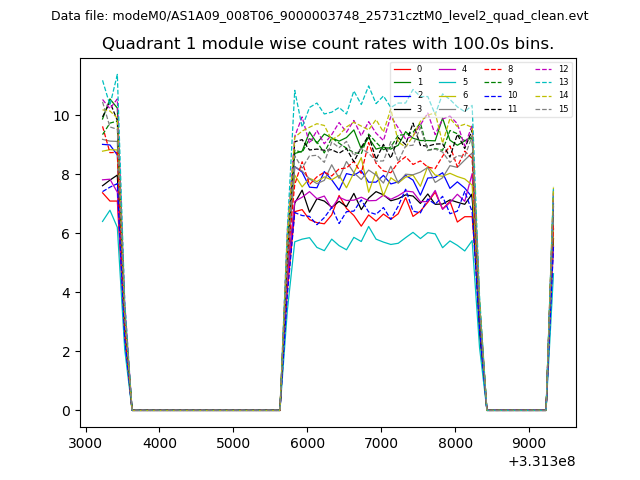
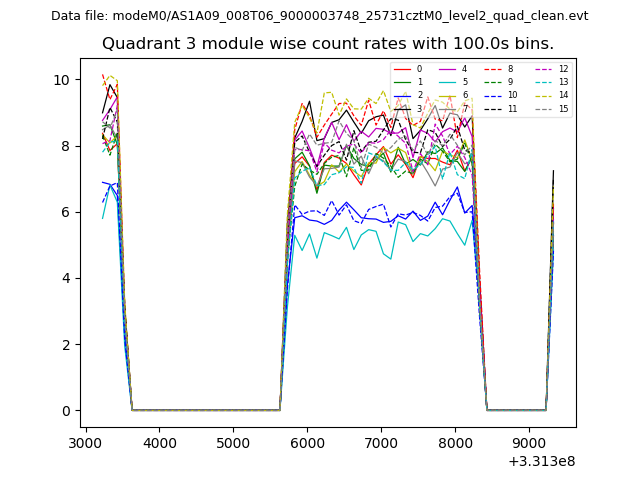
| Module-wise count rates for Quadrant A Data is divided into 100 sec bins |
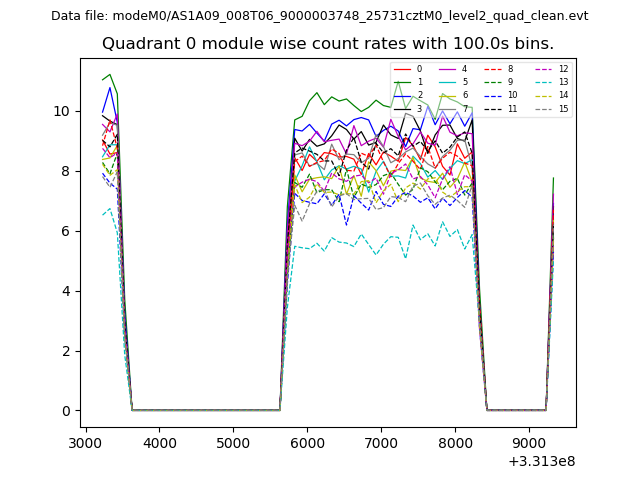 |
 |
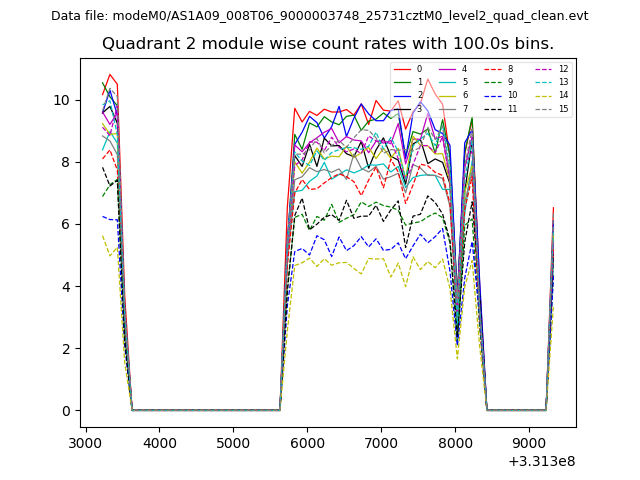
| Module-wise count rates for Quadrant B Data is divided into 100 sec bins |
 |
 |
| Module-wise count rates for Quadrant C Data is divided into 100 sec bins |
 |
 |
| Module-wise count rates for Quadrant D Data is divided into 100 sec bins |
 |
 |
| Parameter | Plot |
|---|---|
| CZT HV Monitor | 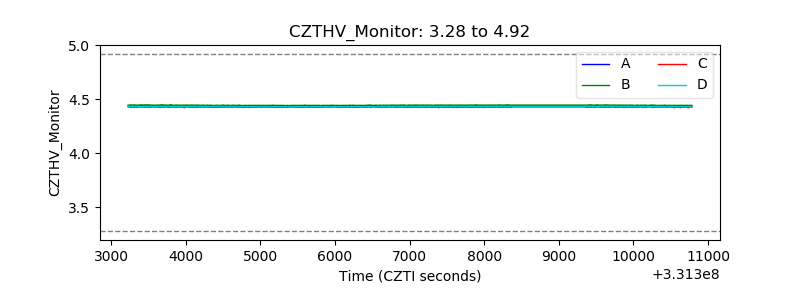 |
| D_VDD | 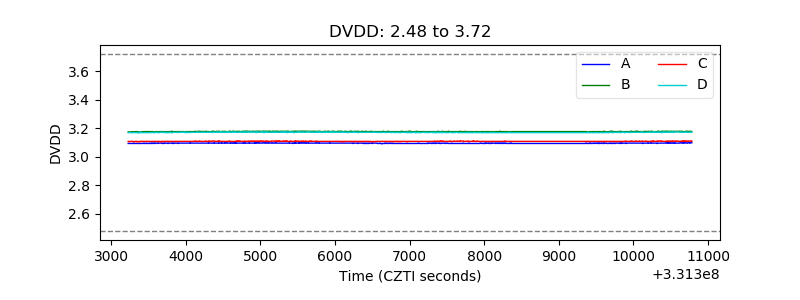 |
| Temperature 1 | 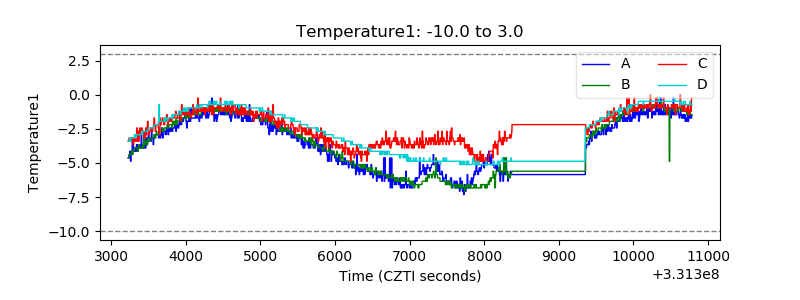 |
| Veto HV Monitor | 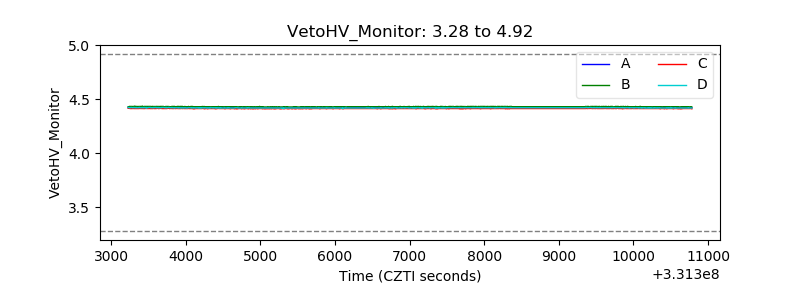 |
| Veto LLD | 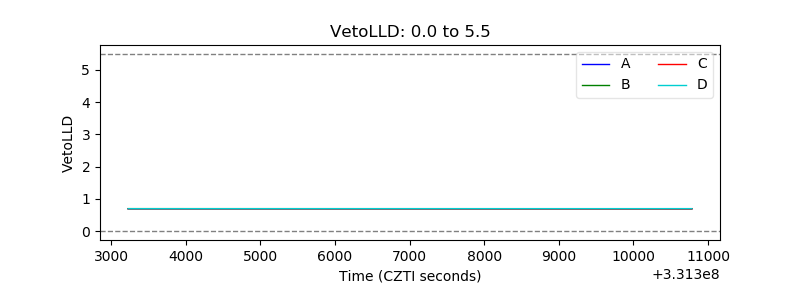 |
| Alpha Counter | 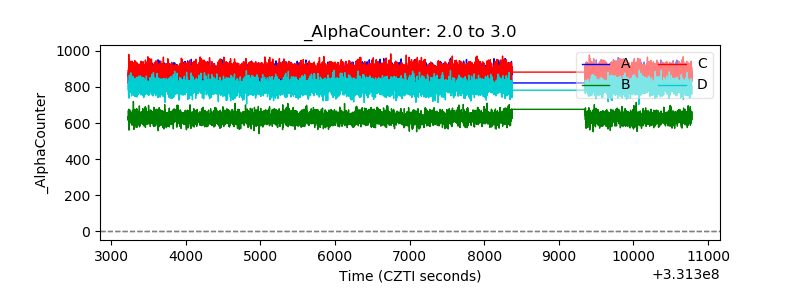 |
| _CPM_Rate | 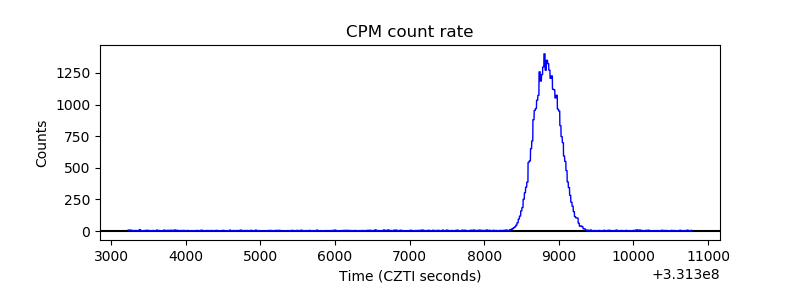 |
| CZT Counter | 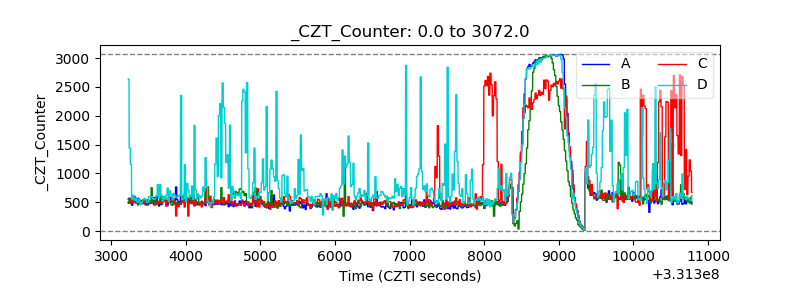 |
| +2.5 Volts monitor |  |
| +5 Volts monitor | 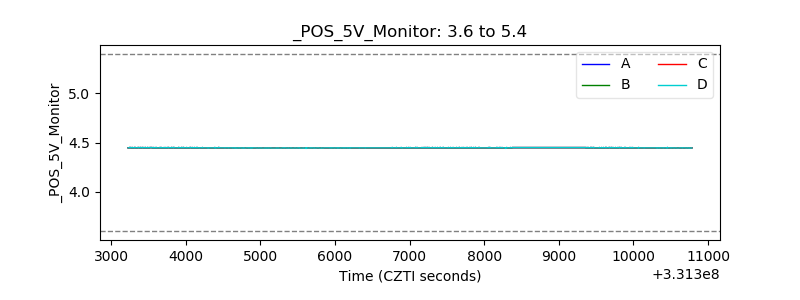 |
| _ROLL_ROT | 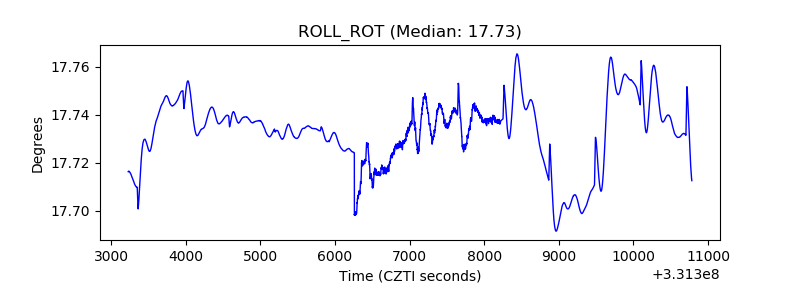 |
| _Roll_DEC | 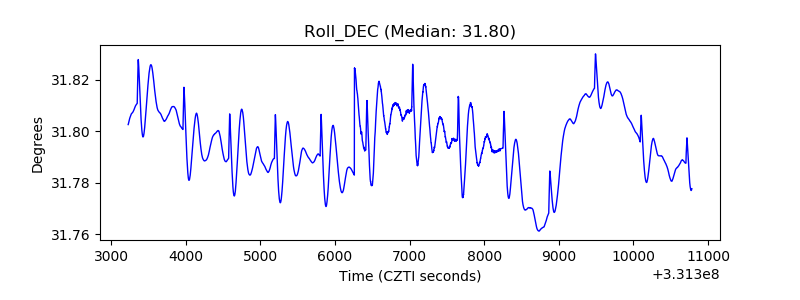 |
| _Roll_RA | 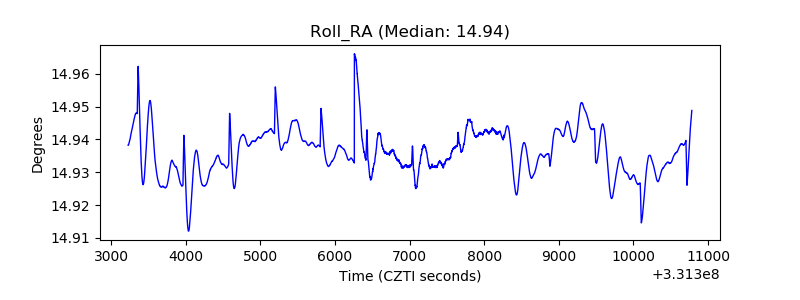 |
| Veto Counter | 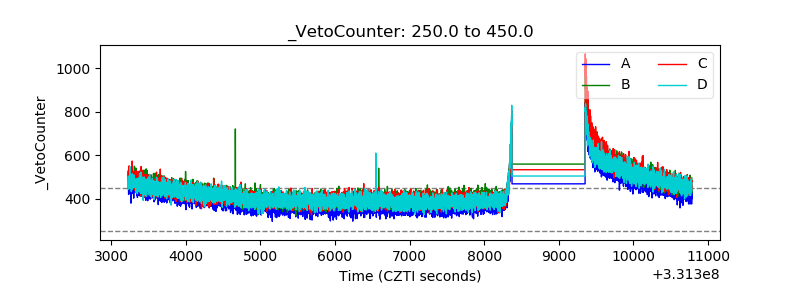 |