| Param | Original file | Final file |
|---|---|---|
| Filename | modeM0/AS1A09_008T06_9000003748_25733cztM0_level2.evt | modeM0/AS1A09_008T06_9000003748_25733cztM0_level2_quad_clean.evt |
| Size (bytes) | 561,648,960 | 64,820,160 |
| Size | 535.6 MB | 61.8 MB |
| Events in quadrant A | 3,386,566 | 386,605 |
| Events in quadrant B | 3,513,469 | 391,251 |
| Events in quadrant C | 4,371,655 | 372,523 |
| Events in quadrant D | 5,301,496 | 362,658 |
| Mode M0 | |||
|---|---|---|---|
| Quadrant | BADHDUFLAG | Total packets | Discarded packets |
| A | 0 | 14340 | 0 |
| B | 0 | 14591 | 0 |
| C | 0 | 17151 | 0 |
| D | 0 | 20328 | 0 |
| Mode M9 | |||
|---|---|---|---|
| Quadrant | BADHDUFLAG | Total packets | Discarded packets |
| A | 0 | 11 | 0 |
| B | 0 | 11 | 0 |
| C | 0 | 11 | 0 |
| D | 0 | 11 | 0 |
| Quadrant | Total seconds | Saturated seconds | Saturation percentage |
|---|---|---|---|
| A | 6438 | 56 | 0.869835% |
| B | 6439 | 62 | 0.962882% |
| C | 6439 | 444 | 6.895481% |
| D | 6439 | 386 | 5.994720% |
Noise dominated data is calculated using 1-second bins in cleaned event files. If a bin has >2000 counts, and if more than 50% of those come from <1% of pixels, then it is considered to be noise-dominated and hence unusable.
| Quadrant | # 1 sec bins | Bins with >0 counts | Bins with >2000 counts | High rate bins dominated by noise | Noise dominated (total time) | Noise dominated (detector-on time) | Marked lightcurve |
|---|---|---|---|---|---|---|---|
| A | 7573 | 6438 | 0 | 0 | 0.00% | 0.00% | 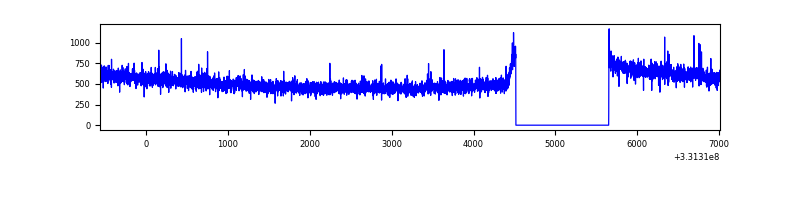 |
| B | 7574 | 6439 | 5 | 5 | 0.07% | 0.08% | 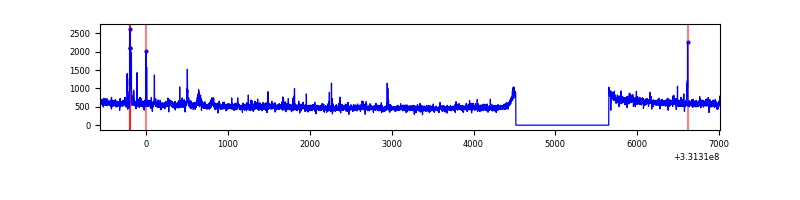 |
| C | 7574 | 6439 | 275 | 275 | 3.63% | 4.27% | 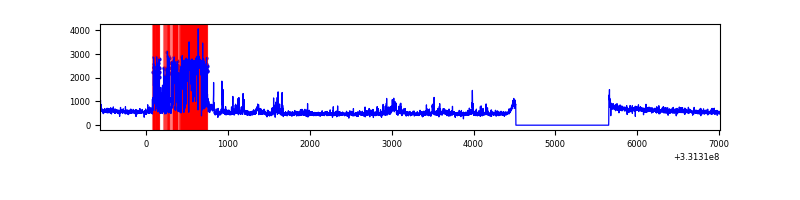 |
| D | 7574 | 6439 | 302 | 302 | 3.99% | 4.69% | 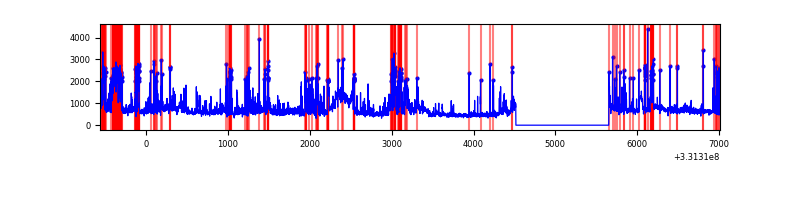 |
Top three noisy pixels from each quadrant. If the there are fewer than three noisy pixels in the level2.evt file, extra rows are filled as -1
| Pixel properties | Quadrant properties | ||||||
|---|---|---|---|---|---|---|---|
| Quadrant | DetID | PixID | Counts | Sigma | Mean | Median | Sigma |
| A | 6 | 16 | 57030 | 327.02 | 859 | 842 | 171.8 |
| A | 2 | 79 | 13893 | 75.96 | 859 | 842 | 171.8 |
| A | 13 | 254 | 9825 | 52.28 | 859 | 842 | 171.8 |
| B | 0 | 190 | 42764 | 261.0 | 852 | 830 | 160.7 |
| B | 0 | 219 | 38107 | 232.01 | 852 | 830 | 160.7 |
| B | 4 | 171 | 31416 | 190.37 | 852 | 830 | 160.7 |
| C | 3 | 233 | 1113428 | 5977.96 | 800 | 807 | 186.1 |
| C | 14 | 238 | 128528 | 686.23 | 800 | 807 | 186.1 |
| C | 1 | 16 | 12225 | 61.35 | 800 | 807 | 186.1 |
| D | 1 | 52 | 1027388 | 5108.17 | 825 | 802 | 201.0 |
| D | 7 | 80 | 613284 | 3047.64 | 825 | 802 | 201.0 |
| D | 8 | 195 | 245758 | 1218.87 | 825 | 802 | 201.0 |
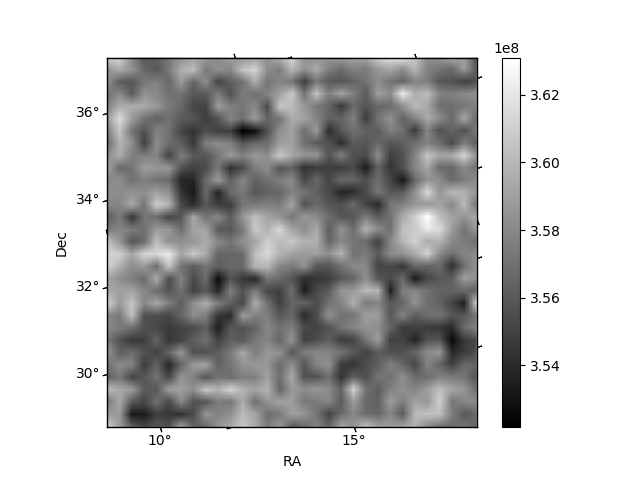
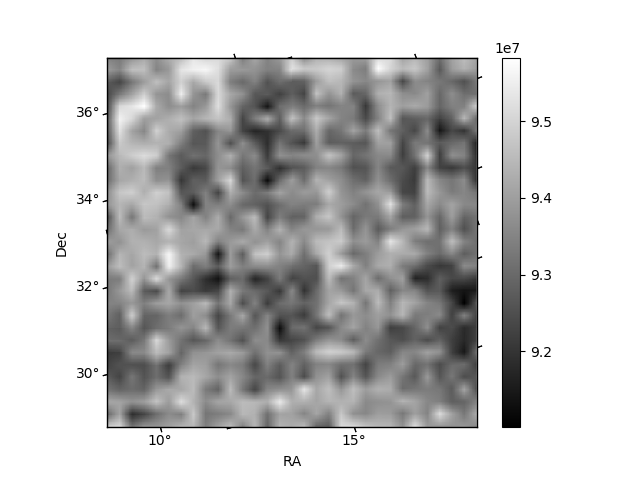
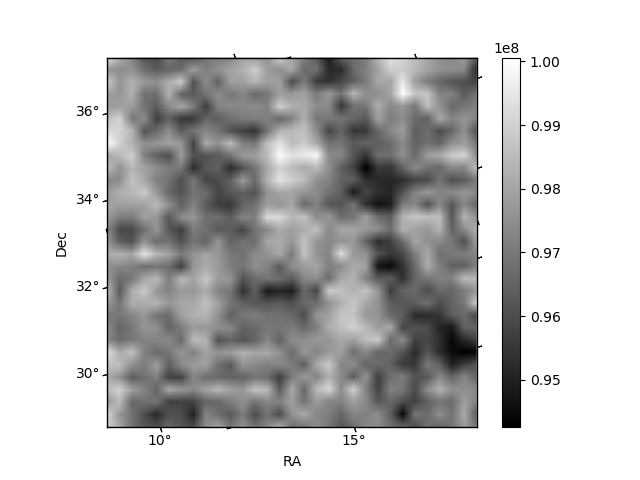
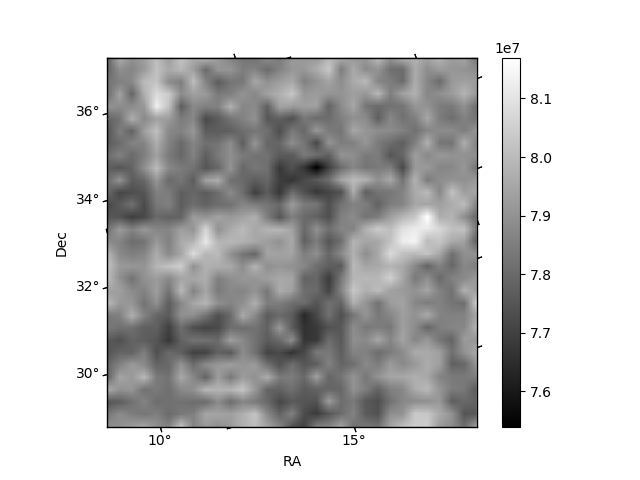
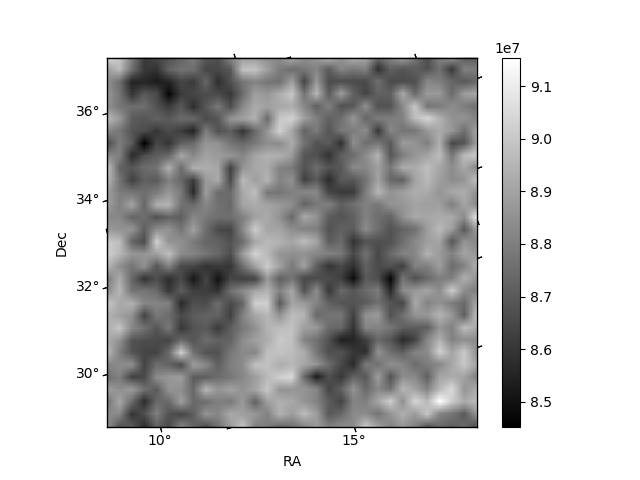
Histogram calculated using DETX and DETY for each event in the final _common_clean file
| Quadrant A | 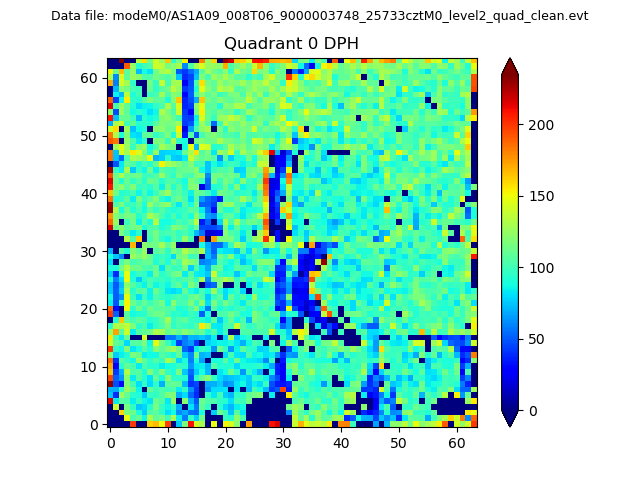 |
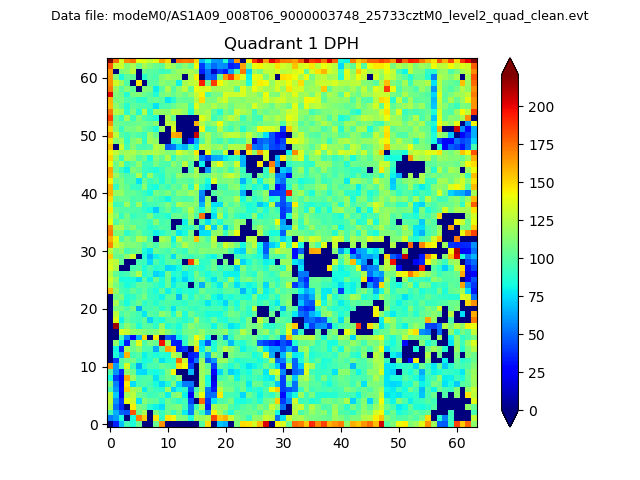 |
Quadrant B |
|---|---|---|---|
| Quadrant D | 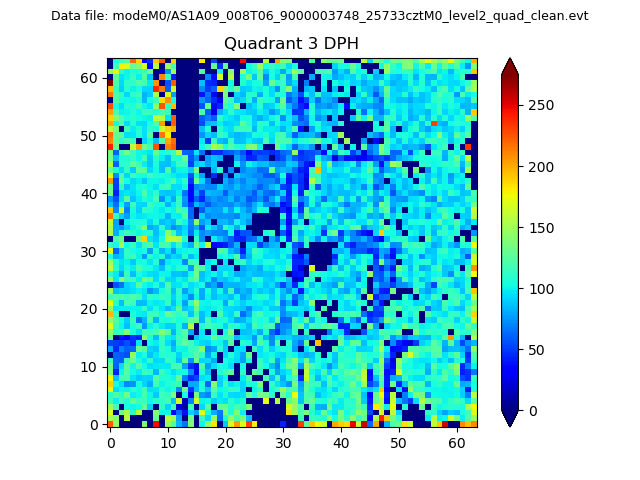 |
 |
Quadrant C |
| Plot type | Count rate plots | Images |
|---|---|---|
| Comparison with Poisson distribution Blue bars denote a histogram of data divided into 1 sec bins. Red curve is a Poisson curve with rate = median count rate of data. |
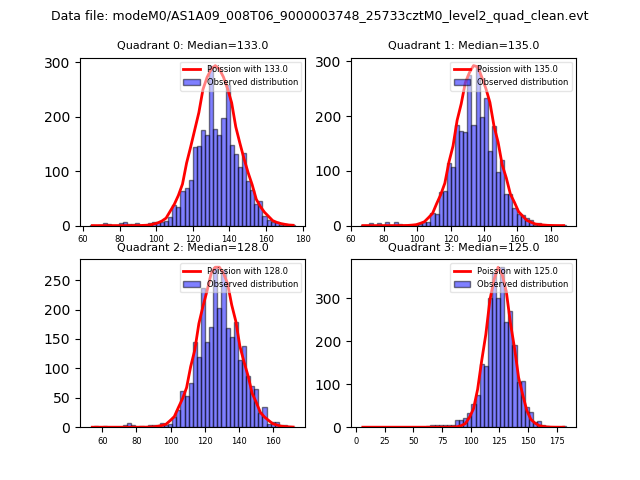 |
 |
| Quadrant-wise count rates Data is divided into 100 sec bins |
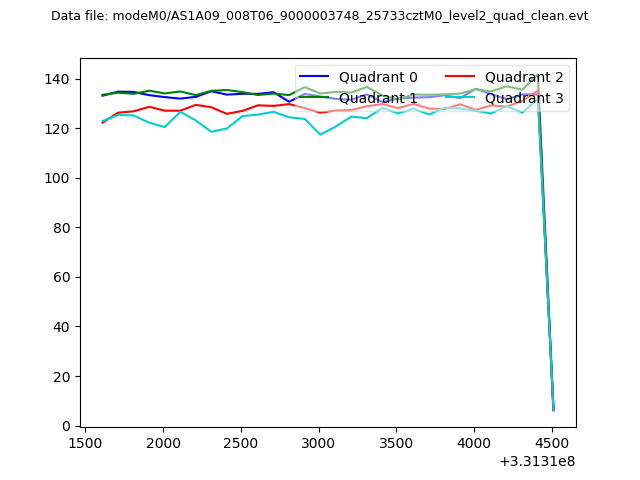 |
|
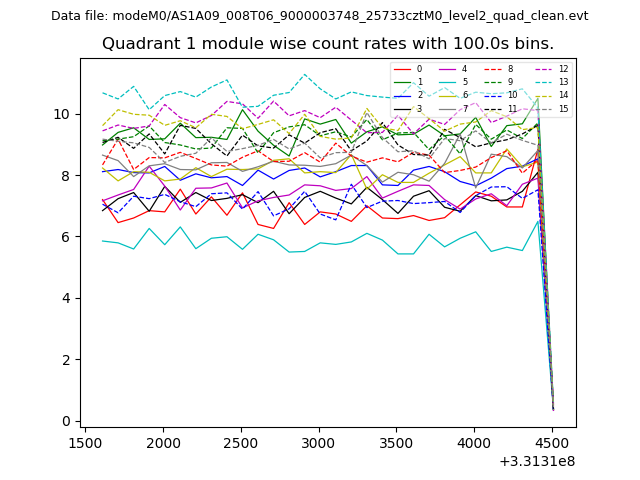
| Module-wise count rates for Quadrant A Data is divided into 100 sec bins |
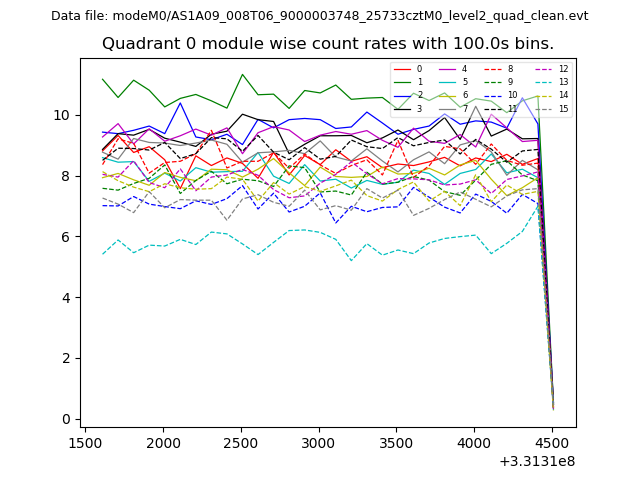 |
 |
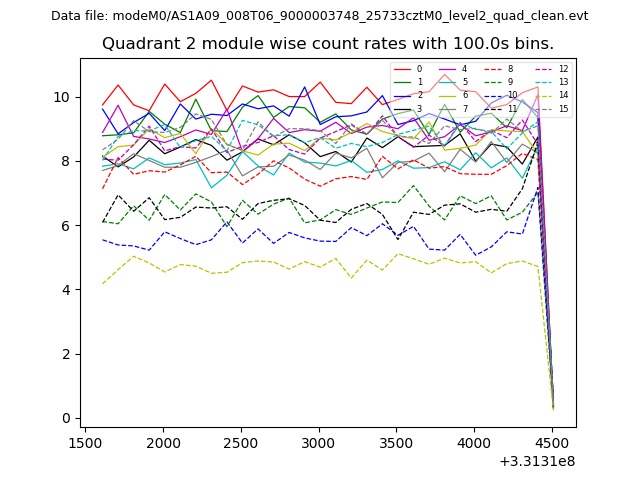
| Module-wise count rates for Quadrant B Data is divided into 100 sec bins |
 |
 |
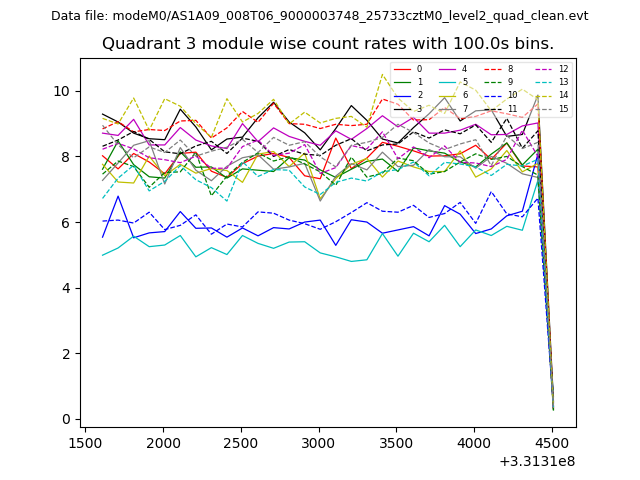
| Module-wise count rates for Quadrant C Data is divided into 100 sec bins |
 |
 |
| Module-wise count rates for Quadrant D Data is divided into 100 sec bins |
 |
 |
| Parameter | Plot |
|---|---|
| CZT HV Monitor | 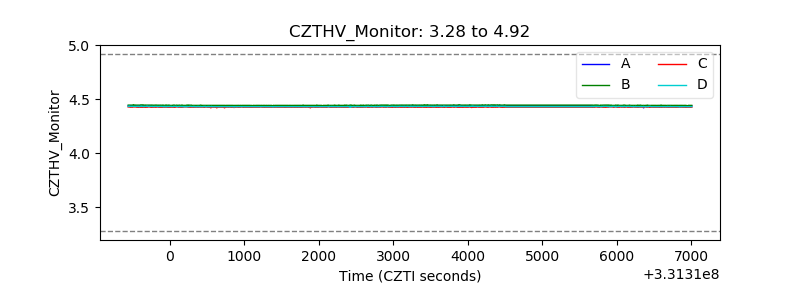 |
| D_VDD | 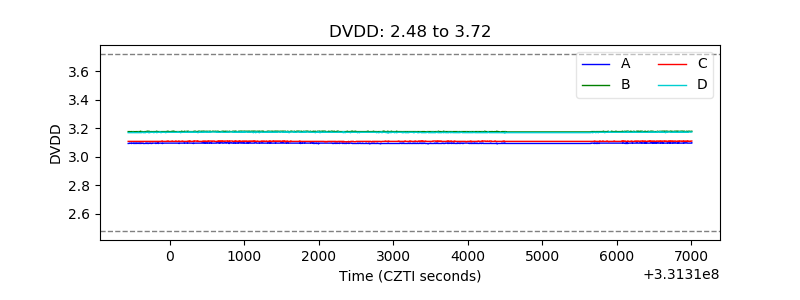 |
| Temperature 1 | 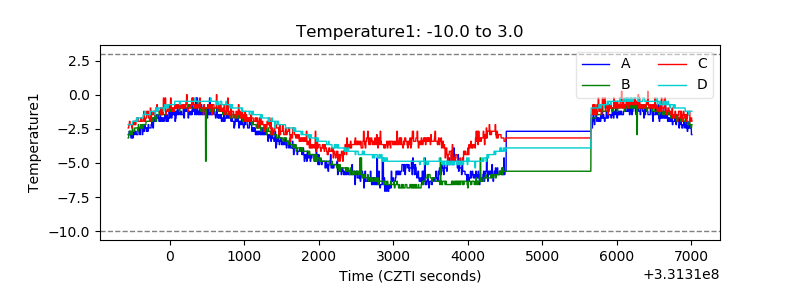 |
| Veto HV Monitor | 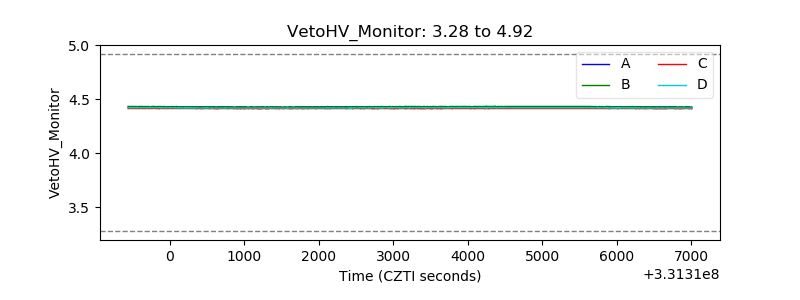 |
| Veto LLD | 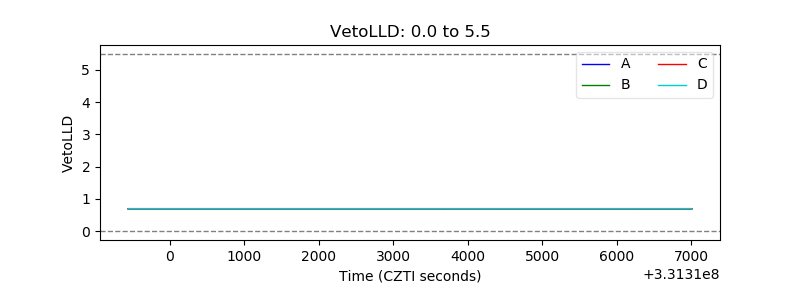 |
| Alpha Counter | 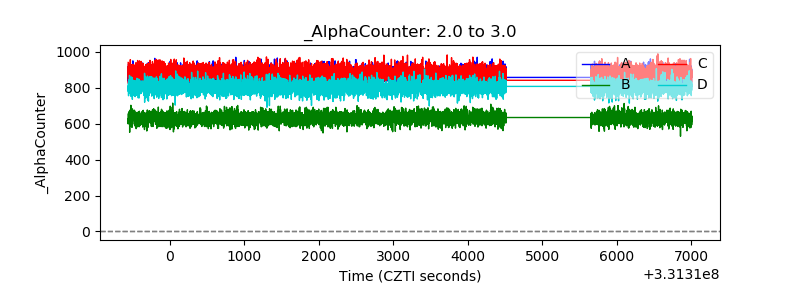 |
| _CPM_Rate | 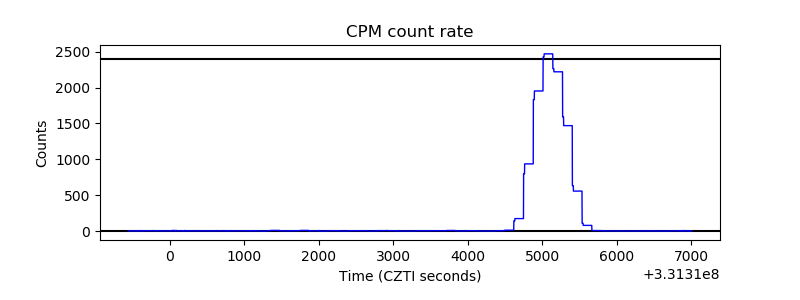 |
| CZT Counter | 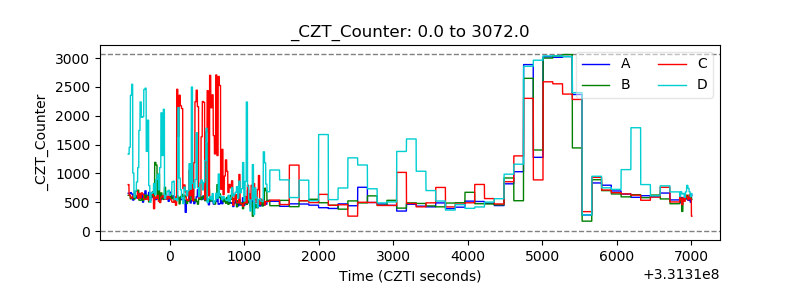 |
| +2.5 Volts monitor |  |
| +5 Volts monitor | 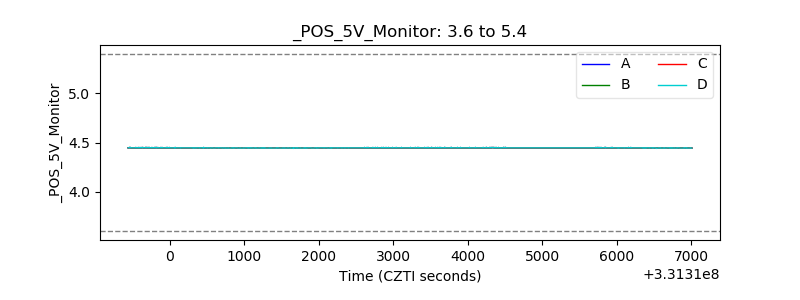 |
| _ROLL_ROT | 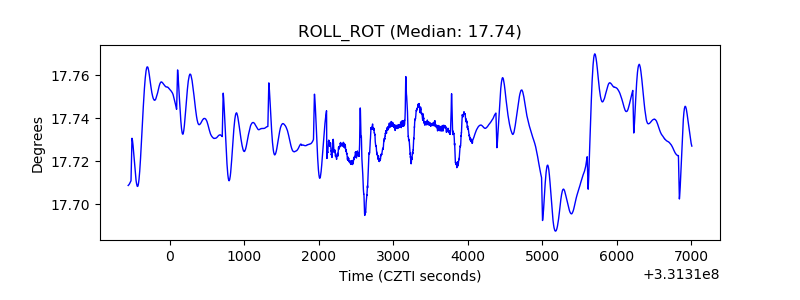 |
| _Roll_DEC | 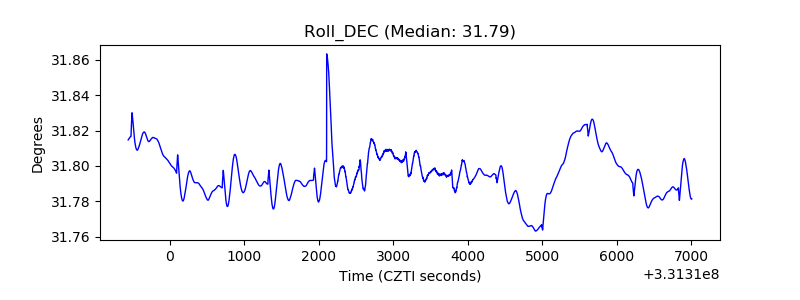 |
| _Roll_RA | 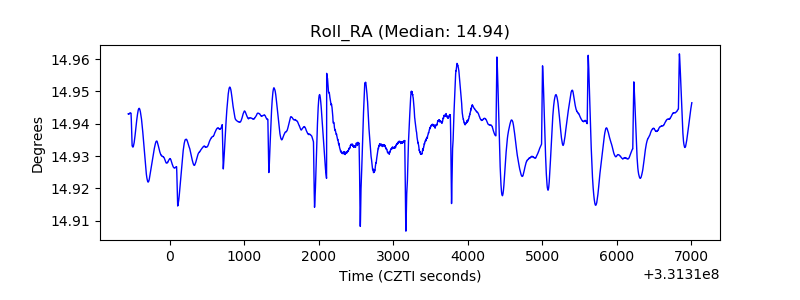 |
| Veto Counter | 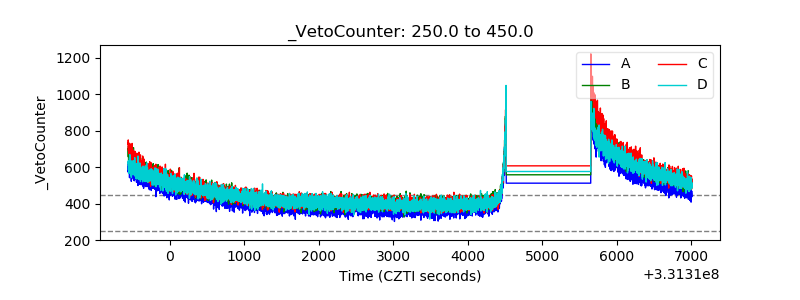 |