| Param | Original file | Final file |
|---|---|---|
| Filename | modeM0/AS1A09_008T06_9000003748_25734cztM0_level2.evt | modeM0/AS1A09_008T06_9000003748_25734cztM0_level2_quad_clean.evt |
| Size (bytes) | 500,552,640 | 72,126,720 |
| Size | 477.4 MB | 68.8 MB |
| Events in quadrant A | 3,177,043 | 451,188 |
| Events in quadrant B | 3,292,022 | 457,917 |
| Events in quadrant C | 3,234,987 | 440,427 |
| Events in quadrant D | 5,058,384 | 425,541 |
| Mode M0 | |||
|---|---|---|---|
| Quadrant | BADHDUFLAG | Total packets | Discarded packets |
| A | 0 | 13422 | 0 |
| B | 0 | 13656 | 0 |
| C | 0 | 13396 | 0 |
| D | 0 | 19187 | 0 |
| Mode M9 | |||
|---|---|---|---|
| Quadrant | BADHDUFLAG | Total packets | Discarded packets |
| A | 0 | 13 | 0 |
| B | 0 | 13 | 0 |
| C | 0 | 13 | 0 |
| D | 0 | 13 | 0 |
| Quadrant | Total seconds | Saturated seconds | Saturation percentage |
|---|---|---|---|
| A | 5855 | 86 | 1.468830% |
| B | 5856 | 87 | 1.485656% |
| C | 5856 | 124 | 2.117486% |
| D | 5856 | 409 | 6.984290% |
Noise dominated data is calculated using 1-second bins in cleaned event files. If a bin has >2000 counts, and if more than 50% of those come from <1% of pixels, then it is considered to be noise-dominated and hence unusable.
| Quadrant | # 1 sec bins | Bins with >0 counts | Bins with >2000 counts | High rate bins dominated by noise | Noise dominated (total time) | Noise dominated (detector-on time) | Marked lightcurve |
|---|---|---|---|---|---|---|---|
| A | 7090 | 5855 | 0 | 0 | 0.00% | 0.00% | 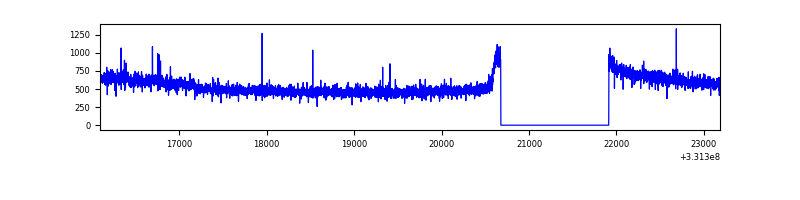 |
| B | 7091 | 5856 | 5 | 5 | 0.07% | 0.09% | 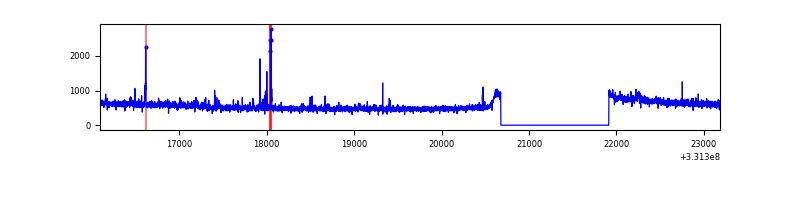 |
| C | 7091 | 5856 | 0 | 0 | 0.00% | 0.00% | 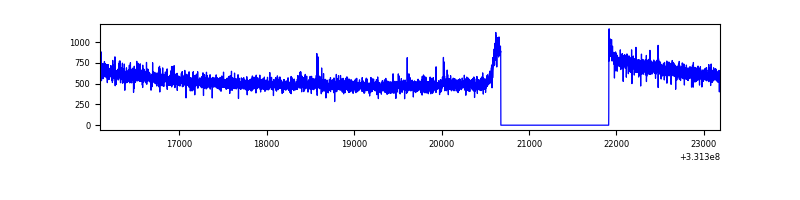 |
| D | 7091 | 5856 | 283 | 283 | 3.99% | 4.83% | 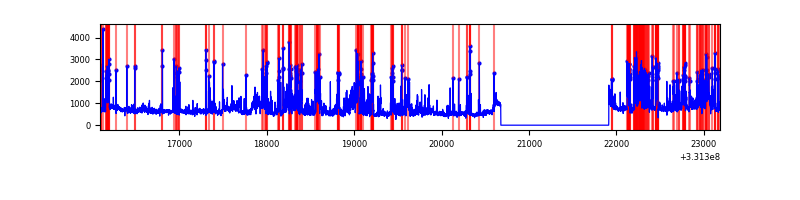 |
Top three noisy pixels from each quadrant. If the there are fewer than three noisy pixels in the level2.evt file, extra rows are filled as -1
| Pixel properties | Quadrant properties | ||||||
|---|---|---|---|---|---|---|---|
| Quadrant | DetID | PixID | Counts | Sigma | Mean | Median | Sigma |
| A | 6 | 16 | 45493 | 278.31 | 811 | 797 | 160.6 |
| A | 13 | 254 | 9110 | 51.76 | 811 | 797 | 160.6 |
| A | 0 | 226 | 6875 | 37.84 | 811 | 797 | 160.6 |
| B | 0 | 190 | 32055 | 209.15 | 810 | 792 | 149.5 |
| B | 0 | 219 | 24630 | 159.48 | 810 | 792 | 149.5 |
| B | 15 | 222 | 22228 | 143.41 | 810 | 792 | 149.5 |
| C | 14 | 238 | 127083 | 693.36 | 787 | 795 | 182.1 |
| C | 3 | 233 | 35252 | 189.18 | 787 | 795 | 182.1 |
| C | 1 | 16 | 5606 | 26.41 | 787 | 795 | 182.1 |
| D | 7 | 80 | 917904 | 4793.74 | 782 | 762 | 191.3 |
| D | 1 | 52 | 807005 | 4214.09 | 782 | 762 | 191.3 |
| D | 8 | 195 | 188656 | 982.09 | 782 | 762 | 191.3 |
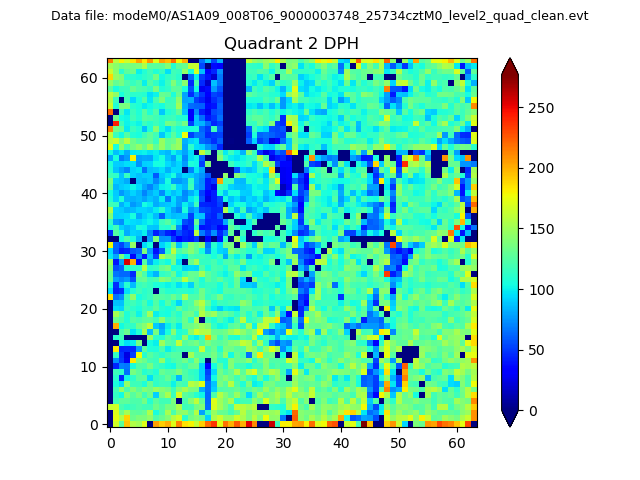
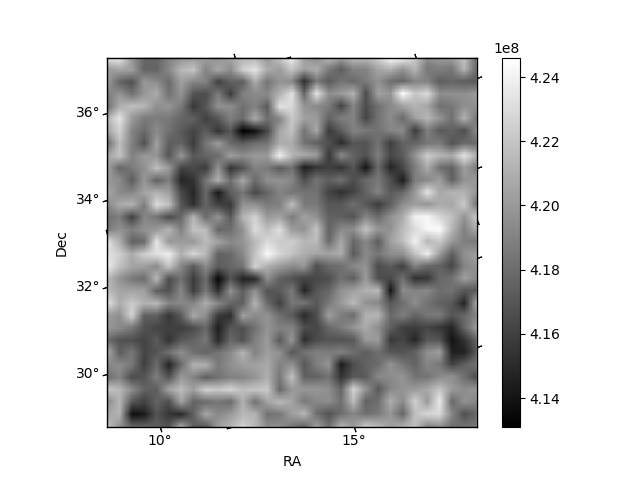
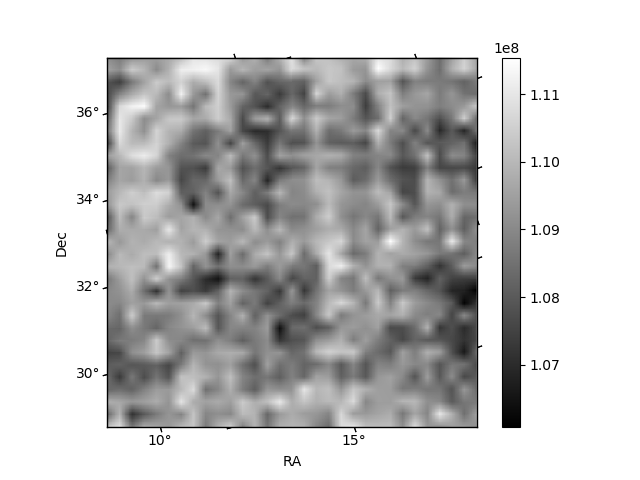
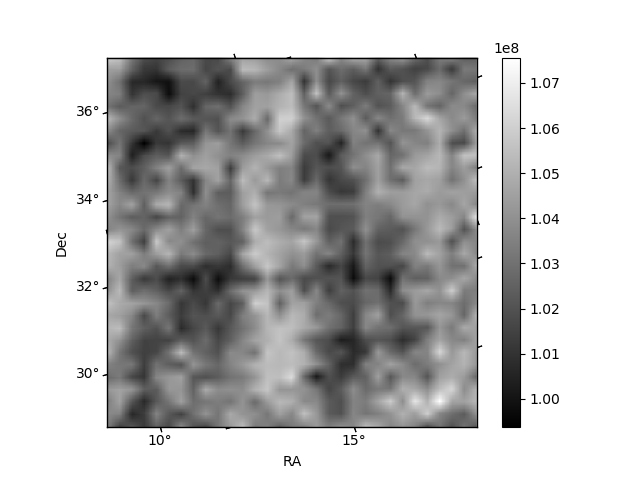
Histogram calculated using DETX and DETY for each event in the final _common_clean file
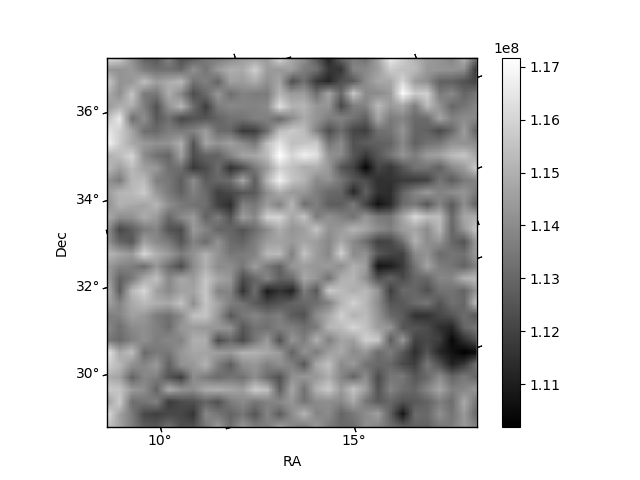
| Quadrant A | 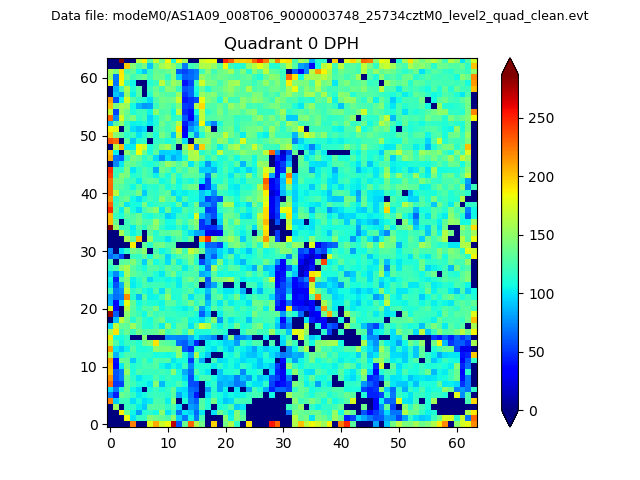 |
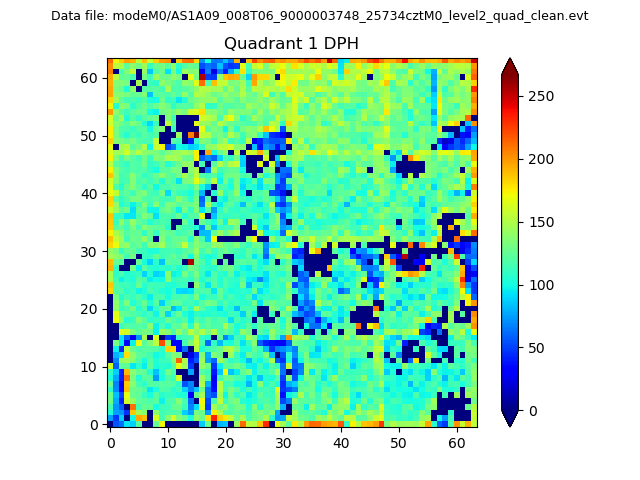 |
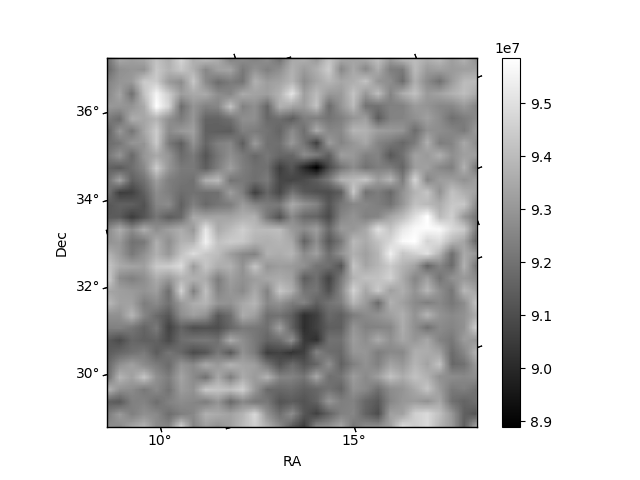
Quadrant B |
|---|---|---|---|
| Quadrant D | 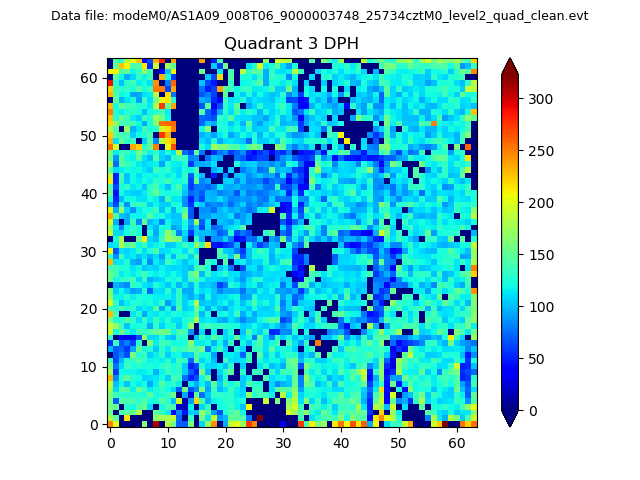 |
 |
Quadrant C |
| Plot type | Count rate plots | Images |
|---|---|---|
| Comparison with Poisson distribution Blue bars denote a histogram of data divided into 1 sec bins. Red curve is a Poisson curve with rate = median count rate of data. |
 |
 |
| Quadrant-wise count rates Data is divided into 100 sec bins |
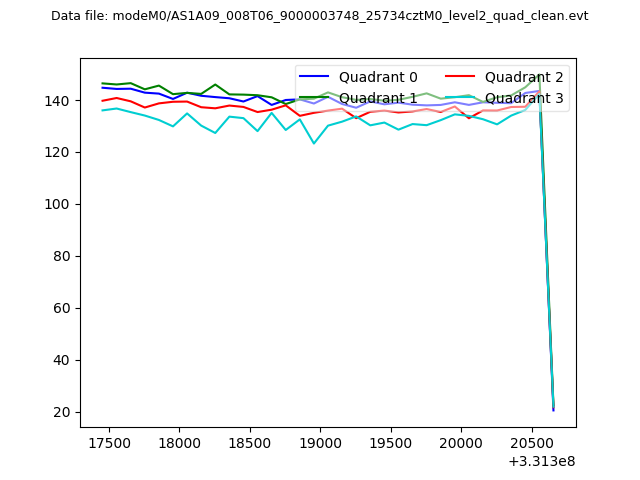 |
|
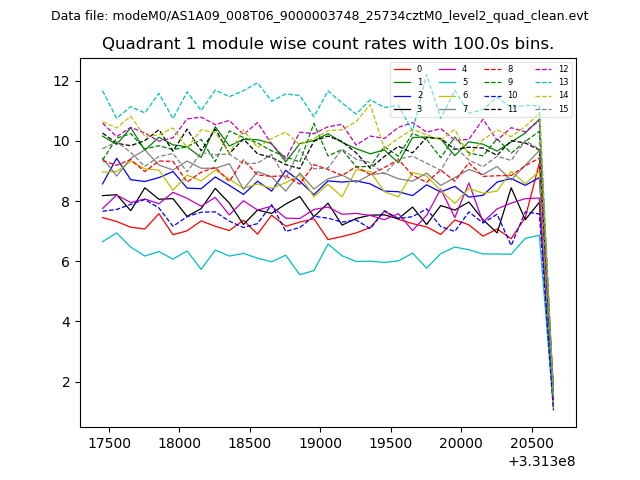
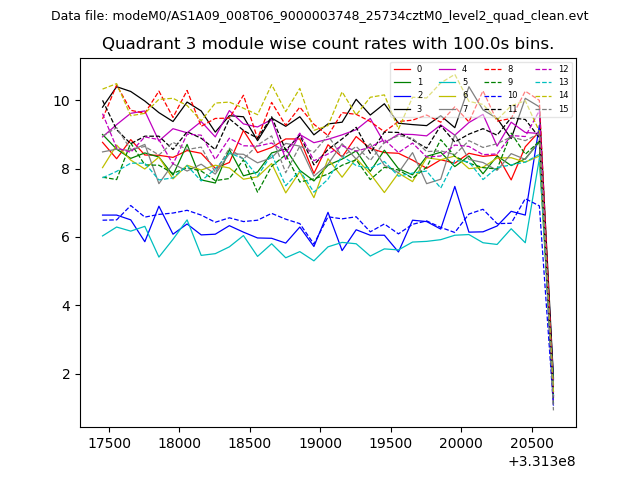
| Module-wise count rates for Quadrant A Data is divided into 100 sec bins |
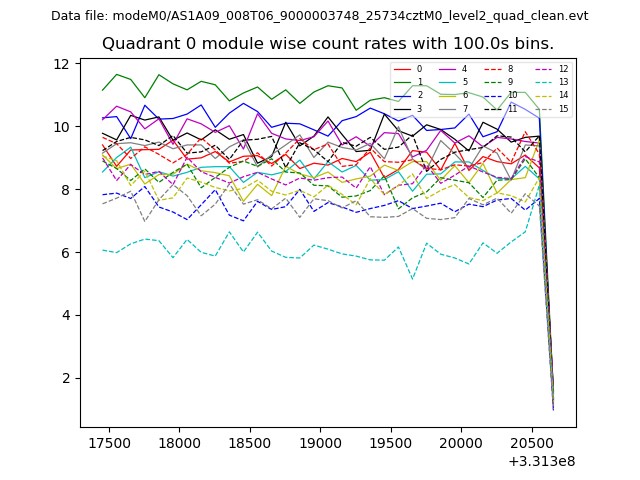 |
 |
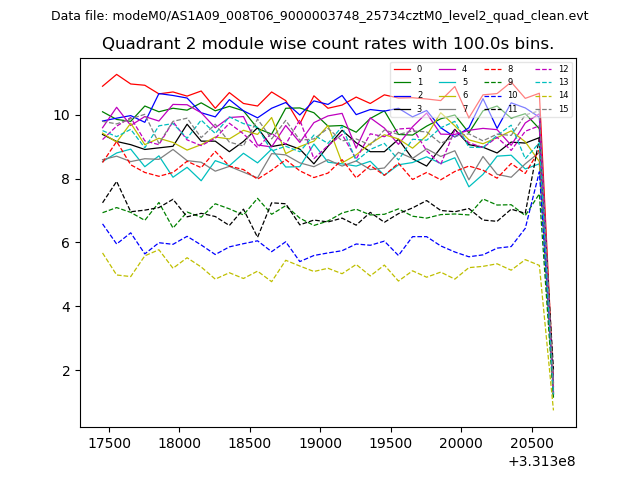
| Module-wise count rates for Quadrant B Data is divided into 100 sec bins |
 |
 |
| Module-wise count rates for Quadrant C Data is divided into 100 sec bins |
 |
 |
| Module-wise count rates for Quadrant D Data is divided into 100 sec bins |
 |
 |
| Parameter | Plot |
|---|---|
| CZT HV Monitor | 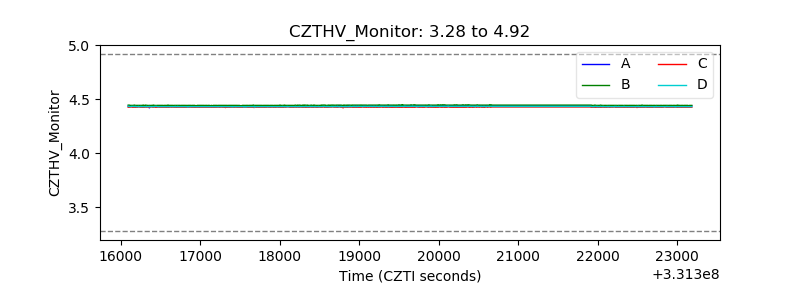 |
| D_VDD | 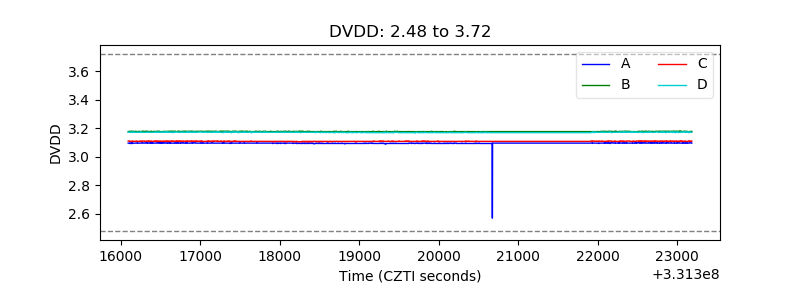 |
| Temperature 1 | 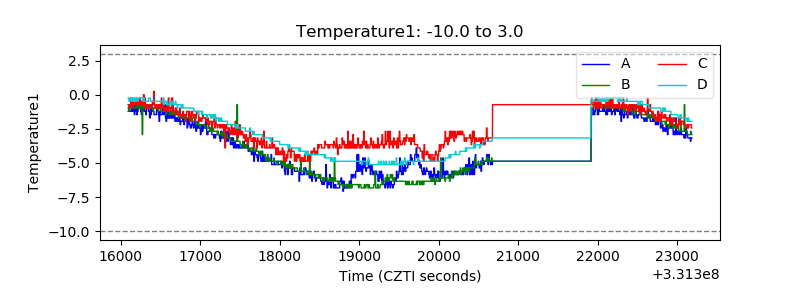 |
| Veto HV Monitor | 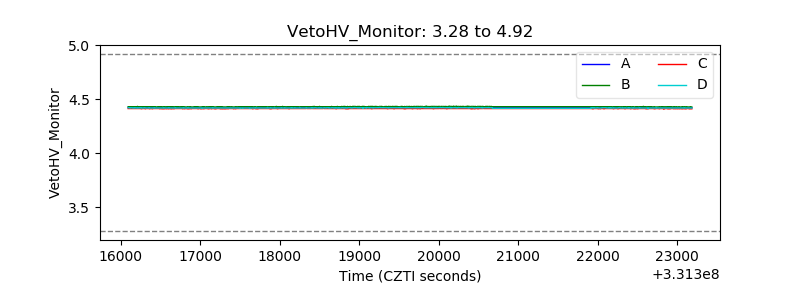 |
| Veto LLD | 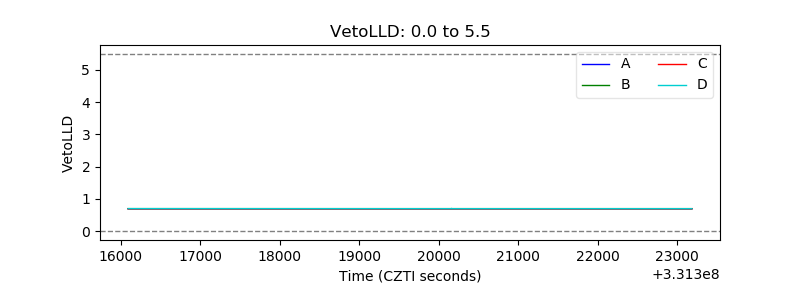 |
| Alpha Counter | 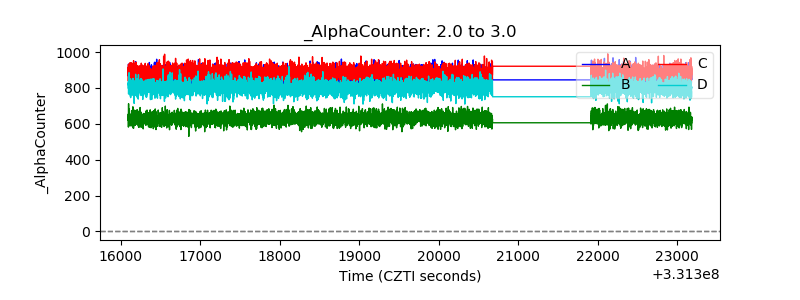 |
| _CPM_Rate | 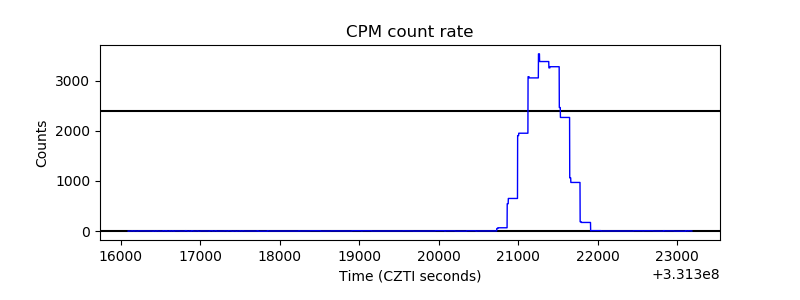 |
| CZT Counter | 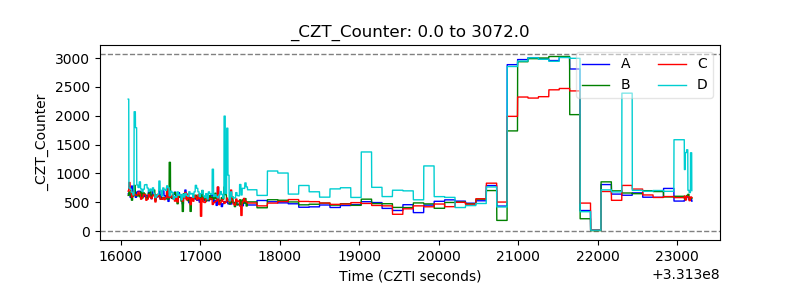 |
| +2.5 Volts monitor |  |
| +5 Volts monitor | 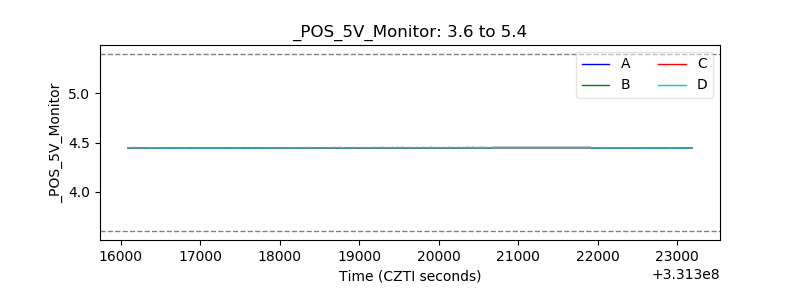 |
| _ROLL_ROT |  |
| _Roll_DEC | 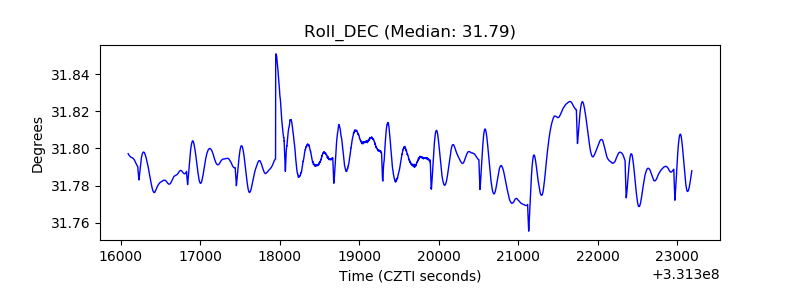 |
| _Roll_RA | 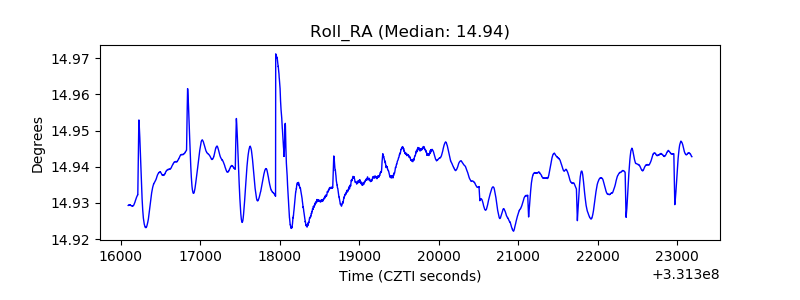 |
| Veto Counter | 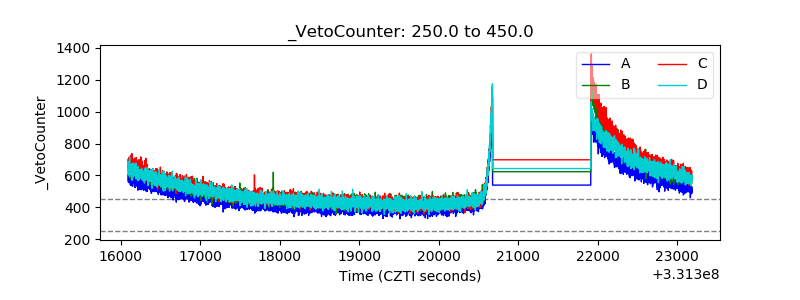 |