| Param | Original file | Final file |
|---|---|---|
| Filename | modeM0/AS1A09_008T06_9000003748_25735cztM0_level2.evt | modeM0/AS1A09_008T06_9000003748_25735cztM0_level2_quad_clean.evt |
| Size (bytes) | 539,023,680 | 88,018,560 |
| Size | 514.1 MB | 83.9 MB |
| Events in quadrant A | 3,456,670 | 565,219 |
| Events in quadrant B | 3,669,116 | 579,824 |
| Events in quadrant C | 3,573,397 | 560,615 |
| Events in quadrant D | 5,211,127 | 532,799 |
| Mode M0 | |||
|---|---|---|---|
| Quadrant | BADHDUFLAG | Total packets | Discarded packets |
| A | 0 | 14359 | 0 |
| B | 0 | 15002 | 0 |
| C | 0 | 14674 | 0 |
| D | 0 | 19687 | 0 |
| Mode M9 | |||
|---|---|---|---|
| Quadrant | BADHDUFLAG | Total packets | Discarded packets |
| A | 0 | 21 | 0 |
| B | 0 | 22 | 0 |
| C | 0 | 22 | 0 |
| D | 0 | 22 | 0 |
| Quadrant | Total seconds | Saturated seconds | Saturation percentage |
|---|---|---|---|
| A | 6111 | 50 | 0.818197% |
| B | 6111 | 61 | 0.998200% |
| C | 6111 | 111 | 1.816397% |
| D | 6111 | 425 | 6.954672% |
Noise dominated data is calculated using 1-second bins in cleaned event files. If a bin has >2000 counts, and if more than 50% of those come from <1% of pixels, then it is considered to be noise-dominated and hence unusable.
| Quadrant | # 1 sec bins | Bins with >0 counts | Bins with >2000 counts | High rate bins dominated by noise | Noise dominated (total time) | Noise dominated (detector-on time) | Marked lightcurve |
|---|---|---|---|---|---|---|---|
| A | 7486 | 6111 | 1 | 1 | 0.01% | 0.02% | 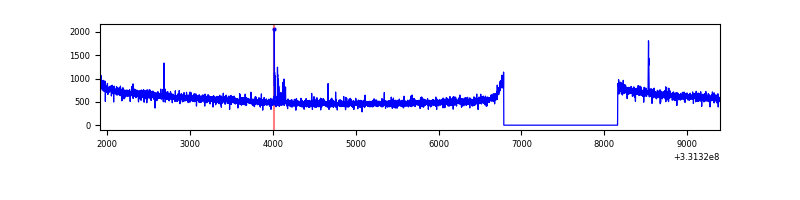 |
| B | 7486 | 6112 | 5 | 5 | 0.07% | 0.08% | 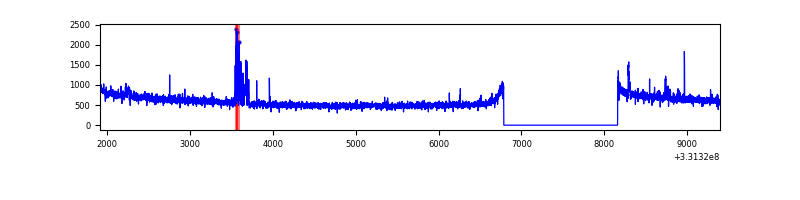 |
| C | 7486 | 6111 | 1 | 1 | 0.01% | 0.02% | 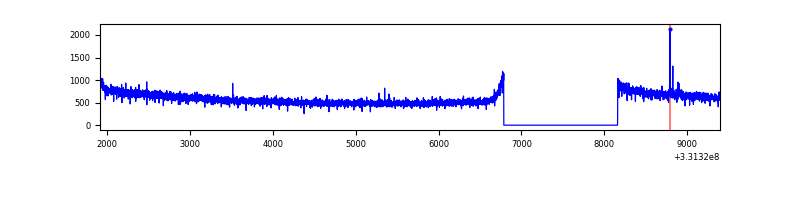 |
| D | 7486 | 6111 | 309 | 309 | 4.13% | 5.06% | 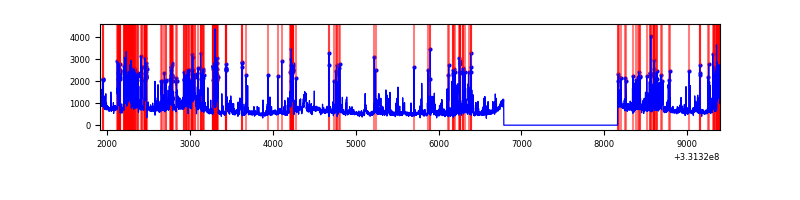 |
Top three noisy pixels from each quadrant. If the there are fewer than three noisy pixels in the level2.evt file, extra rows are filled as -1
| Pixel properties | Quadrant properties | ||||||
|---|---|---|---|---|---|---|---|
| Quadrant | DetID | PixID | Counts | Sigma | Mean | Median | Sigma |
| A | 0 | 13 | 18145 | 98.56 | 889 | 876 | 175.2 |
| A | 13 | 254 | 9422 | 48.77 | 889 | 876 | 175.2 |
| A | 5 | 168 | 9134 | 47.13 | 889 | 876 | 175.2 |
| B | 4 | 171 | 79078 | 480.0 | 892 | 876 | 162.9 |
| B | 0 | 190 | 26648 | 158.19 | 892 | 876 | 162.9 |
| B | 3 | 112 | 25634 | 151.96 | 892 | 876 | 162.9 |
| C | 14 | 238 | 142124 | 700.8 | 873 | 885 | 201.5 |
| C | 3 | 233 | 30278 | 145.84 | 873 | 885 | 201.5 |
| C | 13 | 61 | 5983 | 25.3 | 873 | 885 | 201.5 |
| D | 1 | 52 | 951735 | 4528.4 | 859 | 837 | 210.0 |
| D | 7 | 80 | 588012 | 2796.26 | 859 | 837 | 210.0 |
| D | 7 | 238 | 158460 | 750.64 | 859 | 837 | 210.0 |
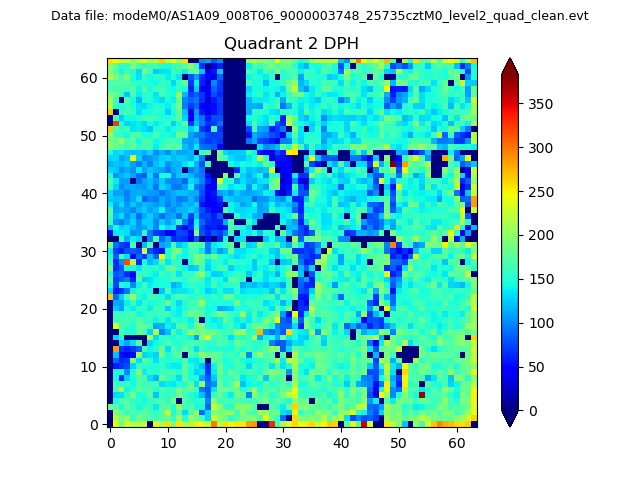
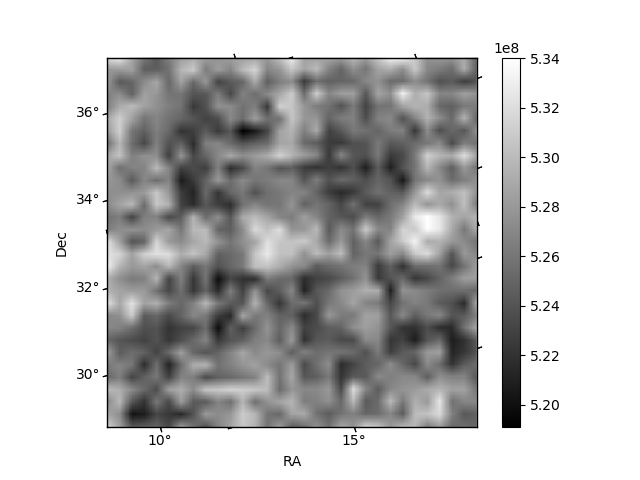
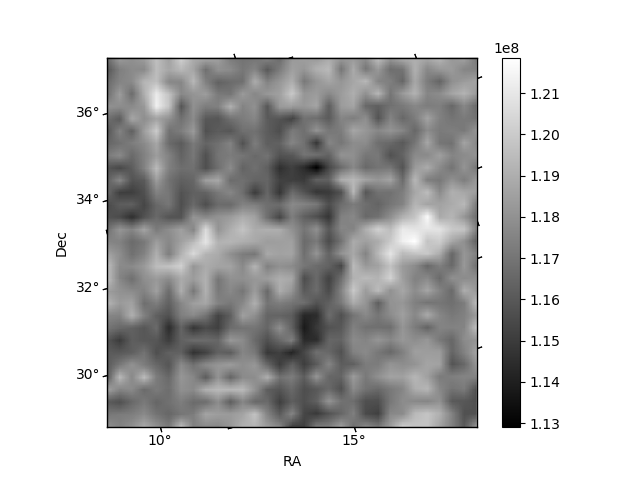
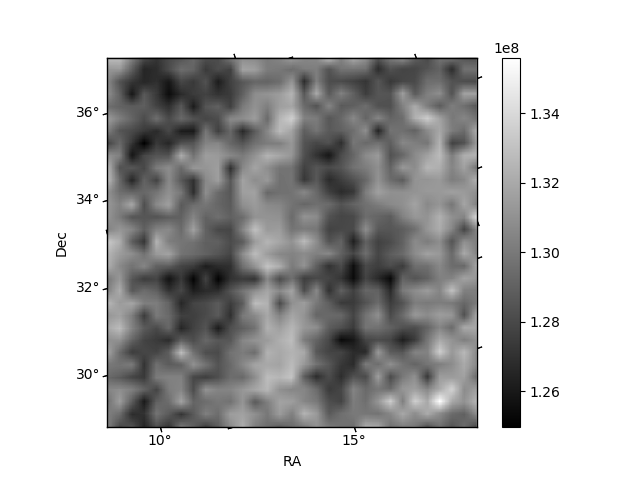
Histogram calculated using DETX and DETY for each event in the final _common_clean file
| Quadrant A | 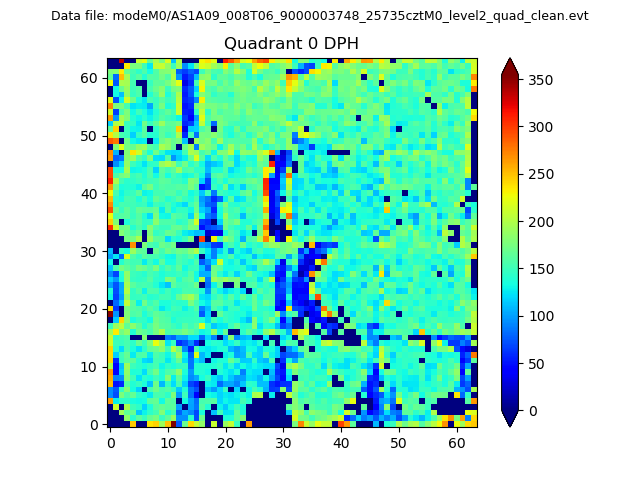 |
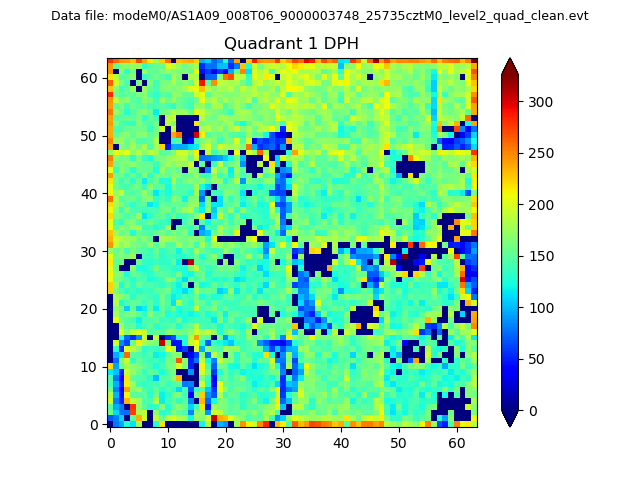 |
Quadrant B |
|---|---|---|---|
| Quadrant D | 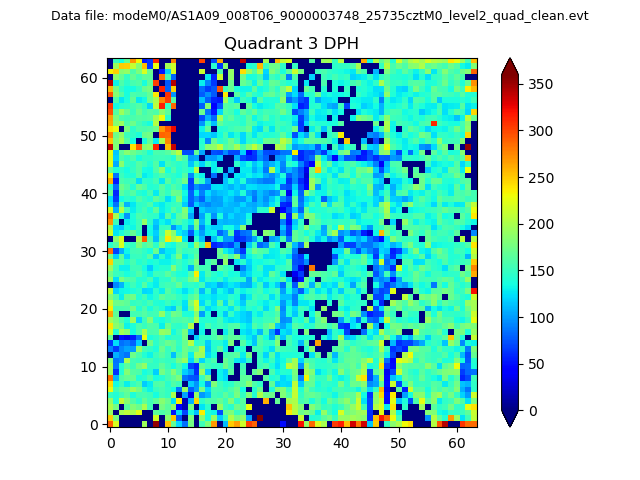 |
 |
Quadrant C |
| Plot type | Count rate plots | Images |
|---|---|---|
| Comparison with Poisson distribution Blue bars denote a histogram of data divided into 1 sec bins. Red curve is a Poisson curve with rate = median count rate of data. |
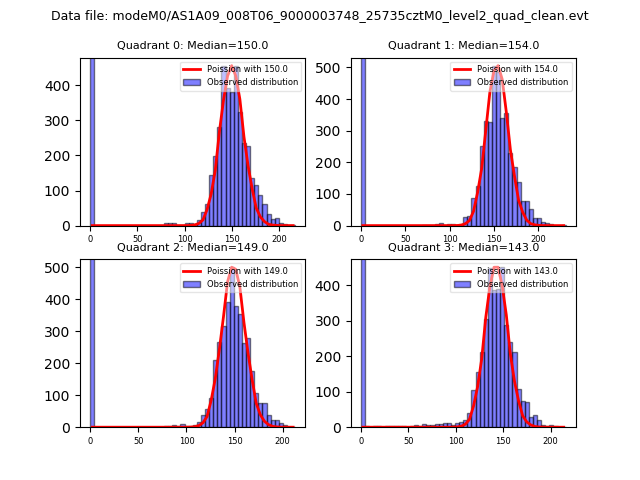 |
 |
| Quadrant-wise count rates Data is divided into 100 sec bins |
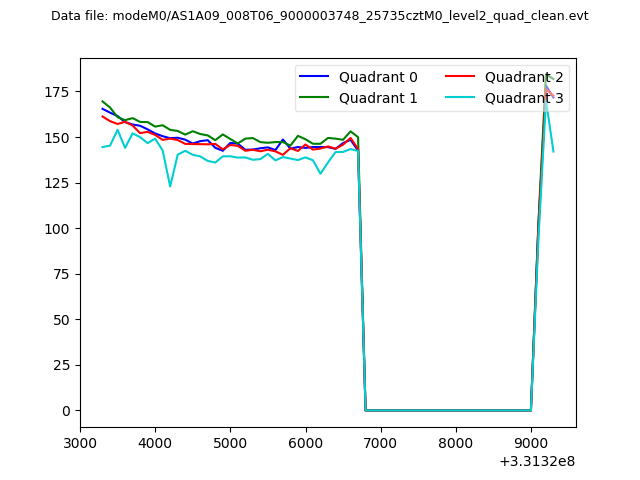 |
|
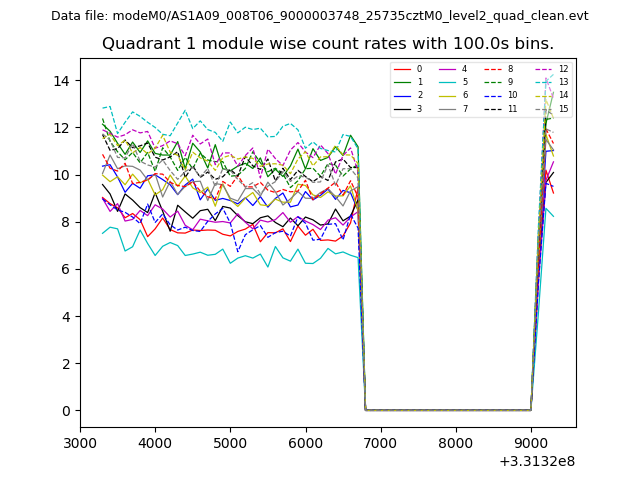
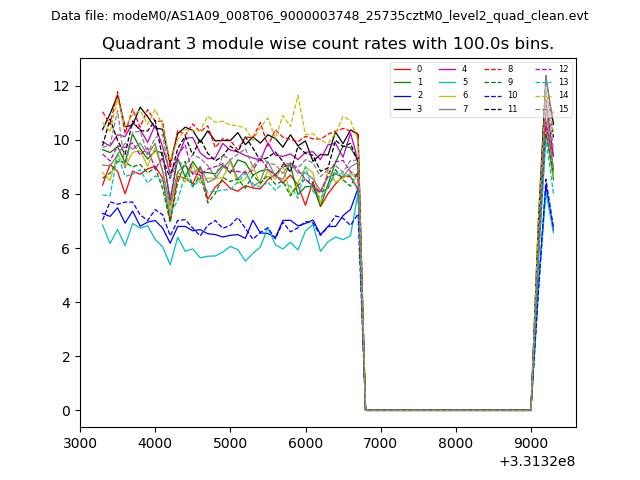
| Module-wise count rates for Quadrant A Data is divided into 100 sec bins |
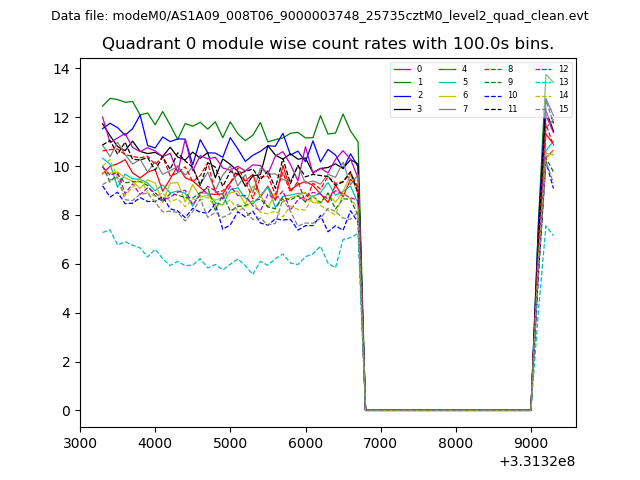 |
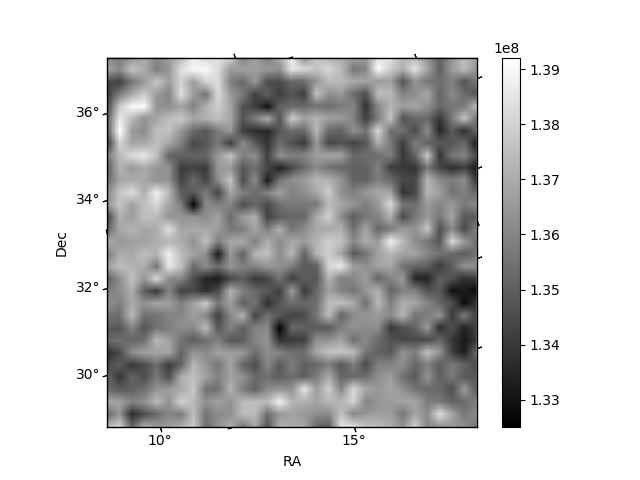 |
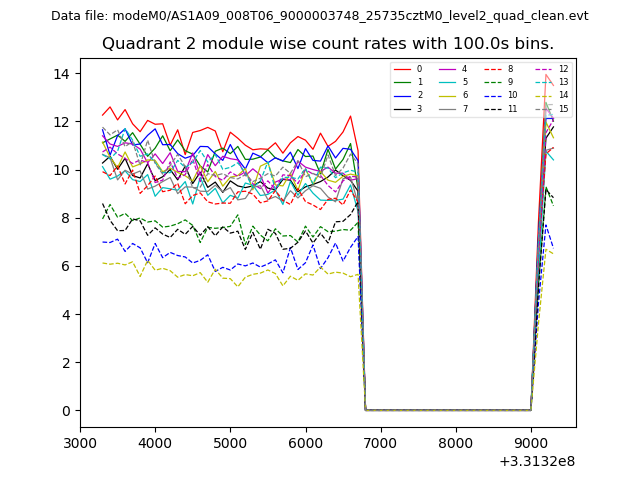
| Module-wise count rates for Quadrant B Data is divided into 100 sec bins |
 |
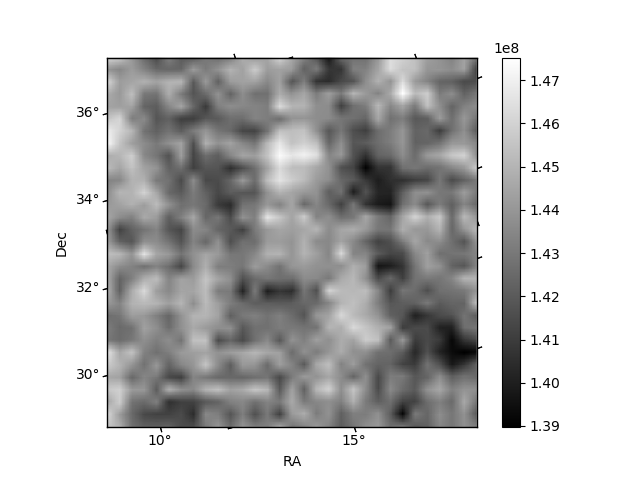 |
| Module-wise count rates for Quadrant C Data is divided into 100 sec bins |
 |
 |
| Module-wise count rates for Quadrant D Data is divided into 100 sec bins |
 |
 |
| Parameter | Plot |
|---|---|
| CZT HV Monitor | 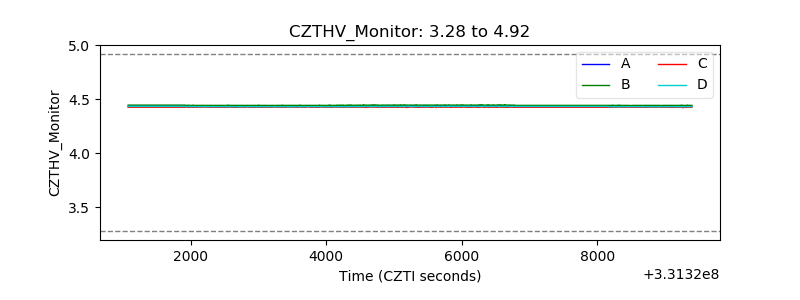 |
| D_VDD | 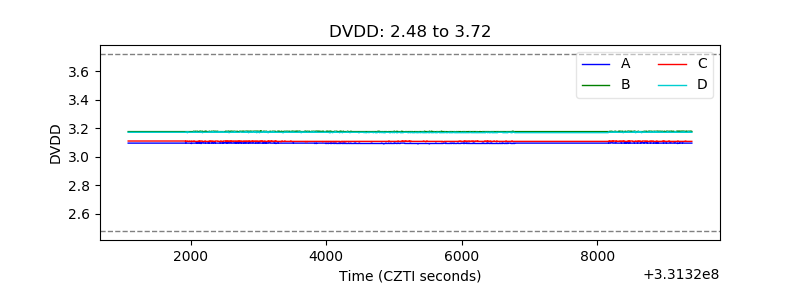 |
| Temperature 1 | 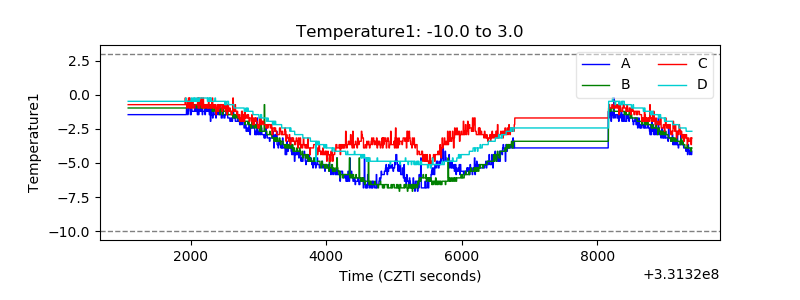 |
| Veto HV Monitor | 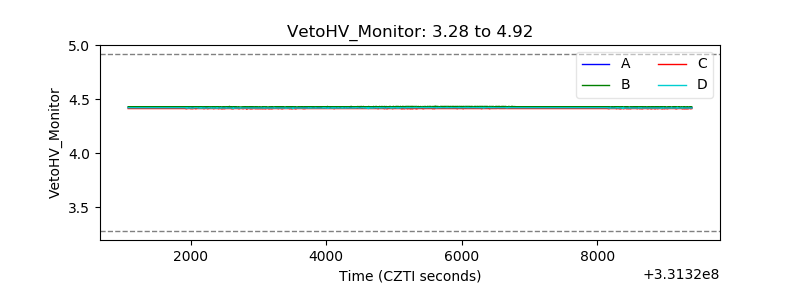 |
| Veto LLD | 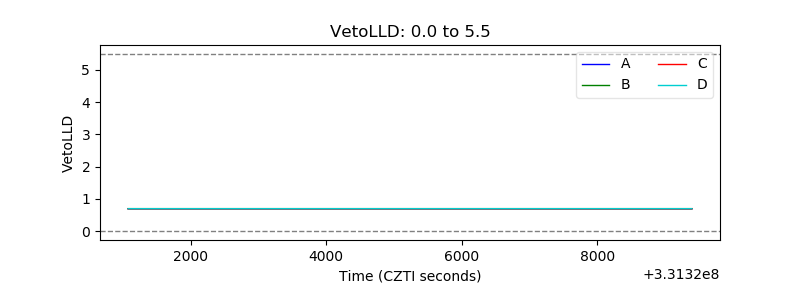 |
| Alpha Counter | 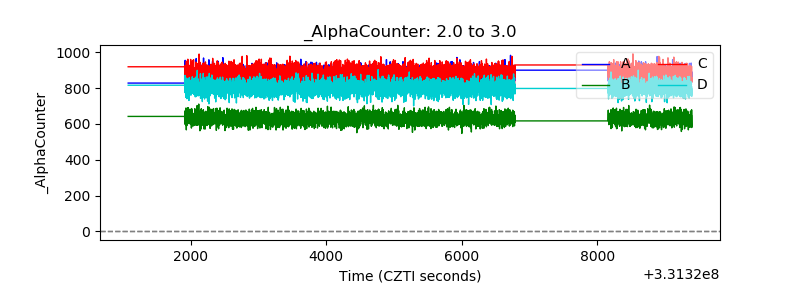 |
| _CPM_Rate | 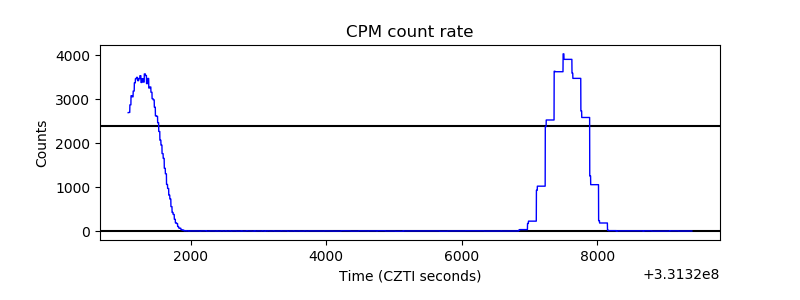 |
| CZT Counter | 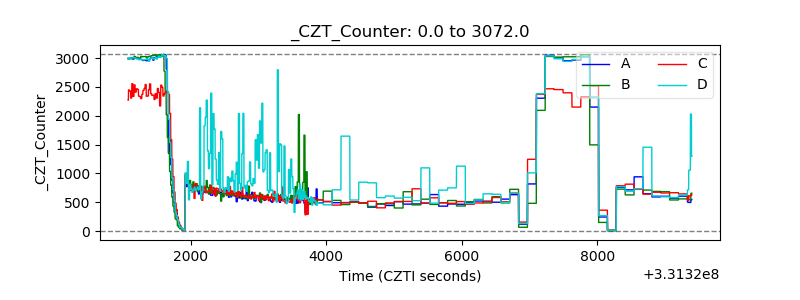 |
| +2.5 Volts monitor |  |
| +5 Volts monitor |  |
| _ROLL_ROT | 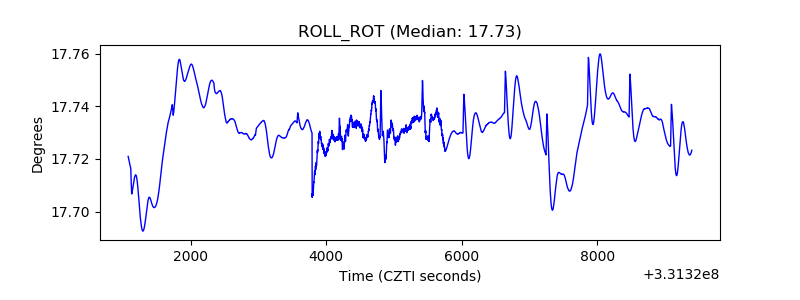 |
| _Roll_DEC | 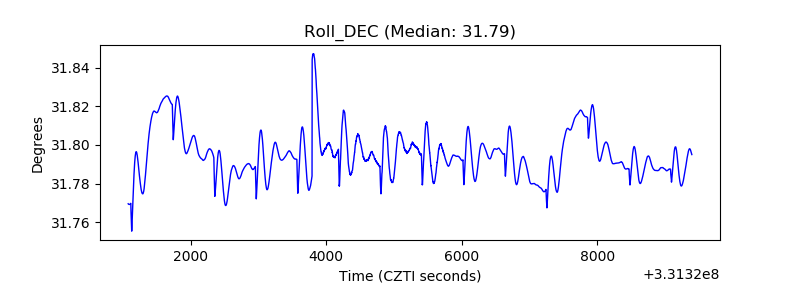 |
| _Roll_RA | 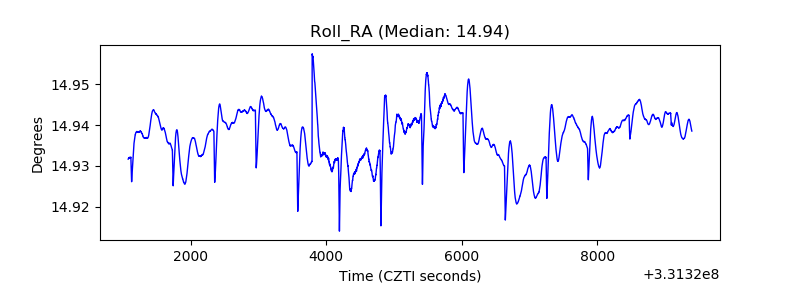 |
| Veto Counter | 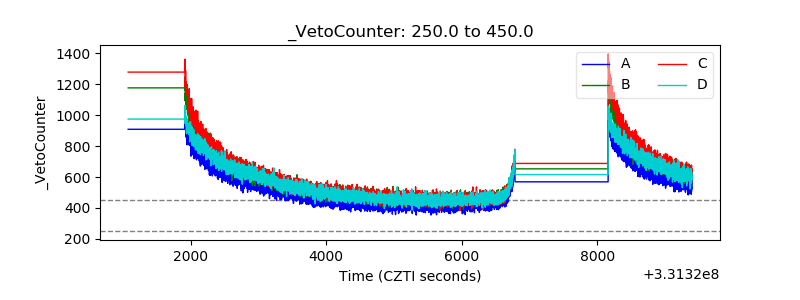 |