| Param | Original file | Final file |
|---|---|---|
| Filename | modeM0/AS1A09_008T06_9000003748_25736cztM0_level2.evt | modeM0/AS1A09_008T06_9000003748_25736cztM0_level2_quad_clean.evt |
| Size (bytes) | 521,386,560 | 101,767,680 |
| Size | 497.2 MB | 97.1 MB |
| Events in quadrant A | 3,422,820 | 667,857 |
| Events in quadrant B | 3,561,606 | 688,656 |
| Events in quadrant C | 3,534,616 | 667,153 |
| Events in quadrant D | 4,861,281 | 635,889 |
| Mode M0 | |||
|---|---|---|---|
| Quadrant | BADHDUFLAG | Total packets | Discarded packets |
| A | 0 | 14166 | 0 |
| B | 0 | 14656 | 0 |
| C | 0 | 14549 | 0 |
| D | 0 | 18487 | 0 |
| Mode M9 | |||
|---|---|---|---|
| Quadrant | BADHDUFLAG | Total packets | Discarded packets |
| A | 0 | 23 | 0 |
| B | 0 | 24 | 0 |
| C | 0 | 24 | 0 |
| D | 0 | 24 | 0 |
| Quadrant | Total seconds | Saturated seconds | Saturation percentage |
|---|---|---|---|
| A | 6046 | 83 | 1.372808% |
| B | 6046 | 102 | 1.687066% |
| C | 6046 | 145 | 2.398280% |
| D | 6046 | 315 | 5.210056% |
Noise dominated data is calculated using 1-second bins in cleaned event files. If a bin has >2000 counts, and if more than 50% of those come from <1% of pixels, then it is considered to be noise-dominated and hence unusable.
| Quadrant | # 1 sec bins | Bins with >0 counts | Bins with >2000 counts | High rate bins dominated by noise | Noise dominated (total time) | Noise dominated (detector-on time) | Marked lightcurve |
|---|---|---|---|---|---|---|---|
| A | 7451 | 6046 | 9 | 9 | 0.12% | 0.15% | 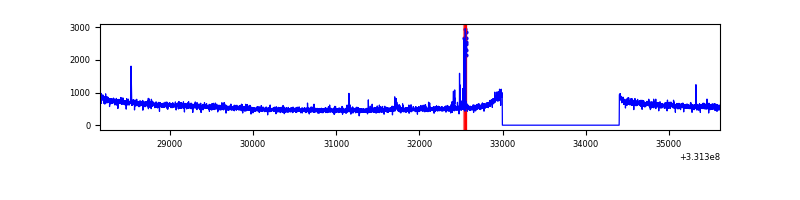 |
| B | 7451 | 6046 | 4 | 4 | 0.05% | 0.07% | 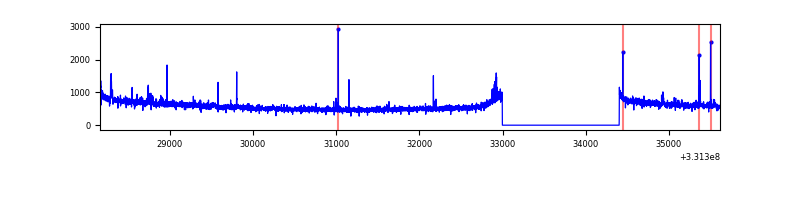 |
| C | 7451 | 6046 | 1 | 1 | 0.01% | 0.02% | 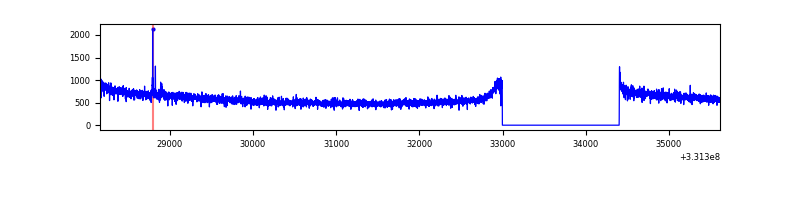 |
| D | 7451 | 6046 | 198 | 198 | 2.66% | 3.27% | 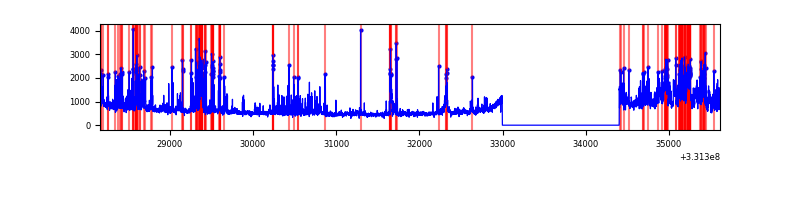 |
Top three noisy pixels from each quadrant. If the there are fewer than three noisy pixels in the level2.evt file, extra rows are filled as -1
| Pixel properties | Quadrant properties | ||||||
|---|---|---|---|---|---|---|---|
| Quadrant | DetID | PixID | Counts | Sigma | Mean | Median | Sigma |
| A | 0 | 13 | 41538 | 233.52 | 875 | 862 | 174.2 |
| A | 13 | 254 | 10565 | 55.71 | 875 | 862 | 174.2 |
| A | 5 | 168 | 9181 | 47.76 | 875 | 862 | 174.2 |
| B | 15 | 222 | 35714 | 213.98 | 879 | 861 | 162.9 |
| B | 0 | 190 | 22493 | 132.81 | 879 | 861 | 162.9 |
| B | 5 | 172 | 19989 | 117.43 | 879 | 861 | 162.9 |
| C | 14 | 238 | 141217 | 705.93 | 863 | 875 | 198.8 |
| C | 3 | 233 | 25656 | 124.65 | 863 | 875 | 198.8 |
| C | 13 | 61 | 5957 | 25.56 | 863 | 875 | 198.8 |
| D | 1 | 52 | 1200203 | 5791.39 | 860 | 840 | 207.1 |
| D | 7 | 80 | 178565 | 858.18 | 860 | 840 | 207.1 |
| D | 4 | 214 | 65647 | 312.93 | 860 | 840 | 207.1 |
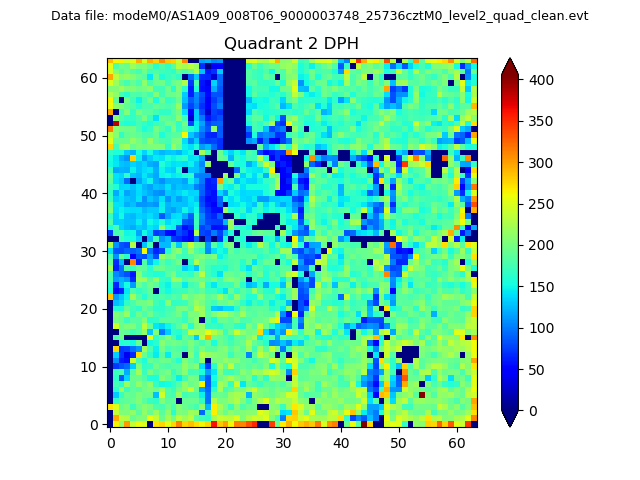
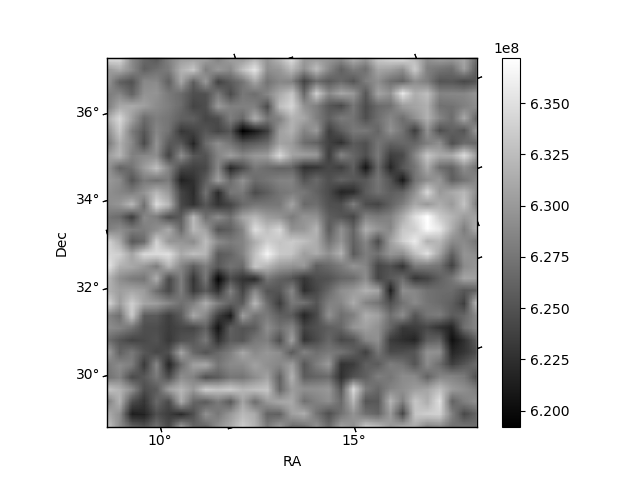
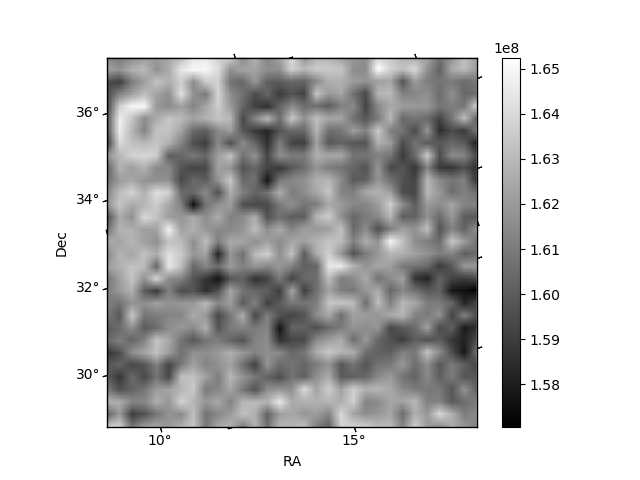
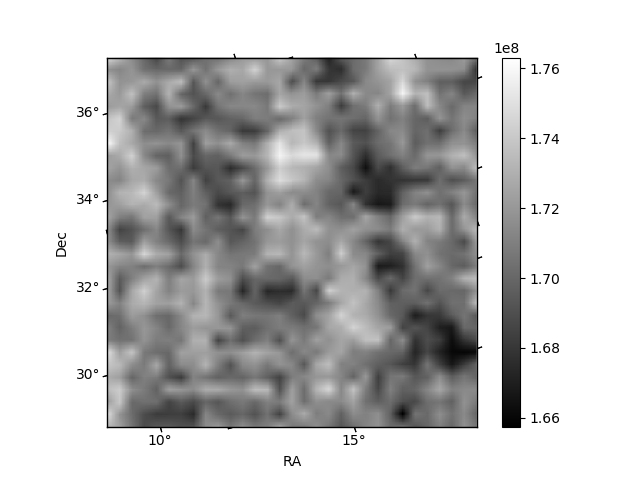
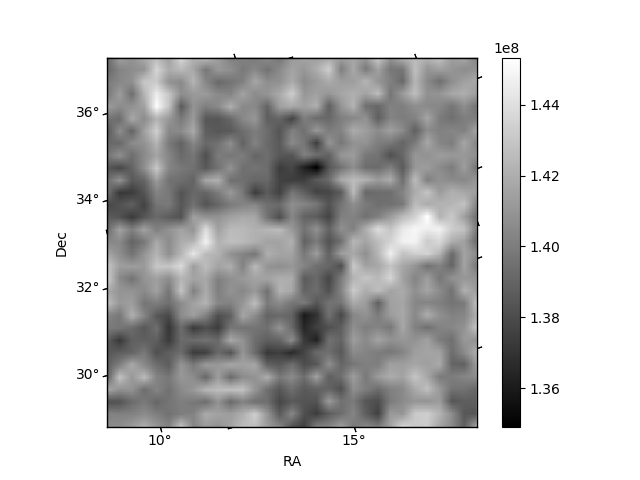
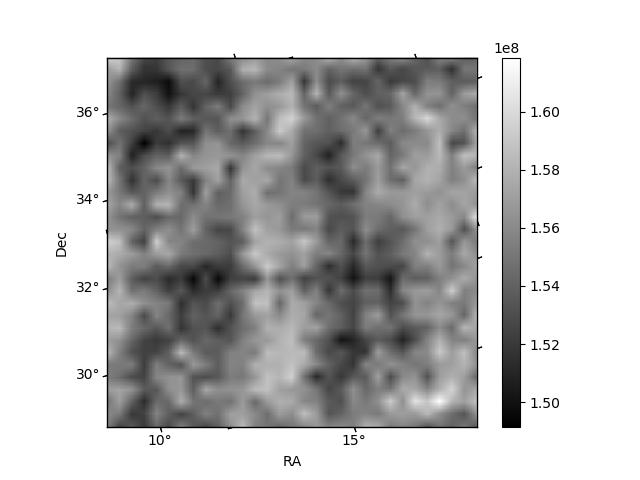
Histogram calculated using DETX and DETY for each event in the final _common_clean file
| Quadrant A | 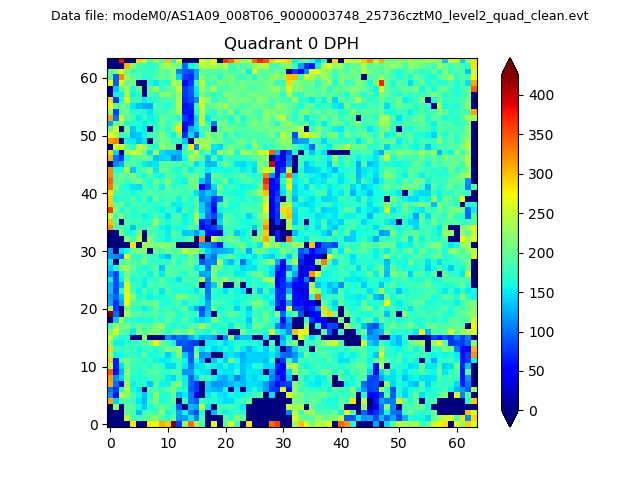 |
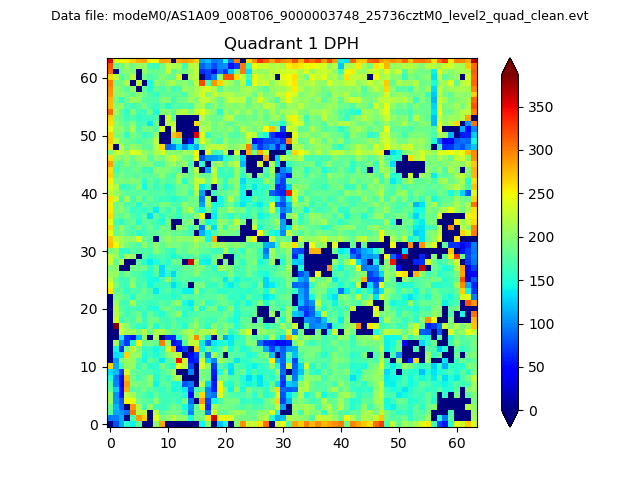 |
Quadrant B |
|---|---|---|---|
| Quadrant D | 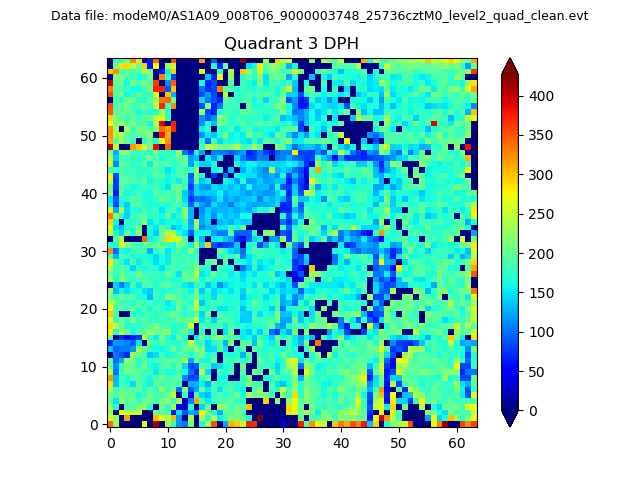 |
 |
Quadrant C |
| Plot type | Count rate plots | Images |
|---|---|---|
| Comparison with Poisson distribution Blue bars denote a histogram of data divided into 1 sec bins. Red curve is a Poisson curve with rate = median count rate of data. |
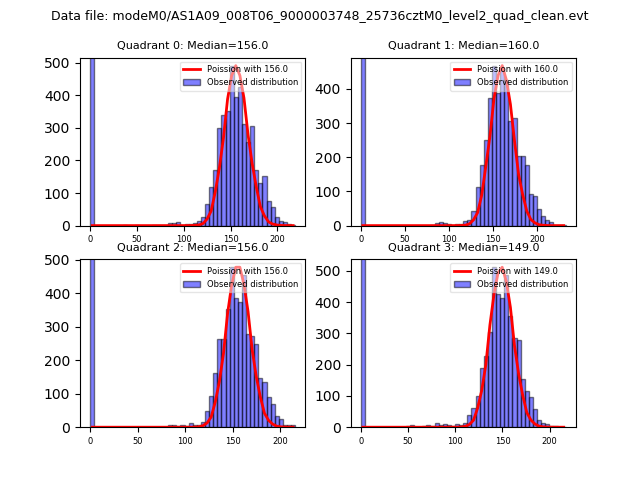 |
 |
| Quadrant-wise count rates Data is divided into 100 sec bins |
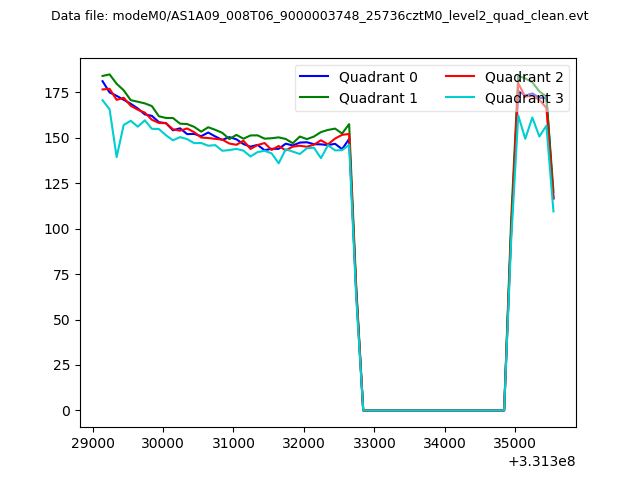 |
|
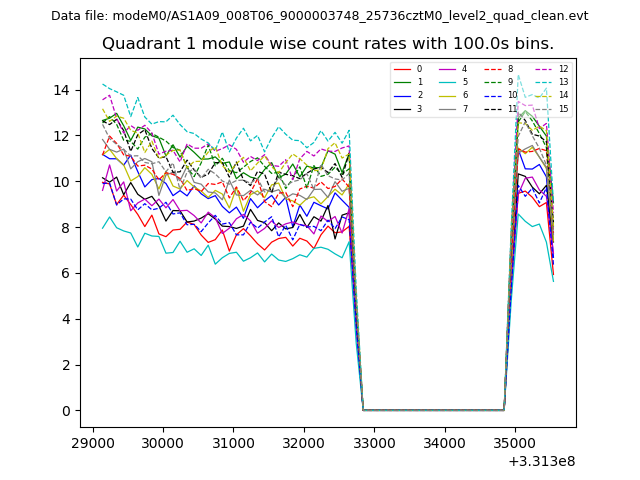
| Module-wise count rates for Quadrant A Data is divided into 100 sec bins |
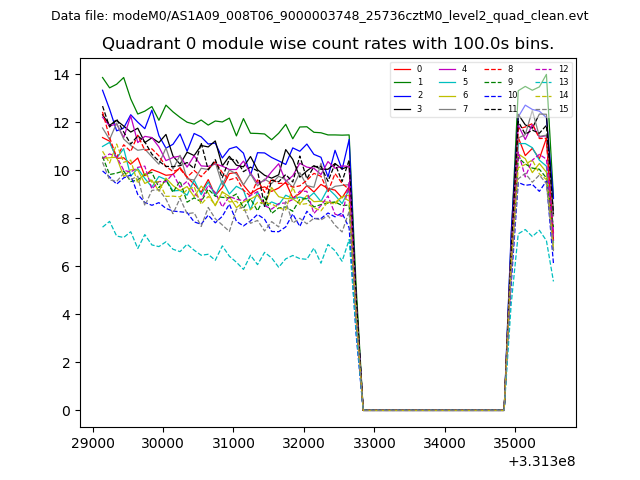 |
 |
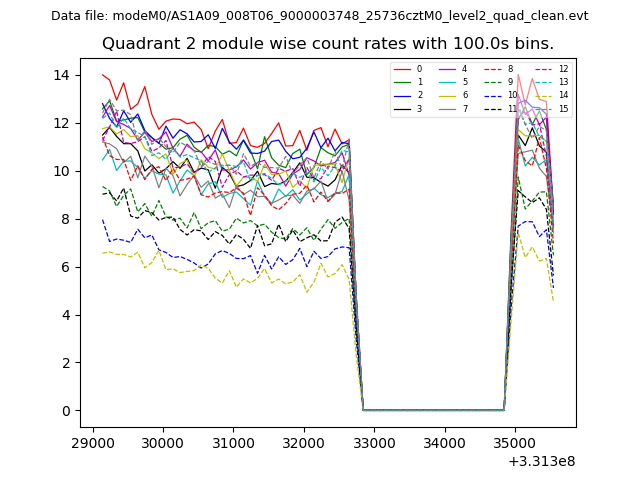
| Module-wise count rates for Quadrant B Data is divided into 100 sec bins |
 |
 |
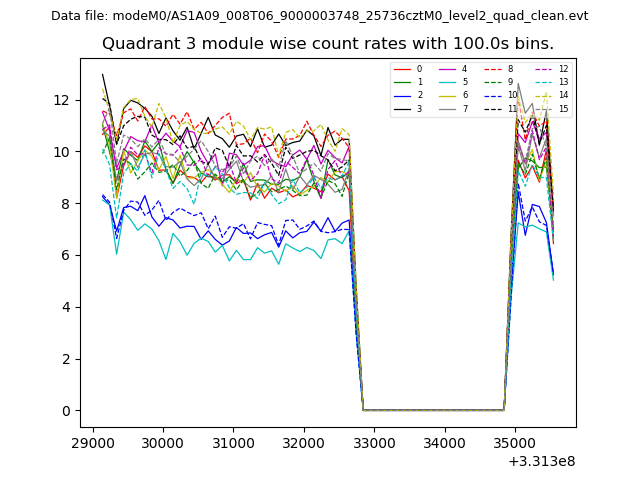
| Module-wise count rates for Quadrant C Data is divided into 100 sec bins |
 |
 |
| Module-wise count rates for Quadrant D Data is divided into 100 sec bins |
 |
 |
| Parameter | Plot |
|---|---|
| CZT HV Monitor | 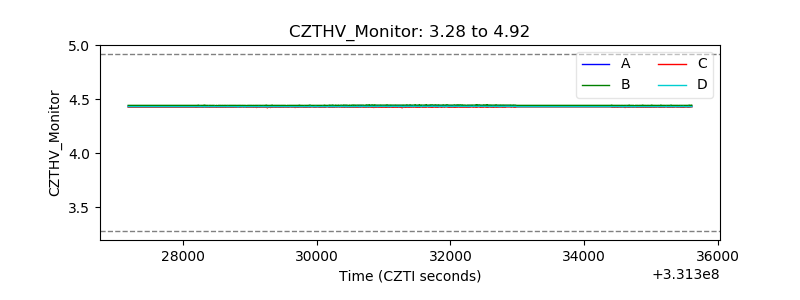 |
| D_VDD | 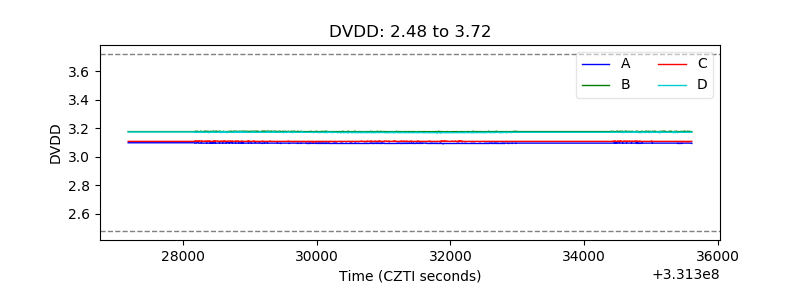 |
| Temperature 1 | 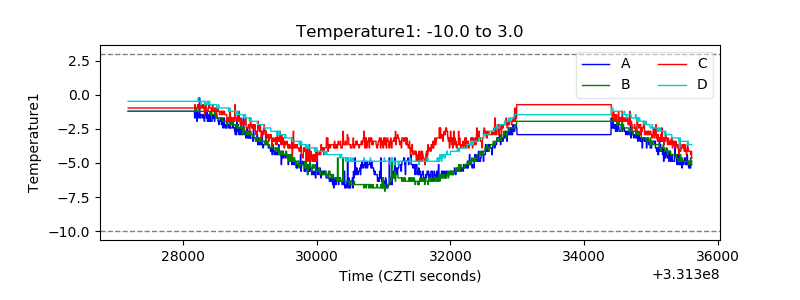 |
| Veto HV Monitor | 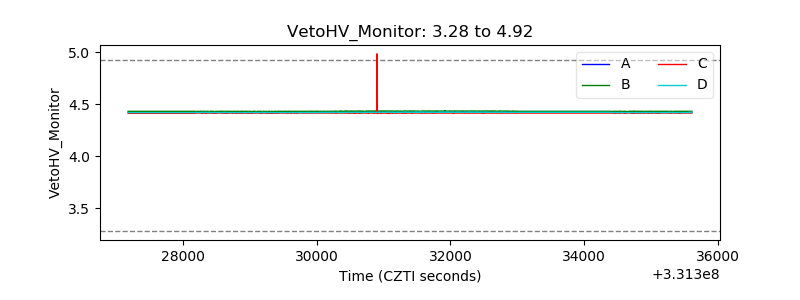 |
| Veto LLD | 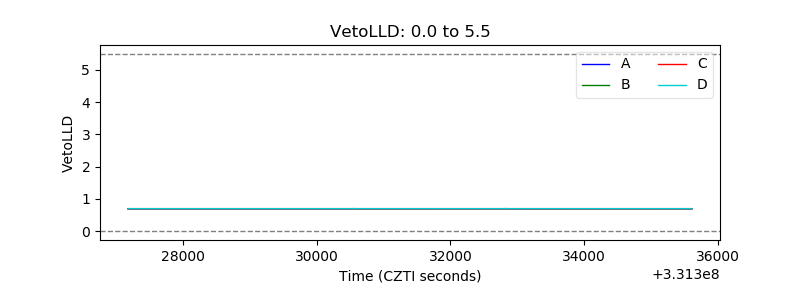 |
| Alpha Counter | 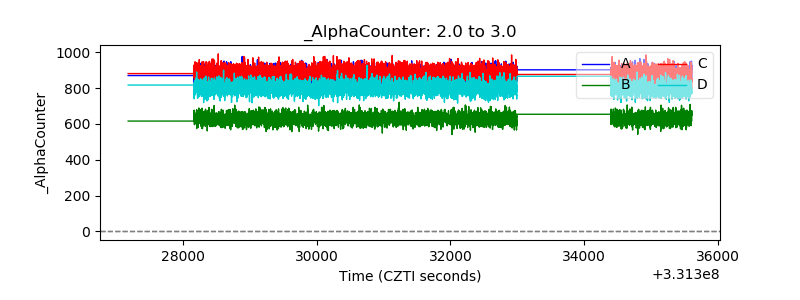 |
| _CPM_Rate | 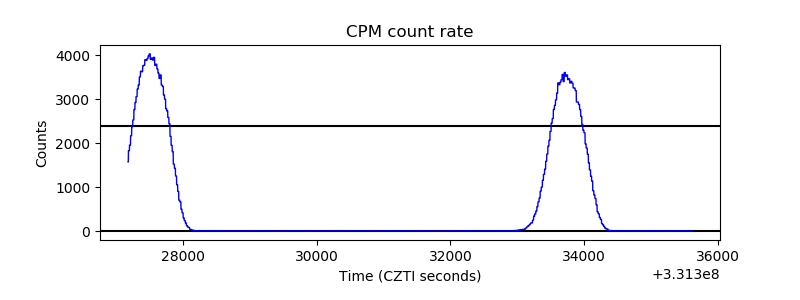 |
| CZT Counter | 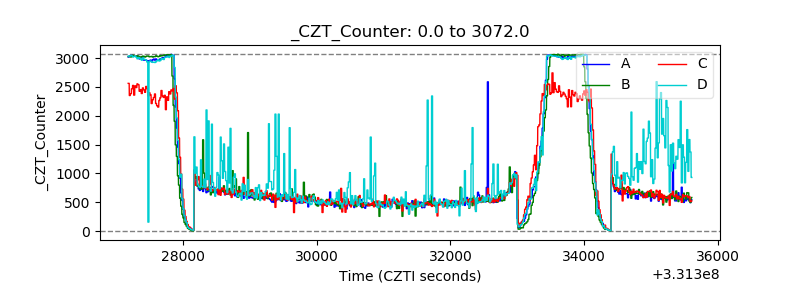 |
| +2.5 Volts monitor |  |
| +5 Volts monitor | 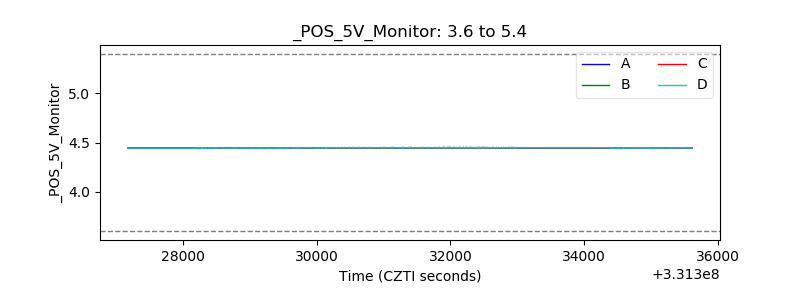 |
| _ROLL_ROT | 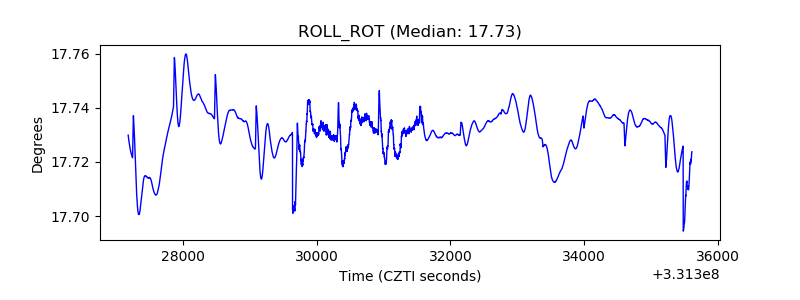 |
| _Roll_DEC | 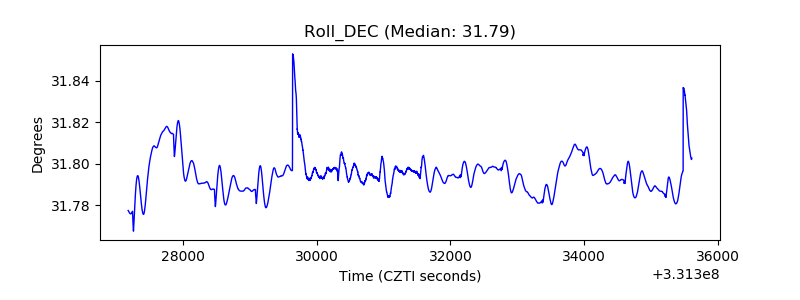 |
| _Roll_RA | 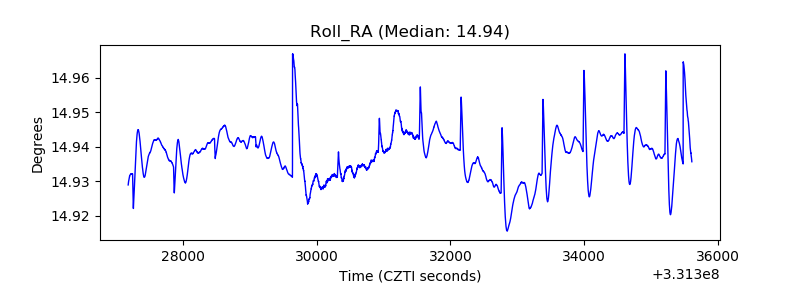 |
| Veto Counter | 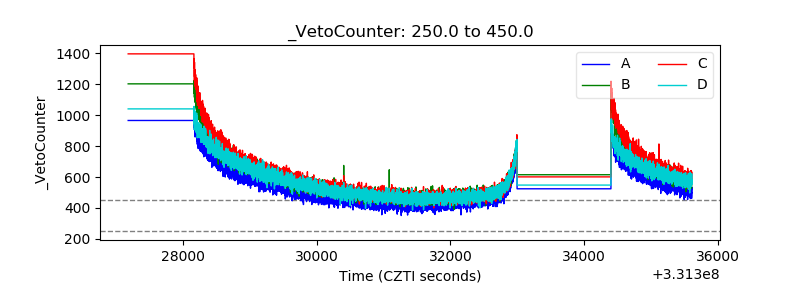 |