| Param | Original file | Final file |
|---|---|---|
| Filename | modeM0/AS1A09_008T06_9000003748_25737cztM0_level2.evt | modeM0/AS1A09_008T06_9000003748_25737cztM0_level2_quad_clean.evt |
| Size (bytes) | 551,534,400 | 108,328,320 |
| Size | 526.0 MB | 103.3 MB |
| Events in quadrant A | 3,233,639 | 718,406 |
| Events in quadrant B | 3,554,448 | 742,313 |
| Events in quadrant C | 3,425,938 | 719,785 |
| Events in quadrant D | 6,078,380 | 676,615 |
| Mode M0 | |||
|---|---|---|---|
| Quadrant | BADHDUFLAG | Total packets | Discarded packets |
| A | 0 | 13440 | 0 |
| B | 0 | 14500 | 0 |
| C | 0 | 14178 | 0 |
| D | 0 | 22332 | 0 |
| Mode M9 | |||
|---|---|---|---|
| Quadrant | BADHDUFLAG | Total packets | Discarded packets |
| A | 0 | 20 | 0 |
| B | 0 | 21 | 0 |
| C | 0 | 21 | 0 |
| D | 0 | 21 | 0 |
| Quadrant | Total seconds | Saturated seconds | Saturation percentage |
|---|---|---|---|
| A | 6068 | 29 | 0.477917% |
| B | 6068 | 65 | 1.071193% |
| C | 6067 | 129 | 2.126257% |
| D | 6067 | 431 | 7.104005% |
Noise dominated data is calculated using 1-second bins in cleaned event files. If a bin has >2000 counts, and if more than 50% of those come from <1% of pixels, then it is considered to be noise-dominated and hence unusable.
| Quadrant | # 1 sec bins | Bins with >0 counts | Bins with >2000 counts | High rate bins dominated by noise | Noise dominated (total time) | Noise dominated (detector-on time) | Marked lightcurve |
|---|---|---|---|---|---|---|---|
| A | 7478 | 6069 | 0 | 0 | 0.00% | 0.00% | 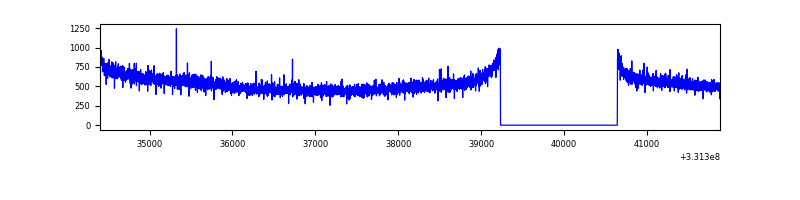 |
| B | 7478 | 6068 | 10 | 10 | 0.13% | 0.16% | 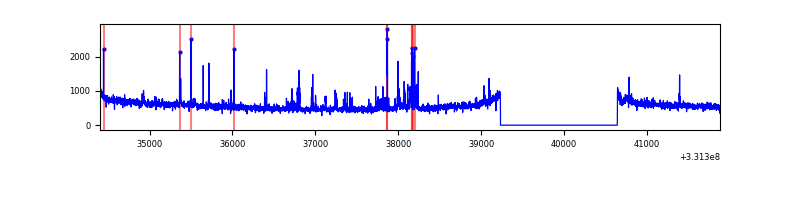 |
| C | 7477 | 6067 | 0 | 0 | 0.00% | 0.00% | 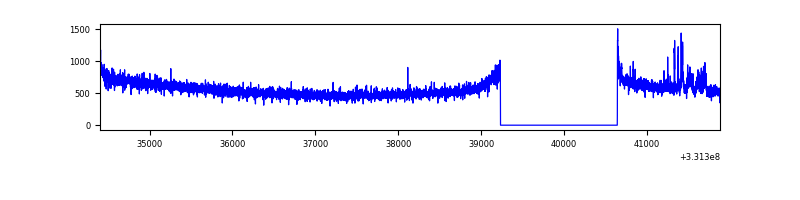 |
| D | 7477 | 6068 | 311 | 311 | 4.16% | 5.13% | 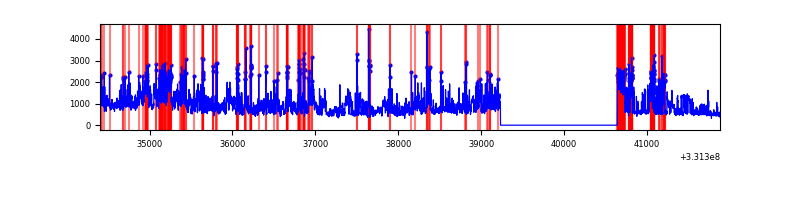 |
Top three noisy pixels from each quadrant. If the there are fewer than three noisy pixels in the level2.evt file, extra rows are filled as -1
| Pixel properties | Quadrant properties | ||||||
|---|---|---|---|---|---|---|---|
| Quadrant | DetID | PixID | Counts | Sigma | Mean | Median | Sigma |
| A | 13 | 254 | 10223 | 56.18 | 836 | 823 | 167.3 |
| A | 0 | 226 | 7219 | 38.22 | 836 | 823 | 167.3 |
| A | 3 | 137 | 7023 | 37.05 | 836 | 823 | 167.3 |
| B | 15 | 222 | 176547 | 1122.02 | 841 | 823 | 156.6 |
| B | 3 | 112 | 40282 | 251.95 | 841 | 823 | 156.6 |
| B | 0 | 190 | 22521 | 138.54 | 841 | 823 | 156.6 |
| C | 14 | 238 | 133032 | 691.21 | 824 | 832 | 191.3 |
| C | 3 | 233 | 72315 | 373.75 | 824 | 832 | 191.3 |
| C | 0 | 10 | 6962 | 32.05 | 824 | 832 | 191.3 |
| D | 1 | 52 | 2650656 | 13719.88 | 806 | 785 | 193.1 |
| D | 7 | 80 | 110405 | 567.56 | 806 | 785 | 193.1 |
| D | 4 | 214 | 87475 | 448.84 | 806 | 785 | 193.1 |
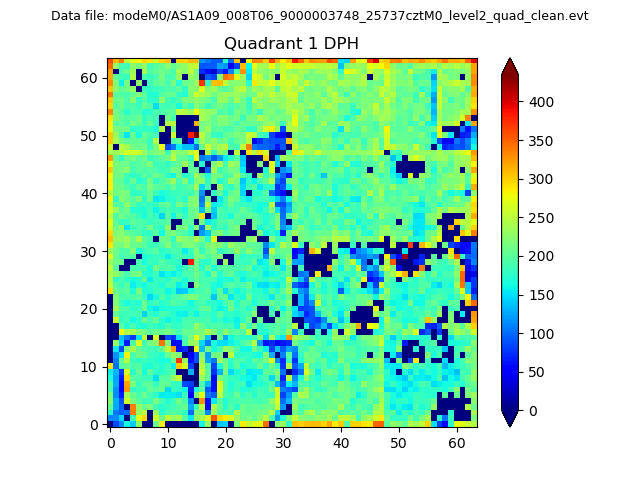
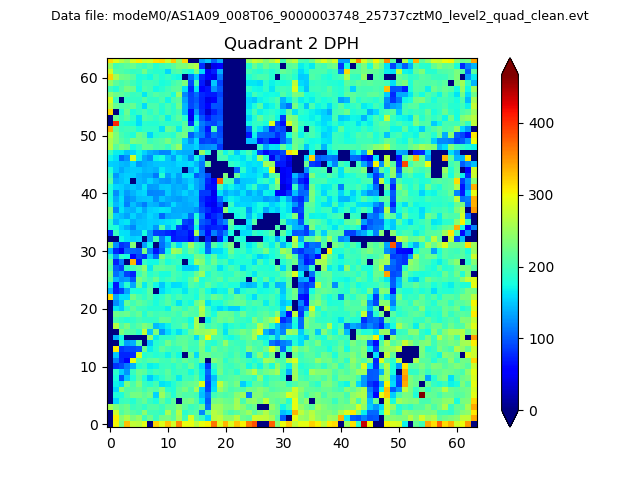
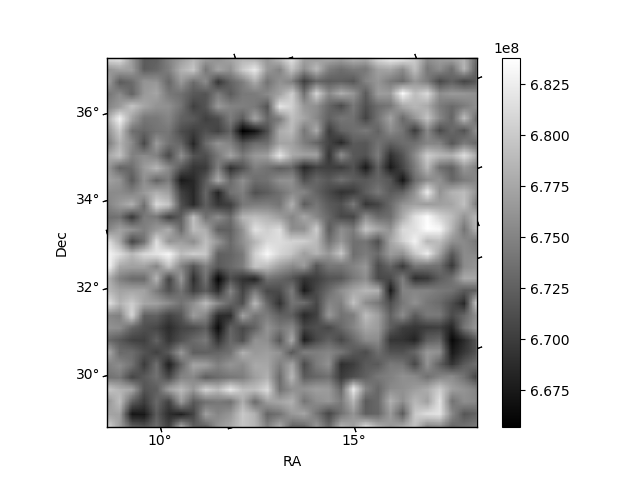
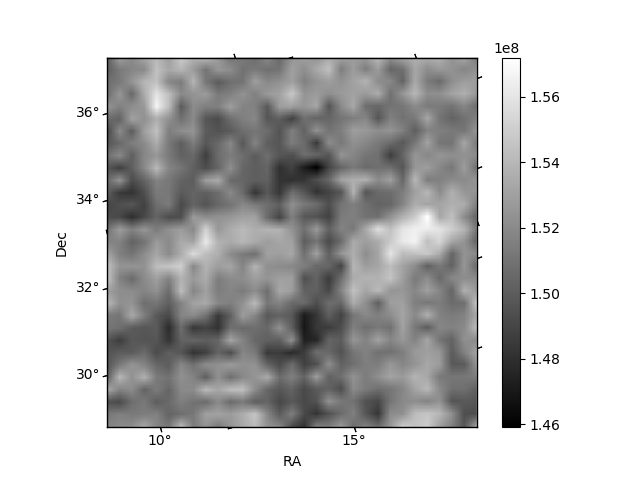
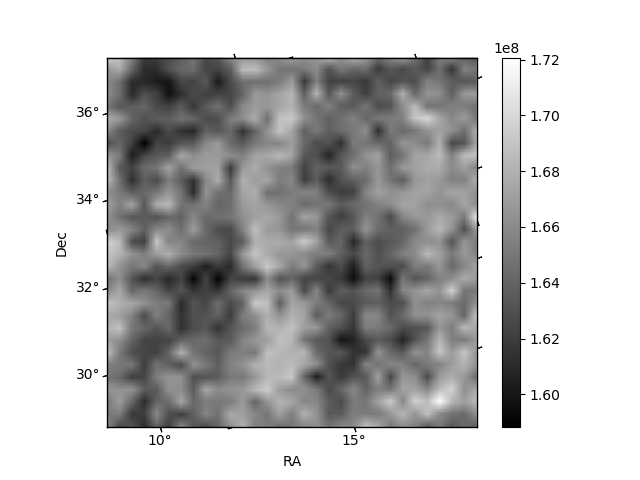
Histogram calculated using DETX and DETY for each event in the final _common_clean file
| Quadrant A |  |
 |
Quadrant B |
|---|---|---|---|
| Quadrant D | 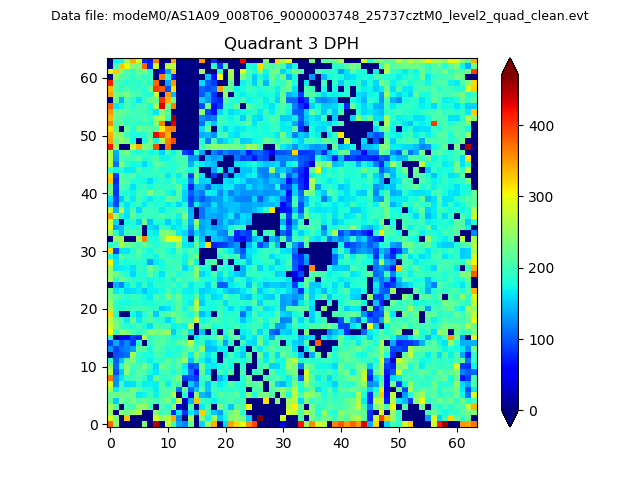 |
 |
Quadrant C |
| Plot type | Count rate plots | Images |
|---|---|---|
| Comparison with Poisson distribution Blue bars denote a histogram of data divided into 1 sec bins. Red curve is a Poisson curve with rate = median count rate of data. |
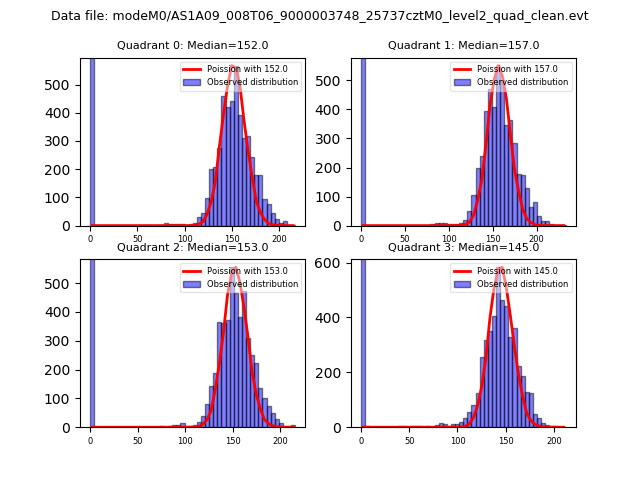 |
 |
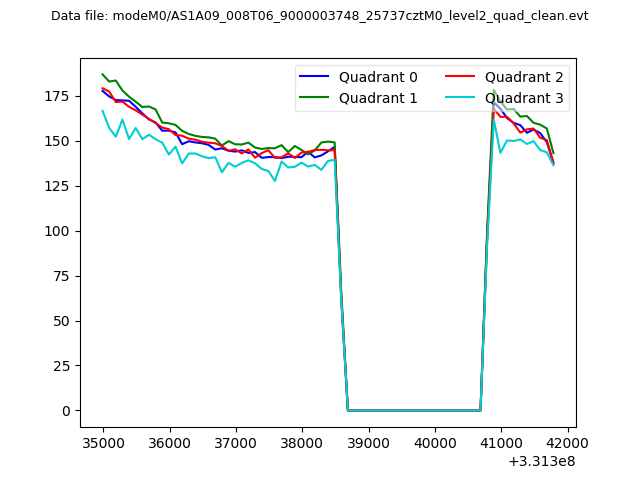
| Quadrant-wise count rates Data is divided into 100 sec bins |
 |
|
| Module-wise count rates for Quadrant A Data is divided into 100 sec bins |
 |
 |
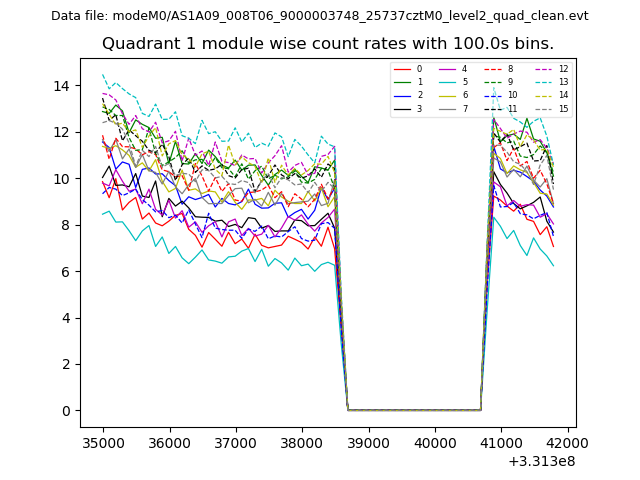
| Module-wise count rates for Quadrant B Data is divided into 100 sec bins |
 |
 |
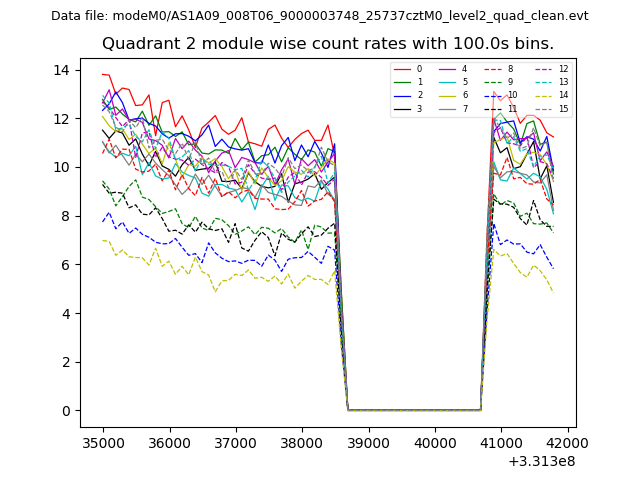
| Module-wise count rates for Quadrant C Data is divided into 100 sec bins |
 |
 |
| Module-wise count rates for Quadrant D Data is divided into 100 sec bins |
 |
 |
| Parameter | Plot |
|---|---|
| CZT HV Monitor | 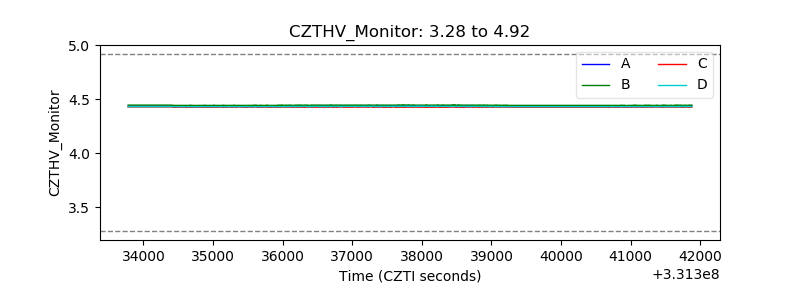 |
| D_VDD | 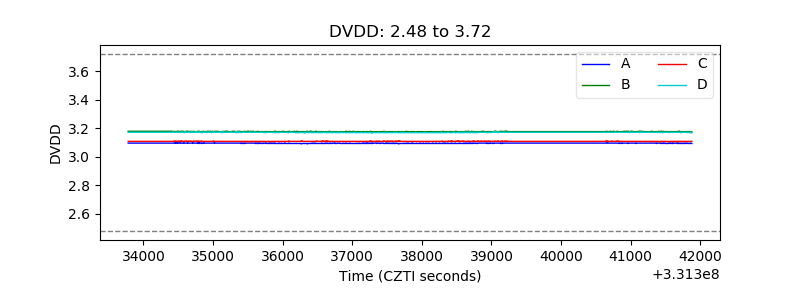 |
| Temperature 1 | 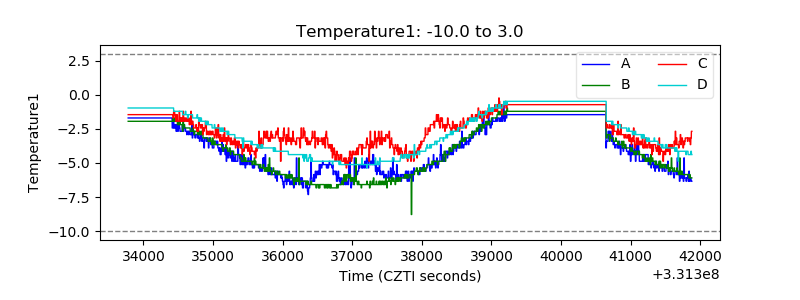 |
| Veto HV Monitor | 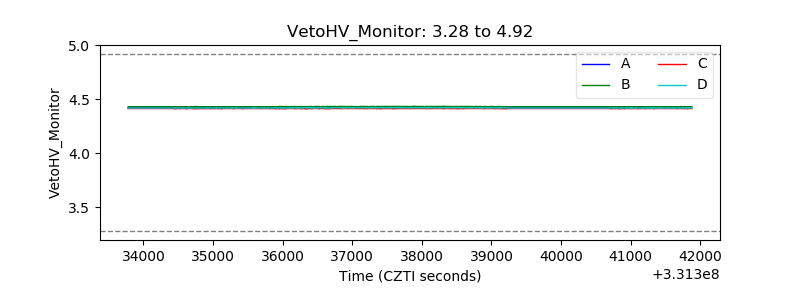 |
| Veto LLD | 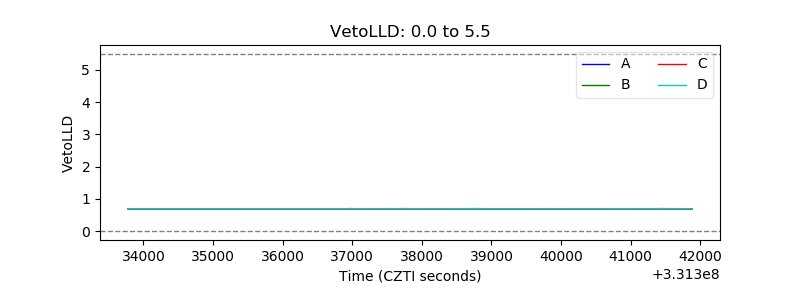 |
| Alpha Counter | 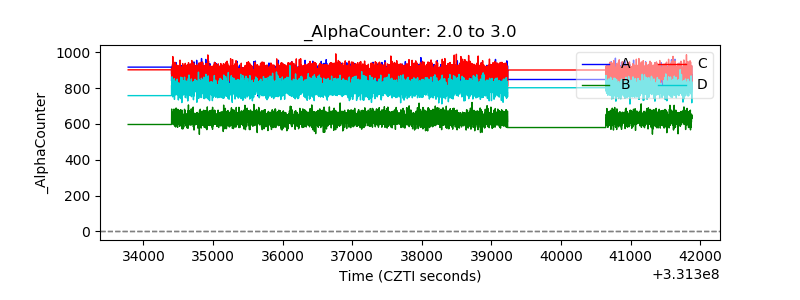 |
| _CPM_Rate | 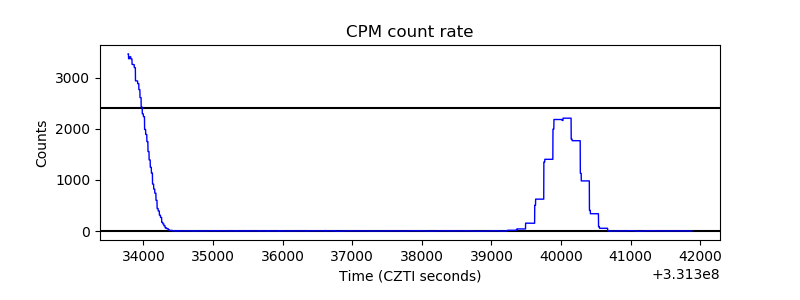 |
| CZT Counter | 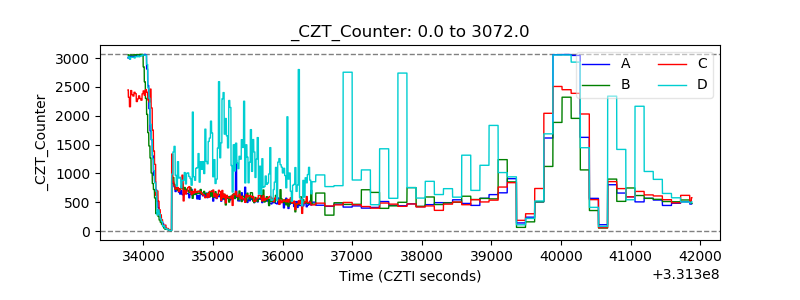 |
| +2.5 Volts monitor |  |
| +5 Volts monitor | 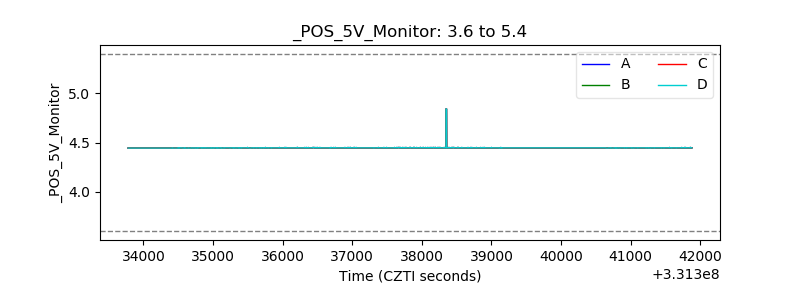 |
| _ROLL_ROT | 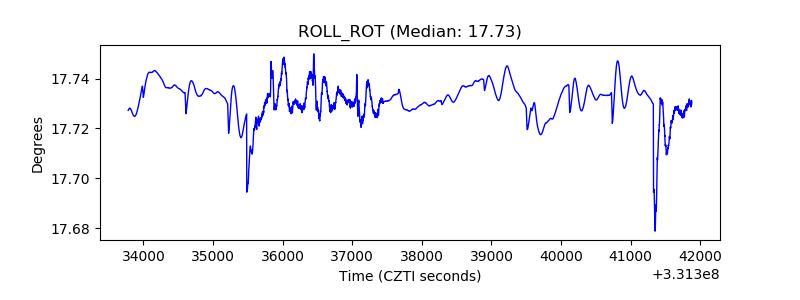 |
| _Roll_DEC | 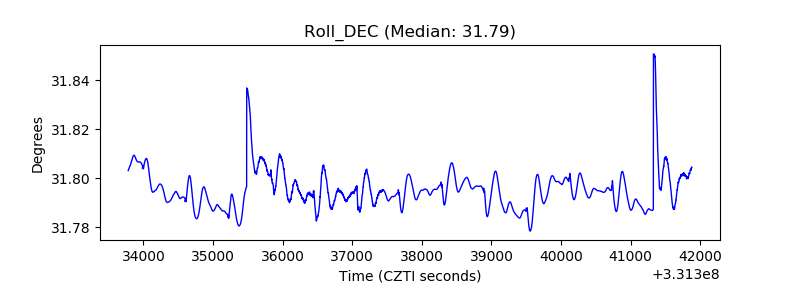 |
| _Roll_RA | 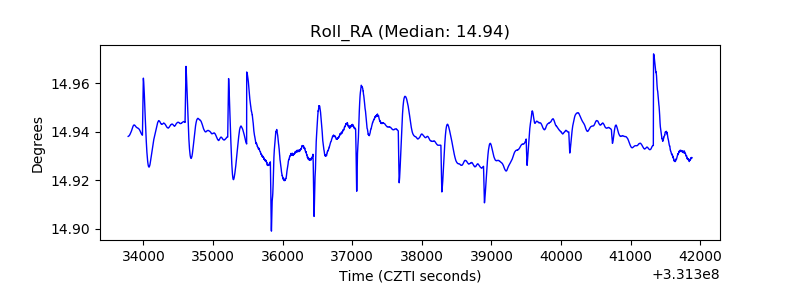 |
| Veto Counter | 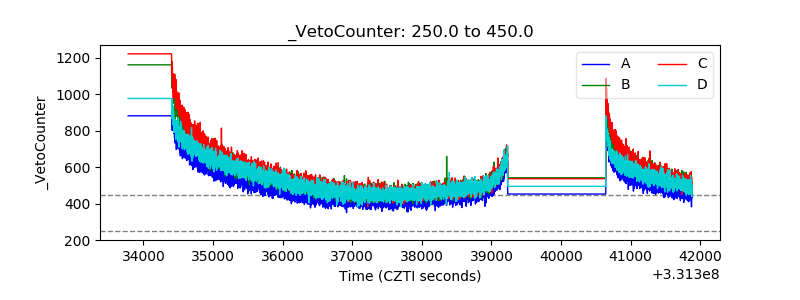 |