| Param | Original file | Final file |
|---|---|---|
| Filename | modeM0/AS1A09_008T06_9000003748_25738cztM0_level2.evt | modeM0/AS1A09_008T06_9000003748_25738cztM0_level2_quad_clean.evt |
| Size (bytes) | 435,384,000 | 90,607,680 |
| Size | 415.2 MB | 86.4 MB |
| Events in quadrant A | 2,817,762 | 591,176 |
| Events in quadrant B | 2,987,355 | 611,865 |
| Events in quadrant C | 2,938,340 | 589,657 |
| Events in quadrant D | 4,067,987 | 565,927 |
| Mode M0 | |||
|---|---|---|---|
| Quadrant | BADHDUFLAG | Total packets | Discarded packets |
| A | 0 | 11896 | 0 |
| B | 0 | 12480 | 0 |
| C | 0 | 12350 | 0 |
| D | 0 | 15803 | 0 |
| Mode M9 | |||
|---|---|---|---|
| Quadrant | BADHDUFLAG | Total packets | Discarded packets |
| A | 0 | 19 | 0 |
| B | 0 | 20 | 0 |
| C | 0 | 20 | 0 |
| D | 0 | 20 | 0 |
| Quadrant | Total seconds | Saturated seconds | Saturation percentage |
|---|---|---|---|
| A | 5502 | 43 | 0.781534% |
| B | 5502 | 88 | 1.599418% |
| C | 5502 | 116 | 2.108324% |
| D | 5502 | 284 | 5.161759% |
Noise dominated data is calculated using 1-second bins in cleaned event files. If a bin has >2000 counts, and if more than 50% of those come from <1% of pixels, then it is considered to be noise-dominated and hence unusable.
| Quadrant | # 1 sec bins | Bins with >0 counts | Bins with >2000 counts | High rate bins dominated by noise | Noise dominated (total time) | Noise dominated (detector-on time) | Marked lightcurve |
|---|---|---|---|---|---|---|---|
| A | 6657 | 5503 | 0 | 0 | 0.00% | 0.00% | 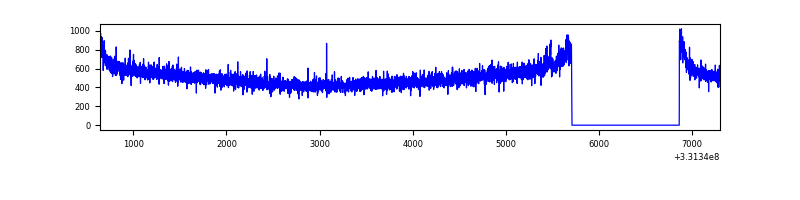 |
| B | 6657 | 5503 | 1 | 1 | 0.02% | 0.02% | 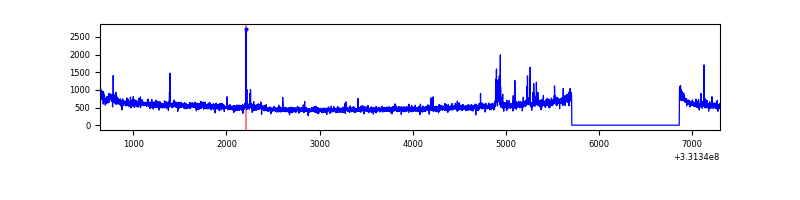 |
| C | 6657 | 5503 | 0 | 0 | 0.00% | 0.00% | 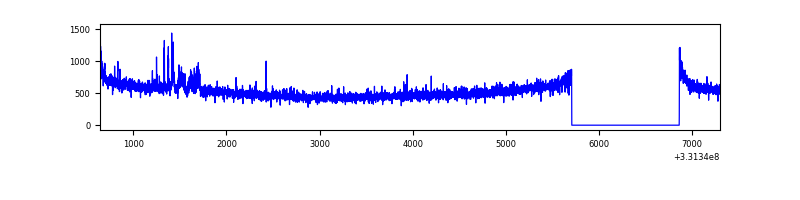 |
| D | 6657 | 5503 | 208 | 208 | 3.12% | 3.78% | 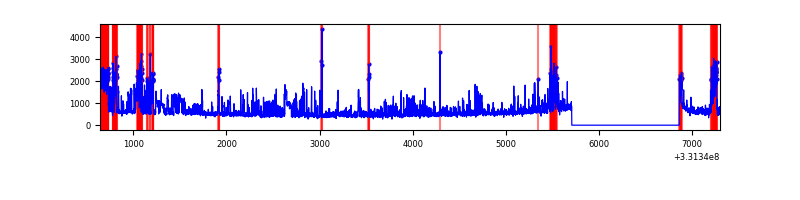 |
Top three noisy pixels from each quadrant. If the there are fewer than three noisy pixels in the level2.evt file, extra rows are filled as -1
| Pixel properties | Quadrant properties | ||||||
|---|---|---|---|---|---|---|---|
| Quadrant | DetID | PixID | Counts | Sigma | Mean | Median | Sigma |
| A | 6 | 16 | 26153 | 175.67 | 723 | 710 | 144.8 |
| A | 13 | 254 | 8887 | 56.46 | 723 | 710 | 144.8 |
| A | 3 | 137 | 6372 | 39.09 | 723 | 710 | 144.8 |
| B | 3 | 112 | 37455 | 267.24 | 727 | 710 | 137.5 |
| B | 4 | 171 | 35797 | 255.18 | 727 | 710 | 137.5 |
| B | 0 | 190 | 33606 | 239.25 | 727 | 710 | 137.5 |
| C | 14 | 238 | 113756 | 693.39 | 705 | 712 | 163.0 |
| C | 3 | 233 | 68955 | 418.59 | 705 | 712 | 163.0 |
| C | 0 | 10 | 5313 | 28.22 | 705 | 712 | 163.0 |
| D | 1 | 52 | 1089145 | 5899.56 | 690 | 676 | 184.5 |
| D | 7 | 80 | 264541 | 1430.16 | 690 | 676 | 184.5 |
| D | 13 | 104 | 50858 | 271.99 | 690 | 676 | 184.5 |
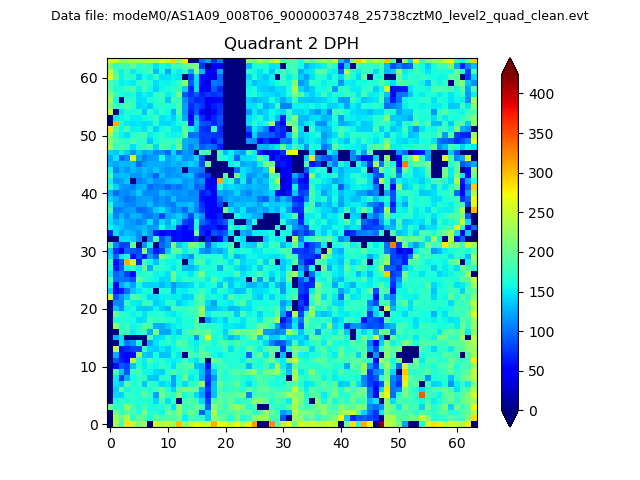
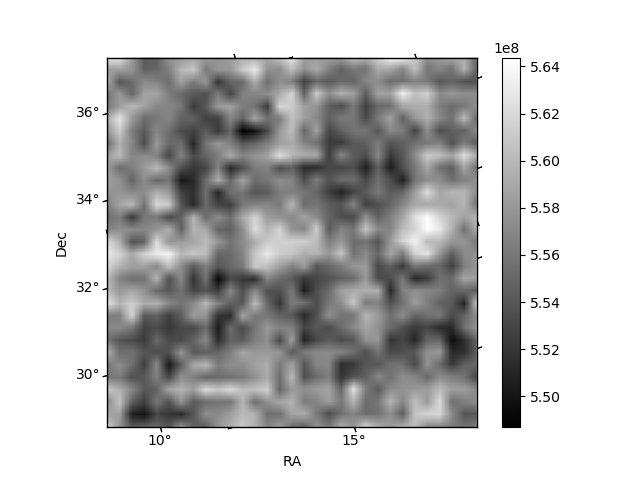
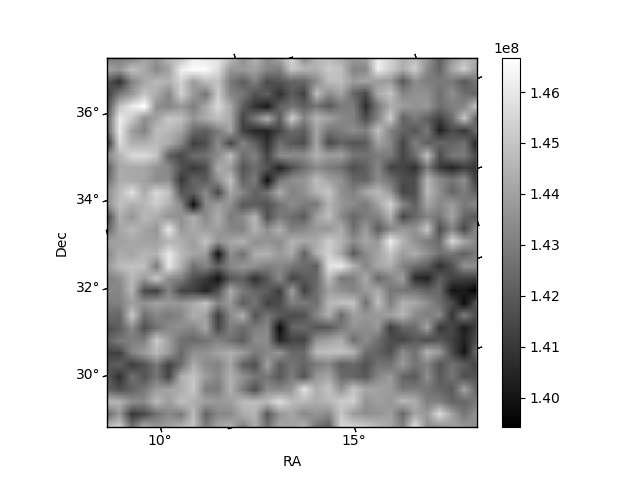
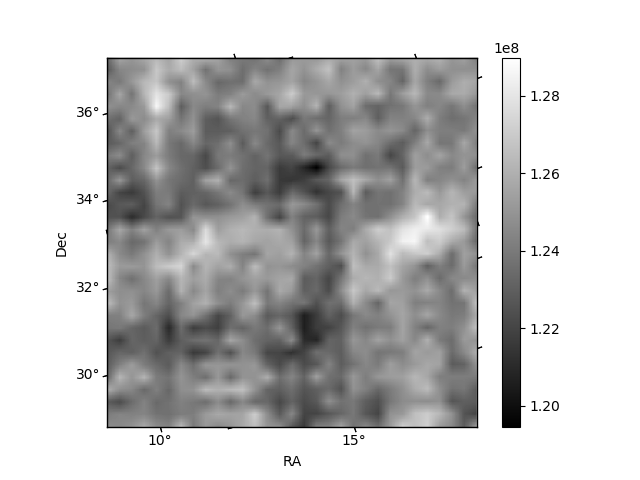
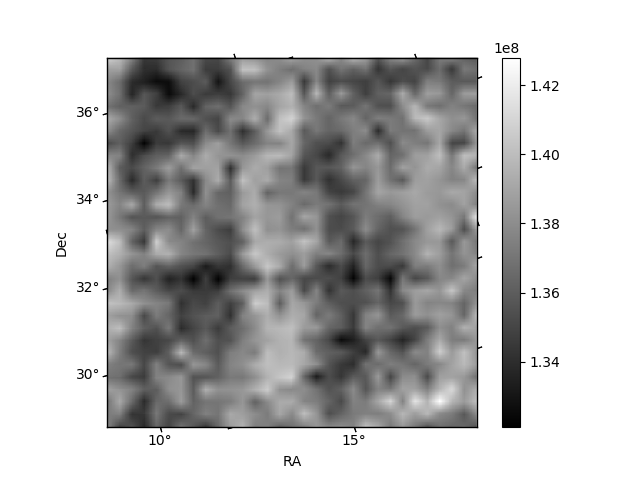
Histogram calculated using DETX and DETY for each event in the final _common_clean file
| Quadrant A | 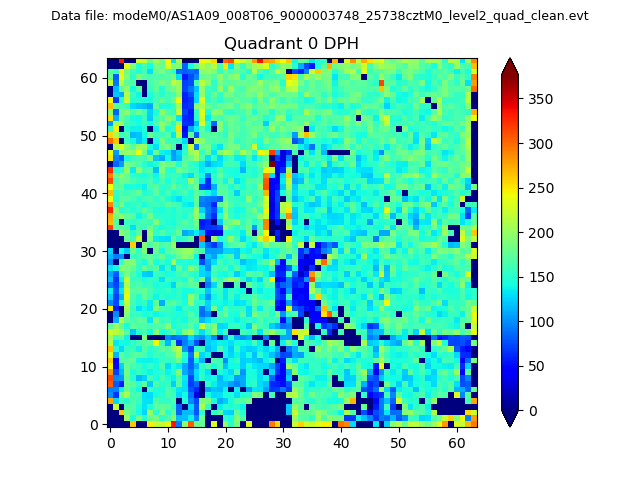 |
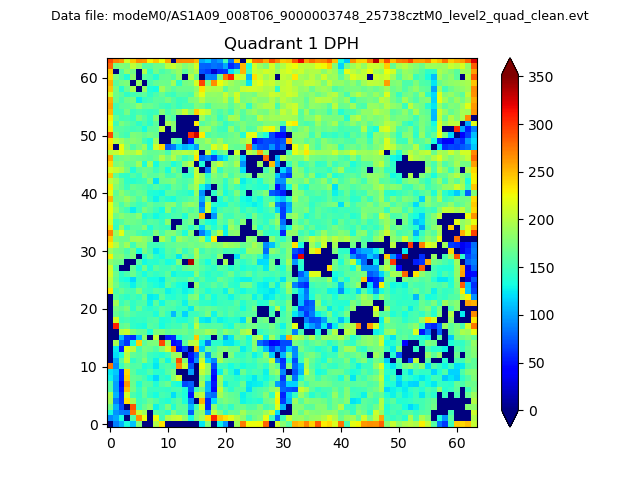 |
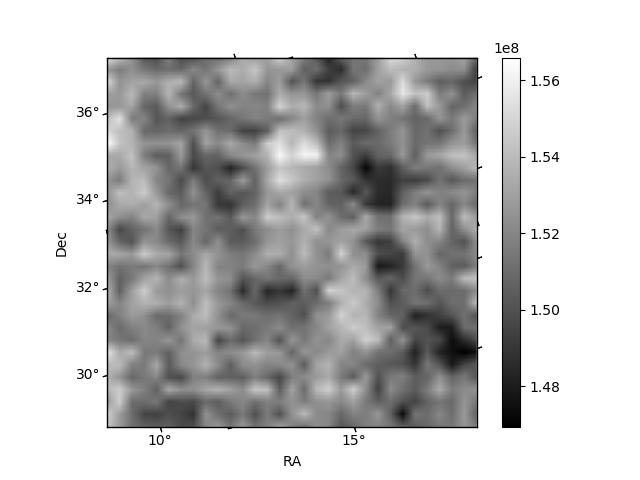
Quadrant B |
|---|---|---|---|
| Quadrant D | 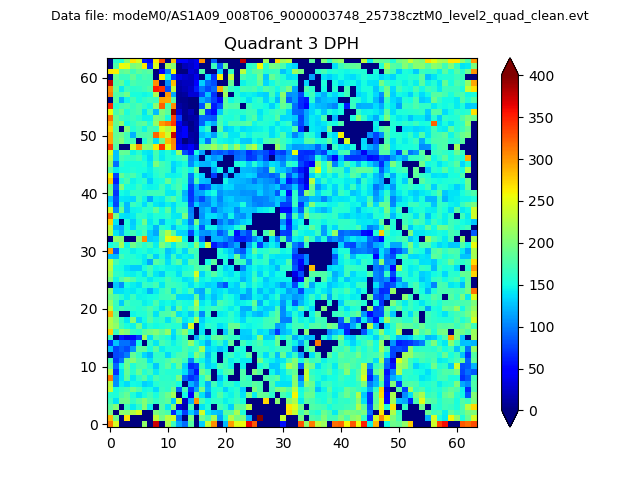 |
 |
Quadrant C |
| Plot type | Count rate plots | Images |
|---|---|---|
| Comparison with Poisson distribution Blue bars denote a histogram of data divided into 1 sec bins. Red curve is a Poisson curve with rate = median count rate of data. |
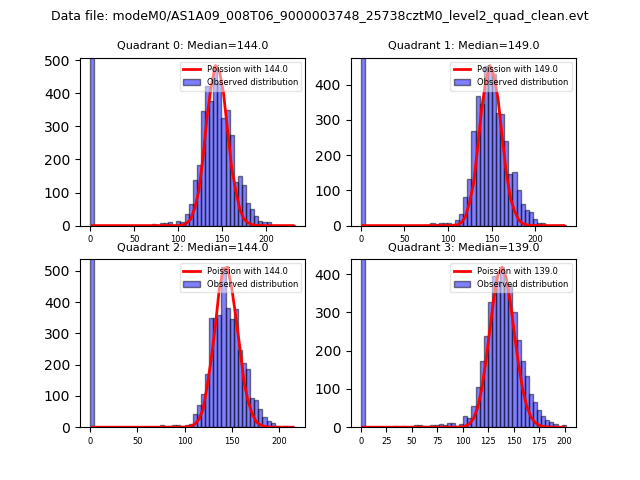 |
 |
| Quadrant-wise count rates Data is divided into 100 sec bins |
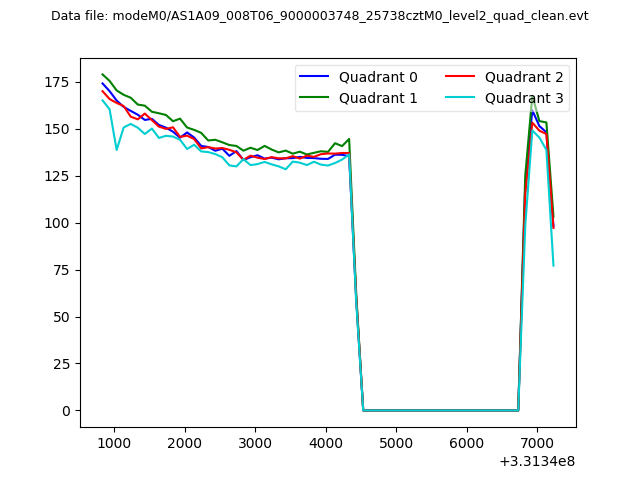 |
|
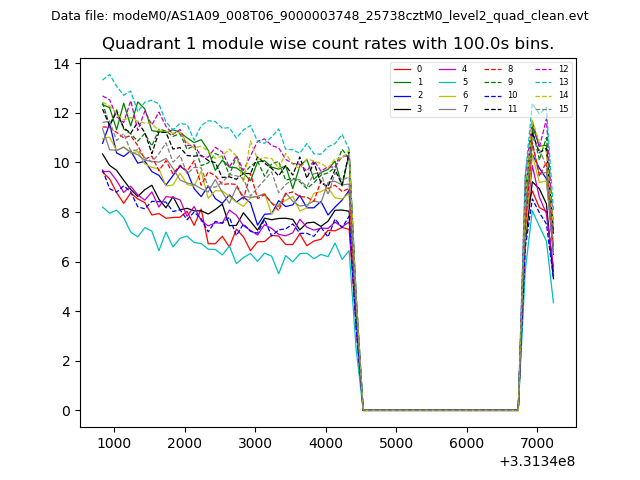
| Module-wise count rates for Quadrant A Data is divided into 100 sec bins |
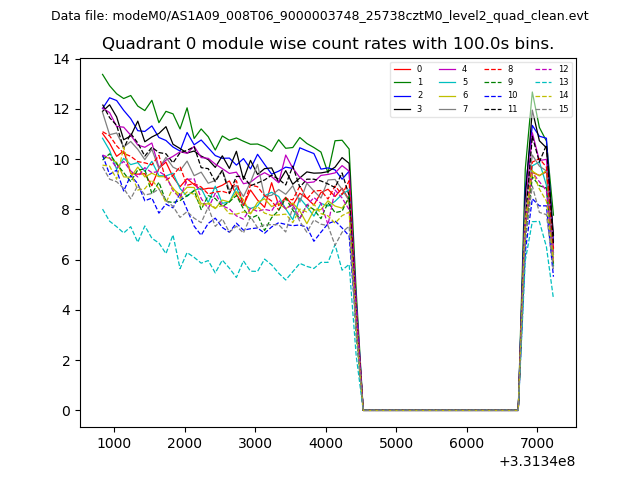 |
 |
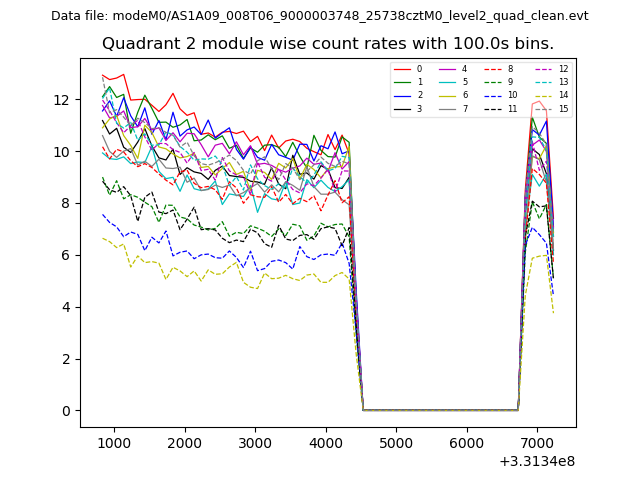
| Module-wise count rates for Quadrant B Data is divided into 100 sec bins |
 |
 |
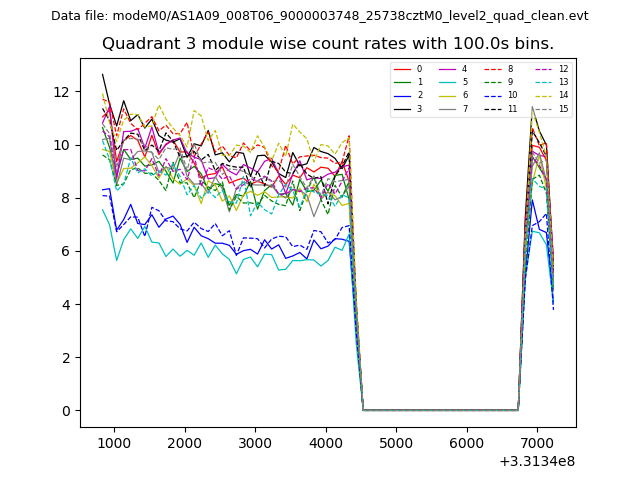
| Module-wise count rates for Quadrant C Data is divided into 100 sec bins |
 |
 |
| Module-wise count rates for Quadrant D Data is divided into 100 sec bins |
 |
 |
| Parameter | Plot |
|---|---|
| CZT HV Monitor | 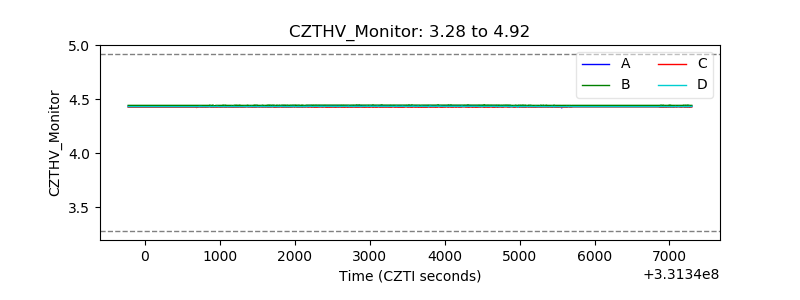 |
| D_VDD | 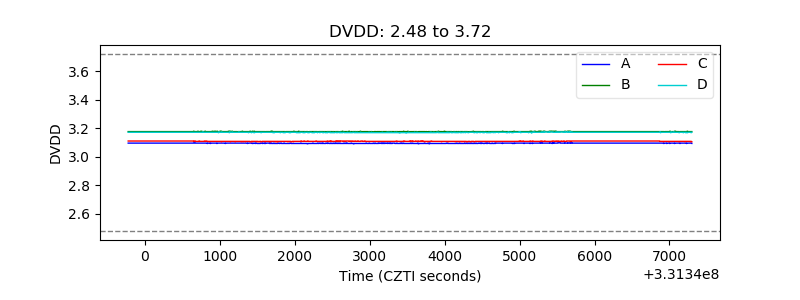 |
| Temperature 1 | 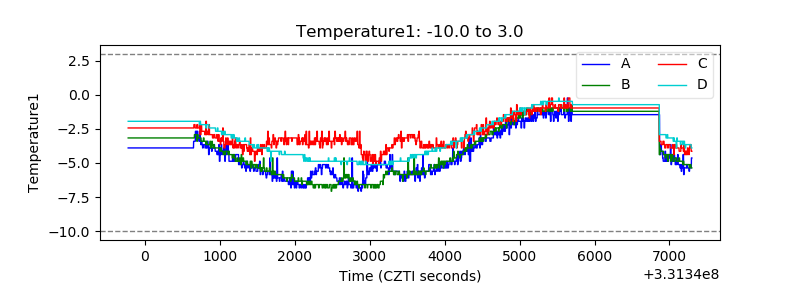 |
| Veto HV Monitor | 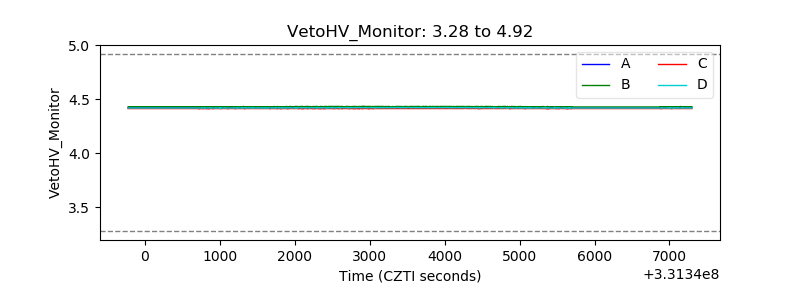 |
| Veto LLD | 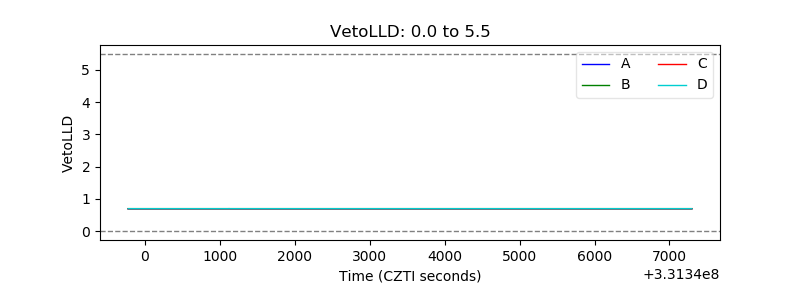 |
| Alpha Counter | 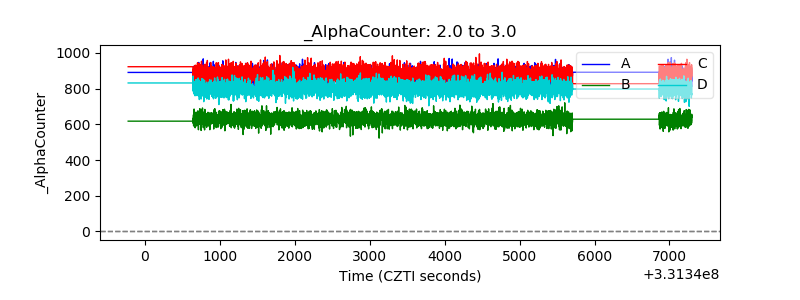 |
| _CPM_Rate | 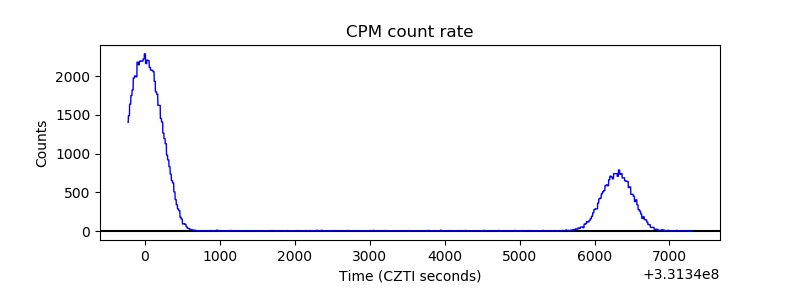 |
| CZT Counter | 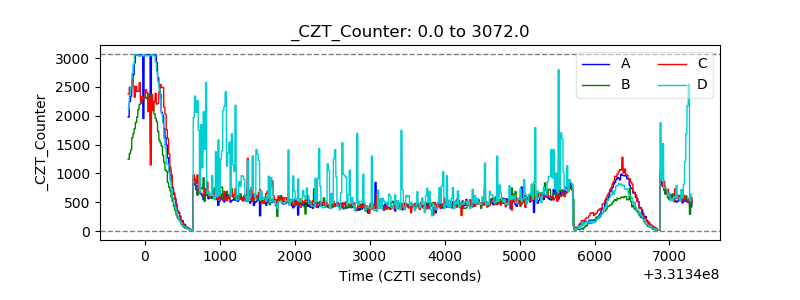 |
| +2.5 Volts monitor |  |
| +5 Volts monitor |  |
| _ROLL_ROT | 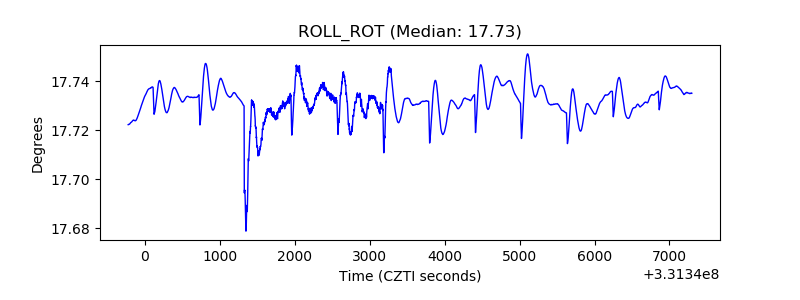 |
| _Roll_DEC | 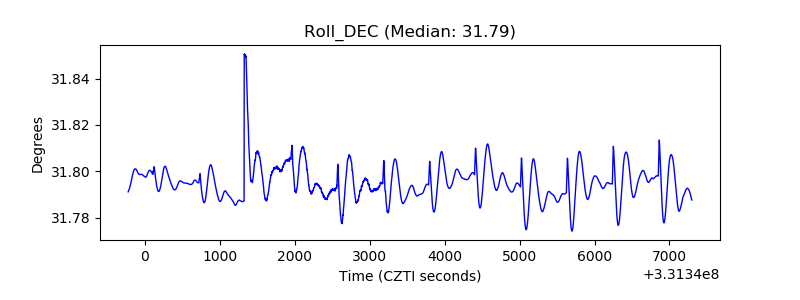 |
| _Roll_RA | 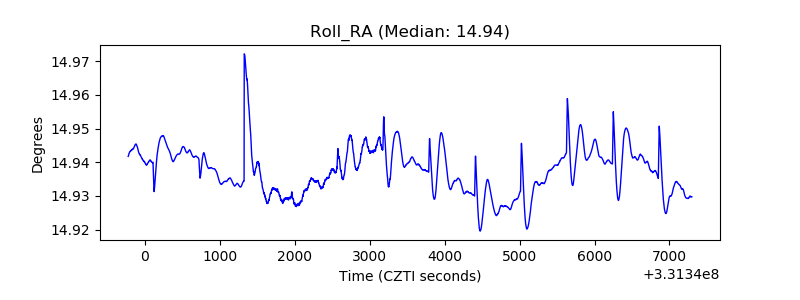 |
| Veto Counter | 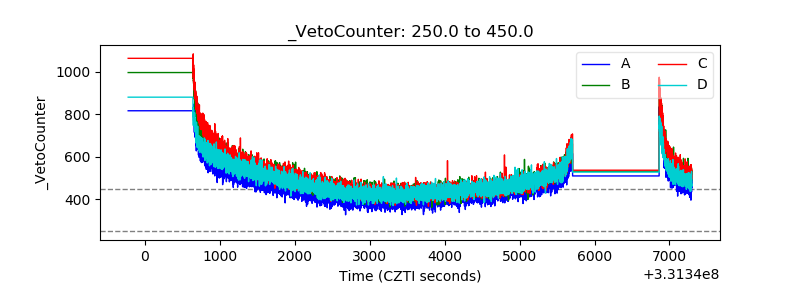 |