| Param | Original file | Final file |
|---|---|---|
| Filename | modeM0/AS1A09_008T06_9000003748_25741cztM0_level2.evt | modeM0/AS1A09_008T06_9000003748_25741cztM0_level2_quad_clean.evt |
| Size (bytes) | 40,930,560 | 10,056,960 |
| Size | 39.0 MB | 9.6 MB |
| Events in quadrant A | 259,906 | 67,754 |
| Events in quadrant B | 273,003 | 70,359 |
| Events in quadrant C | 270,487 | 66,158 |
| Events in quadrant D | 402,646 | 60,818 |
| Mode M0 | |||
|---|---|---|---|
| Quadrant | BADHDUFLAG | Total packets | Discarded packets |
| A | 0 | 1026 | 0 |
| B | 0 | 1089 | 0 |
| C | 0 | 1087 | 0 |
| D | 0 | 1498 | 0 |
| Mode M9 | |||
|---|---|---|---|
| Quadrant | BADHDUFLAG | Total packets | Discarded packets |
| A | 0 | 1 | 0 |
| B | 0 | 2 | 0 |
| C | 0 | 2 | 0 |
| D | 0 | 2 | 0 |
| Quadrant | Total seconds | Saturated seconds | Saturation percentage |
|---|---|---|---|
| A | 437 | 9 | 2.059497% |
| B | 437 | 19 | 4.347826% |
| C | 437 | 26 | 5.949657% |
| D | 437 | 61 | 13.958810% |
Noise dominated data is calculated using 1-second bins in cleaned event files. If a bin has >2000 counts, and if more than 50% of those come from <1% of pixels, then it is considered to be noise-dominated and hence unusable.
| Quadrant | # 1 sec bins | Bins with >0 counts | Bins with >2000 counts | High rate bins dominated by noise | Noise dominated (total time) | Noise dominated (detector-on time) | Marked lightcurve |
|---|---|---|---|---|---|---|---|
| A | 437 | 437 | 0 | 0 | 0.00% | 0.00% | 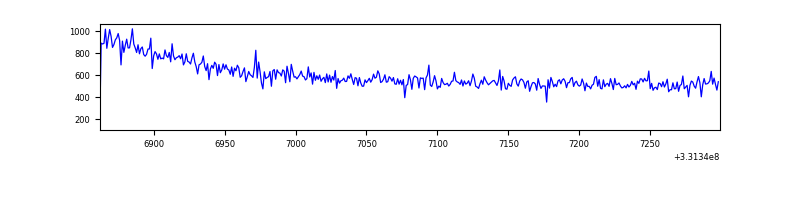 |
| B | 437 | 437 | 0 | 0 | 0.00% | 0.00% | 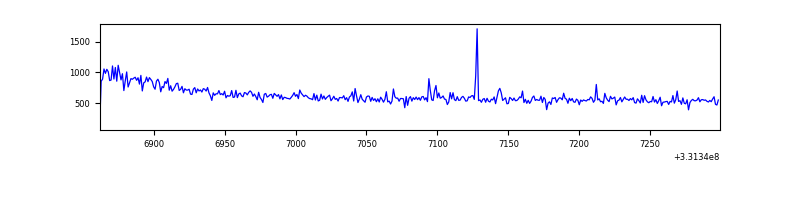 |
| C | 437 | 437 | 0 | 0 | 0.00% | 0.00% | 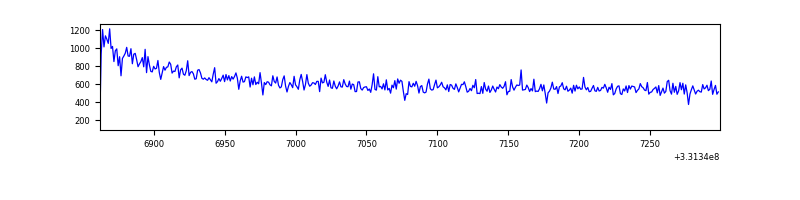 |
| D | 437 | 437 | 40 | 40 | 9.15% | 9.15% | 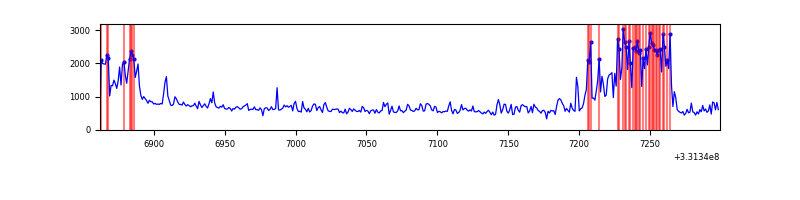 |
Top three noisy pixels from each quadrant. If the there are fewer than three noisy pixels in the level2.evt file, extra rows are filled as -1
| Pixel properties | Quadrant properties | ||||||
|---|---|---|---|---|---|---|---|
| Quadrant | DetID | PixID | Counts | Sigma | Mean | Median | Sigma |
| A | 13 | 254 | 805 | 47.28 | 67 | 65 | 15.7 |
| A | 3 | 137 | 584 | 33.16 | 67 | 65 | 15.7 |
| A | 0 | 226 | 562 | 31.75 | 67 | 65 | 15.7 |
| B | 0 | 219 | 1981 | 125.55 | 68 | 66 | 15.3 |
| B | 15 | 36 | 1642 | 103.32 | 68 | 66 | 15.3 |
| B | 12 | 111 | 1520 | 95.33 | 68 | 66 | 15.3 |
| C | 14 | 238 | 10487 | 591.71 | 65 | 66 | 17.6 |
| C | 3 | 233 | 1819 | 99.54 | 65 | 66 | 17.6 |
| C | 0 | 10 | 819 | 42.76 | 65 | 66 | 17.6 |
| D | 7 | 80 | 122641 | 6836.71 | 63 | 60 | 17.9 |
| D | 1 | 52 | 40219 | 2239.79 | 63 | 60 | 17.9 |
| D | 2 | 234 | 1433 | 76.58 | 63 | 60 | 17.9 |
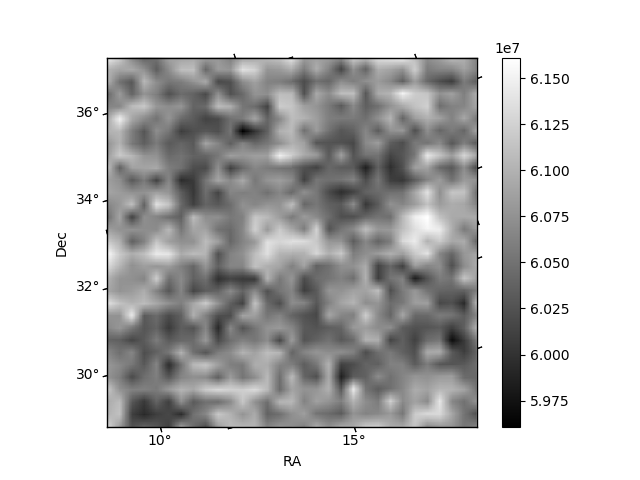
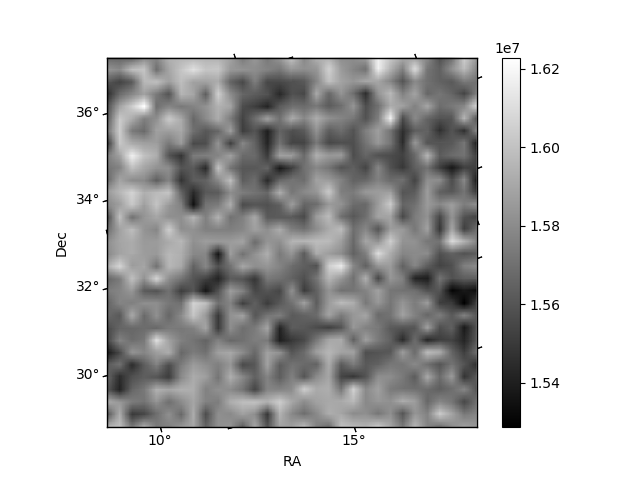
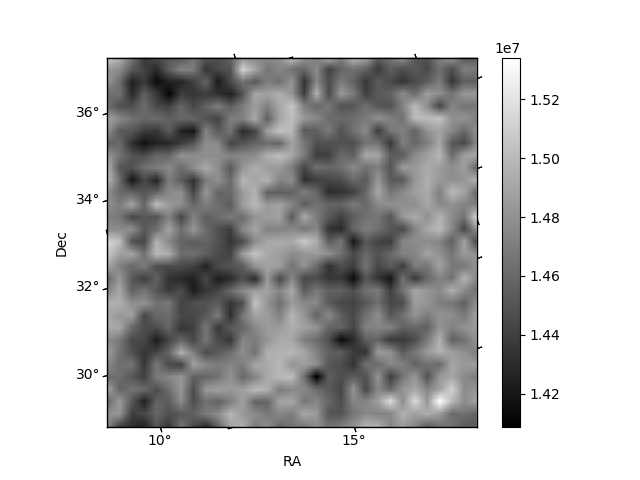
Histogram calculated using DETX and DETY for each event in the final _common_clean file
| Quadrant A | 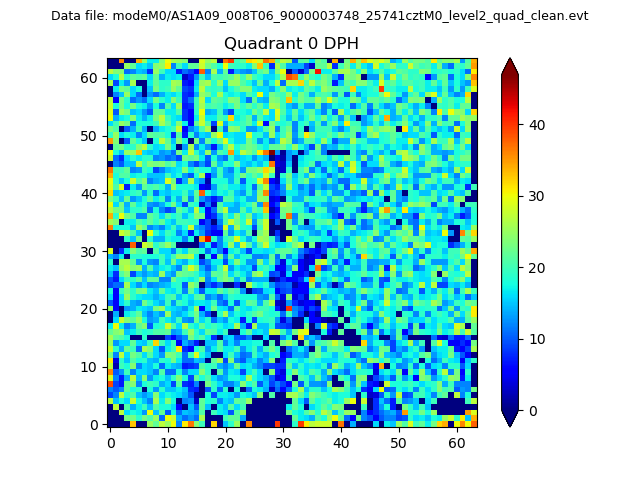 |
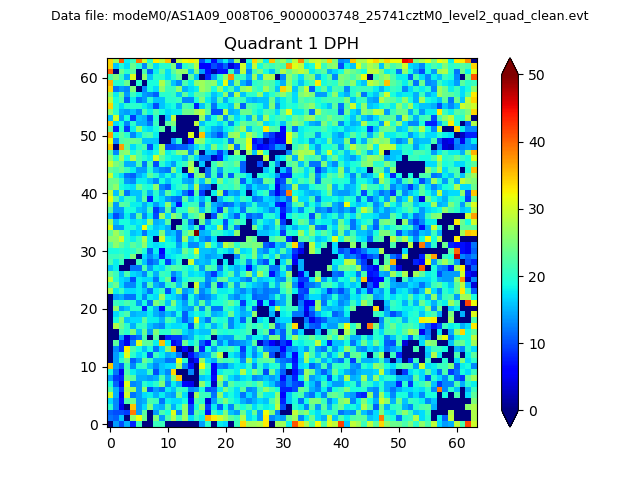 |
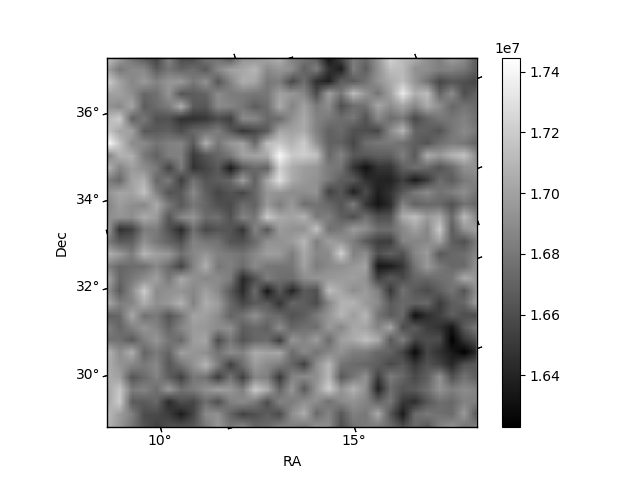
Quadrant B |
|---|---|---|---|
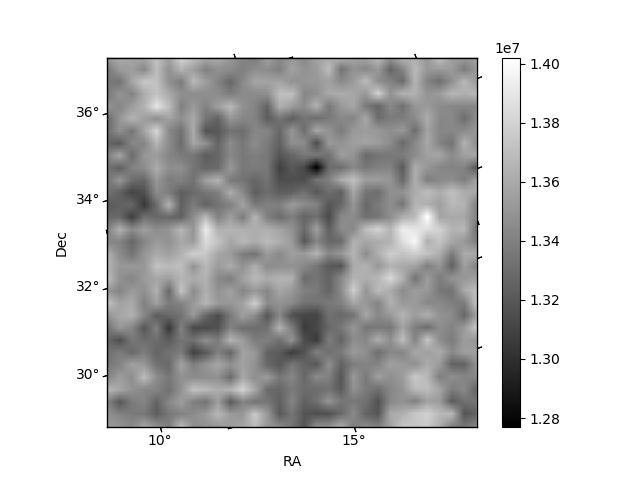
| Quadrant D | 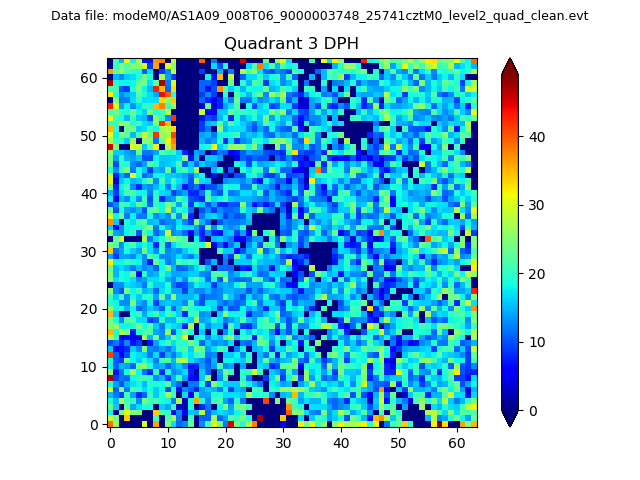 |
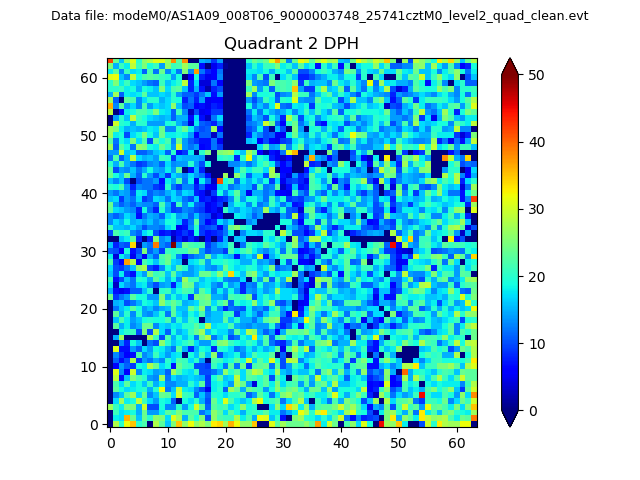 |
Quadrant C |
| Plot type | Count rate plots | Images |
|---|---|---|
| Comparison with Poisson distribution Blue bars denote a histogram of data divided into 1 sec bins. Red curve is a Poisson curve with rate = median count rate of data. |
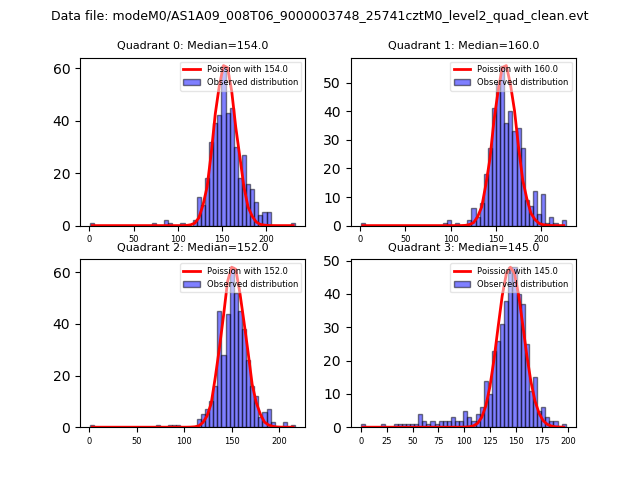 |
 |
| Quadrant-wise count rates Data is divided into 100 sec bins |
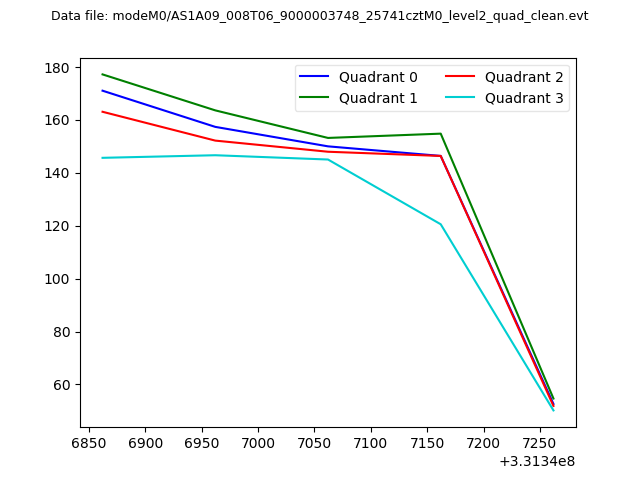 |
|
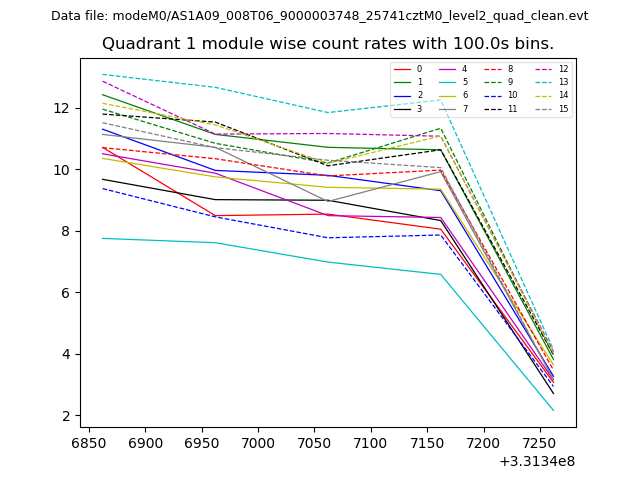
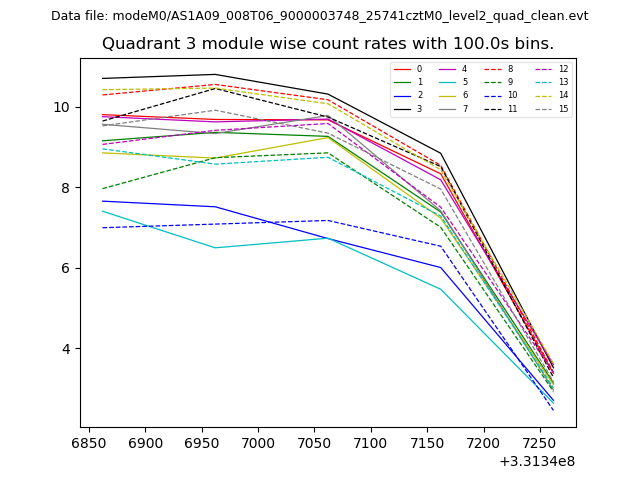
| Module-wise count rates for Quadrant A Data is divided into 100 sec bins |
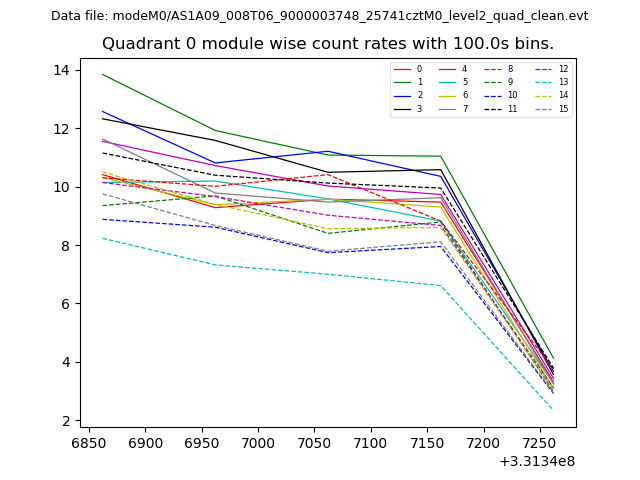 |
 |
| Module-wise count rates for Quadrant B Data is divided into 100 sec bins |
 |
 |
| Module-wise count rates for Quadrant C Data is divided into 100 sec bins |
 |
 |
| Module-wise count rates for Quadrant D Data is divided into 100 sec bins |
 |
 |
| Parameter | Plot |
|---|---|
| CZT HV Monitor | 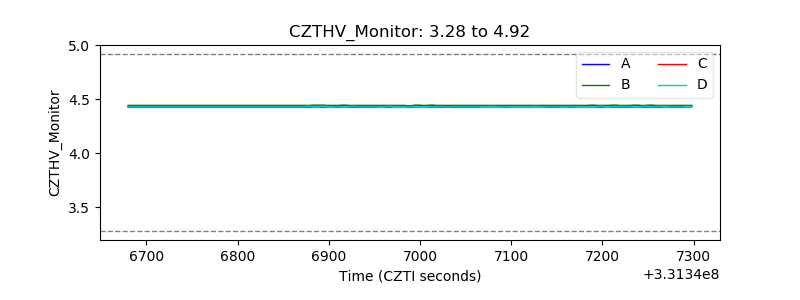 |
| D_VDD | 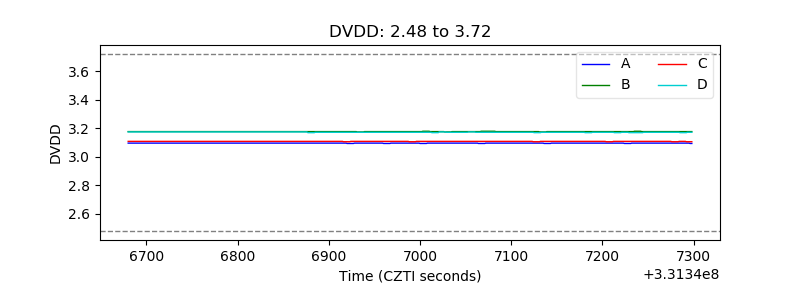 |
| Temperature 1 | 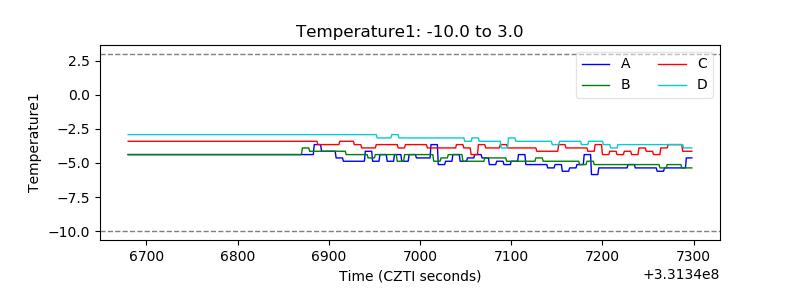 |
| Veto HV Monitor | 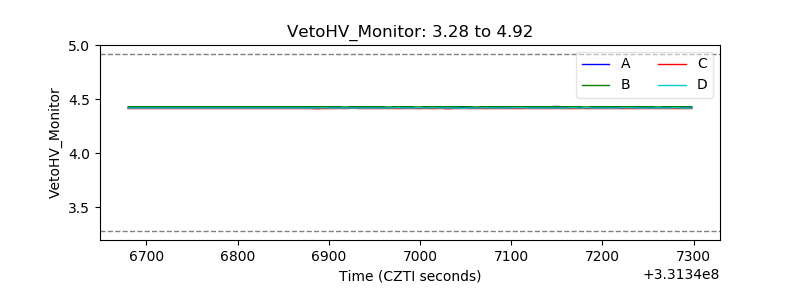 |
| Veto LLD | 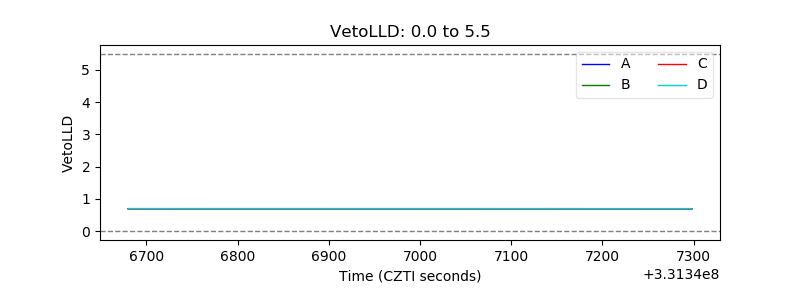 |
| Alpha Counter | 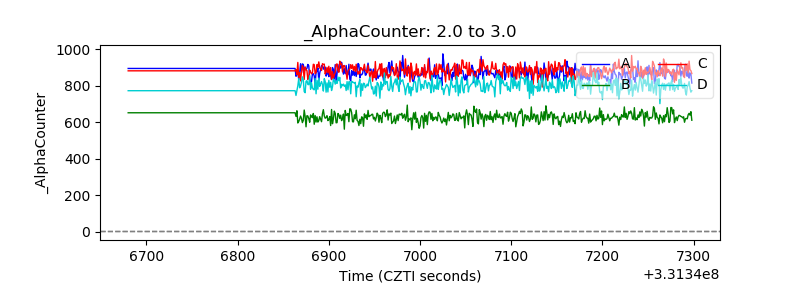 |
| _CPM_Rate | 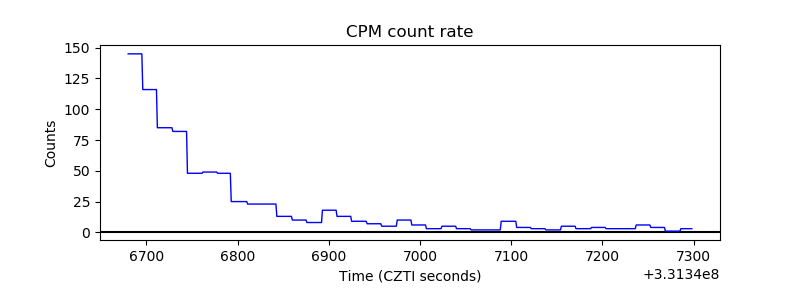 |
| CZT Counter | 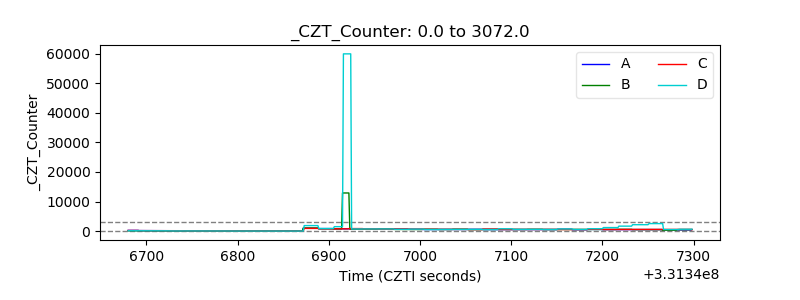 |
| +2.5 Volts monitor |  |
| +5 Volts monitor |  |
| _ROLL_ROT | 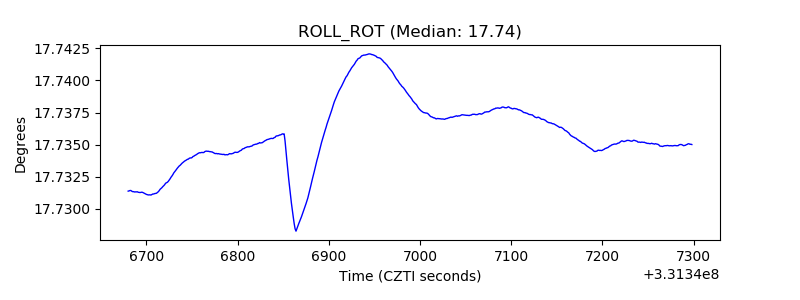 |
| _Roll_DEC | 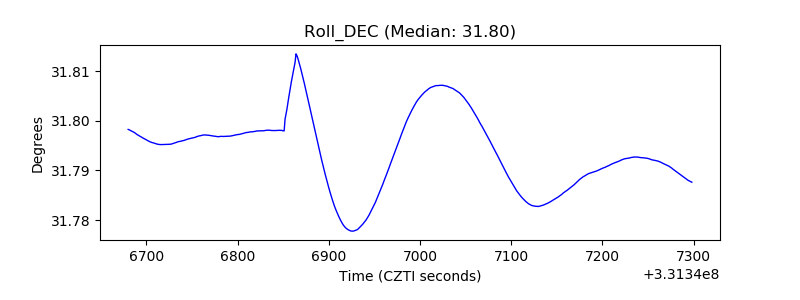 |
| _Roll_RA | 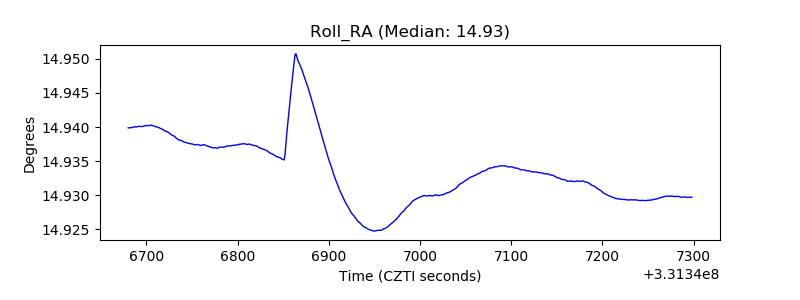 |
| Veto Counter | 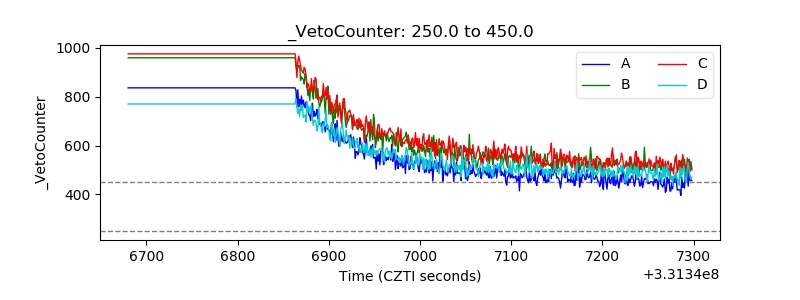 |