| Param | Original file | Final file |
|---|---|---|
| Filename | modeM0/AS1A09_033T01_9000003750cztM0_level2.fits | modeM0/AS1A09_033T01_9000003750cztM0_level2_quad_clean.evt |
| Size (bytes) | 768,479,040 | 606,954,240 |
| Size | 732.9 MB | 578.8 MB |
| Events in quadrant A | 4,758,506 | 3,462,901 |
| Events in quadrant B | 4,575,998 | 3,464,293 |
| Events in quadrant C | 4,679,710 | 3,266,130 |
| Events in quadrant D | 4,113,722 | 3,040,773 |
| Mode SS | |||
|---|---|---|---|
| Quadrant | BADHDUFLAG | Total packets | Discarded packets |
| A | 0 | 1528 | 0 |
| B | 0 | 1532 | 0 |
| C | 0 | 1526 | 0 |
| D | 0 | 1528 | 0 |
| Mode M0 | |||
|---|---|---|---|
| Quadrant | BADHDUFLAG | Total packets | Discarded packets |
| A | 0 | 156757 | 0 |
| B | 0 | 162088 | 0 |
| C | 0 | 159962 | 0 |
| D | 0 | 171864 | 0 |
| Mode M9 | |||
|---|---|---|---|
| Quadrant | BADHDUFLAG | Total packets | Discarded packets |
| A | 0 | 119 | 0 |
| B | 0 | 121 | 0 |
| C | 0 | 121 | 0 |
| D | 0 | 119 | 0 |
| Quadrant | Total seconds | Saturated seconds | Saturation percentage |
|---|---|---|---|
| A | 75026 | 973 | 1.296884% |
| B | 75038 | 1303 | 1.736454% |
| C | 75066 | 1453 | 1.935630% |
| D | 75032 | 1397 | 1.861872% |
Noise dominated data is calculated using 1-second bins in cleaned event files. If a bin has >2000 counts, and if more than 50% of those come from <1% of pixels, then it is considered to be noise-dominated and hence unusable.
| Quadrant | # 1 sec bins | Bins with >0 counts | Bins with >2000 counts | High rate bins dominated by noise | Noise dominated (total time) | Noise dominated (detector-on time) | Marked lightcurve |
|---|---|---|---|---|---|---|---|
| A | 88859 | 75196 | 0 | 0 | 0.00% | 0.00% | 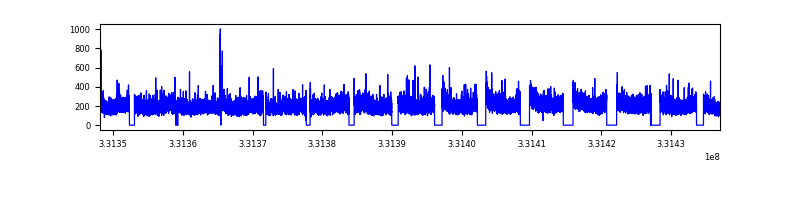 |
| B | 88859 | 75206 | 0 | 0 | 0.00% | 0.00% | 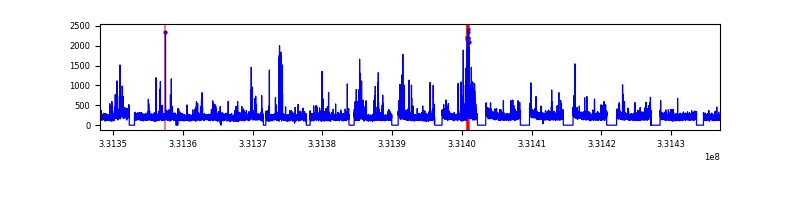 |
| C | 88859 | 75224 | 0 | 0 | 0.00% | 0.00% | 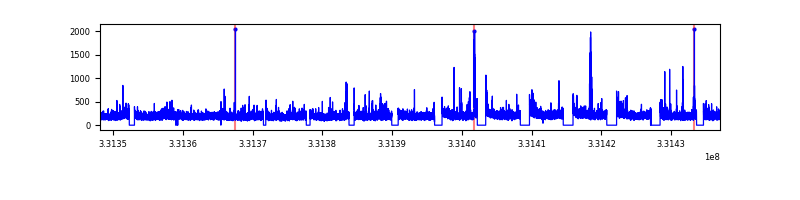 |
| D | 88859 | 75179 | 0 | 0 | 0.00% | 0.00% | 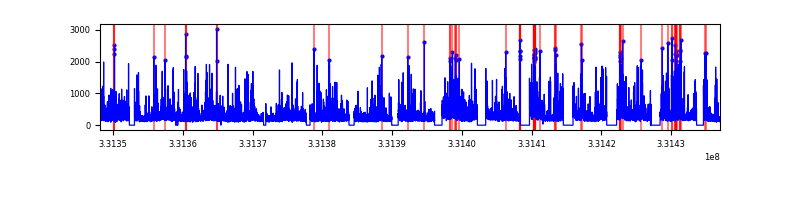 |
Top three noisy pixels from each quadrant. If the there are fewer than three noisy pixels in the level2.evt file, extra rows are filled as -1
| Pixel properties | Quadrant properties | ||||||
|---|---|---|---|---|---|---|---|
| Quadrant | DetID | PixID | Counts | Sigma | Mean | Median | Sigma |
| A | 0 | 29 | 3850 | 8.8 | 1240 | 1167 | 304.9 |
| A | 7 | 110 | 3720 | 8.37 | 1240 | 1167 | 304.9 |
| A | 9 | 19 | 3586 | 7.93 | 1240 | 1167 | 304.9 |
| B | 2 | 9 | 3625 | 10.32 | 1209 | 1152 | 239.6 |
| B | 2 | 8 | 3067 | 7.99 | 1209 | 1152 | 239.6 |
| B | 5 | 128 | 2976 | 7.61 | 1209 | 1152 | 239.6 |
| C | 1 | 81 | 3539 | 7.62 | 1236 | 1160 | 312.1 |
| C | 1 | 80 | 3537 | 7.62 | 1236 | 1160 | 312.1 |
| C | 12 | 241 | 3186 | 6.49 | 1236 | 1160 | 312.1 |
| D | 3 | 14 | 2980 | 6.15 | 1174 | 1071 | 310.5 |
| D | 10 | 189 | 2948 | 6.05 | 1174 | 1071 | 310.5 |
| D | 6 | 231 | 2876 | 5.81 | 1174 | 1071 | 310.5 |
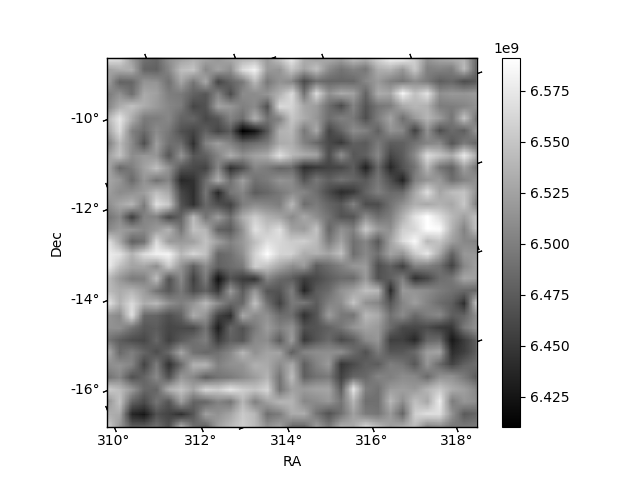
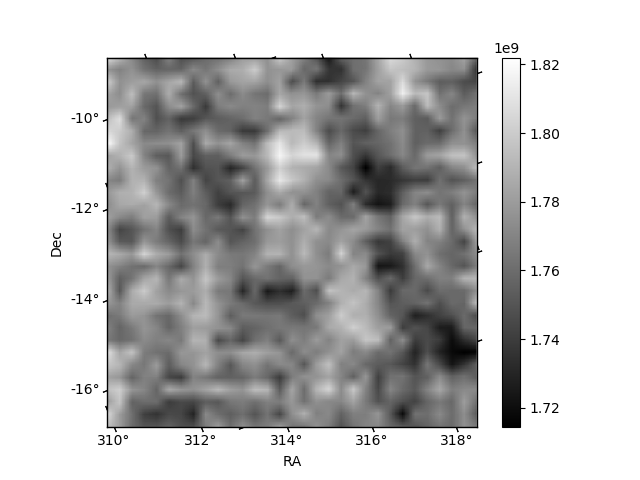
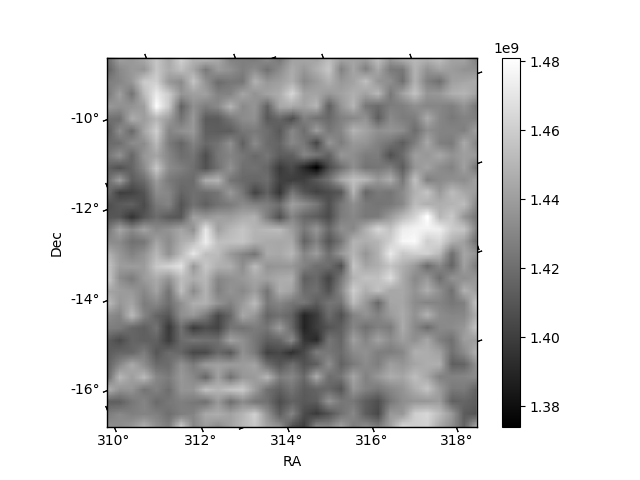
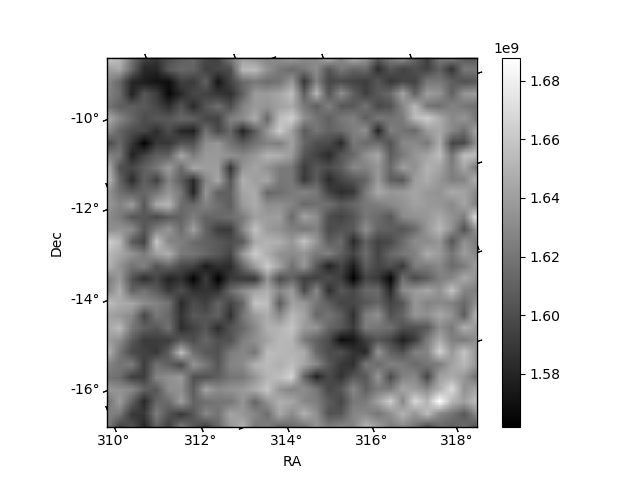
Histogram calculated using DETX and DETY for each event in the final _common_clean file
| Quadrant A | 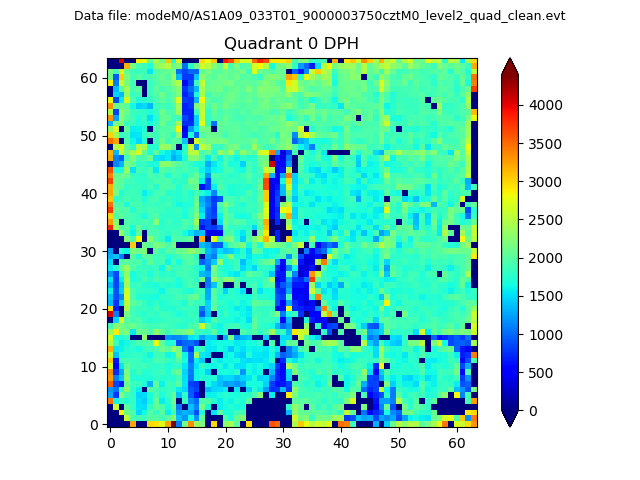 |
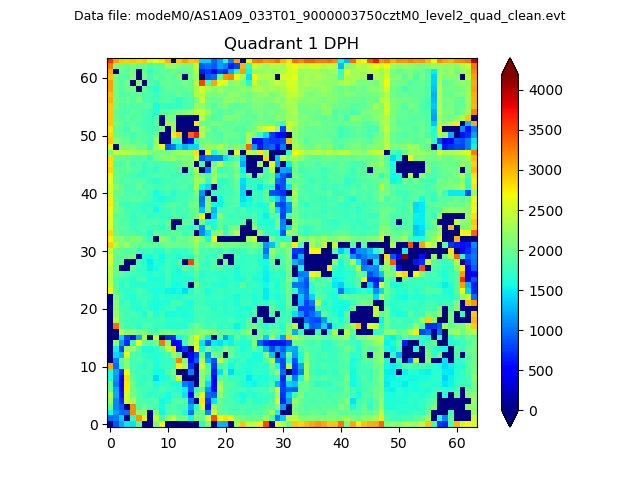 |
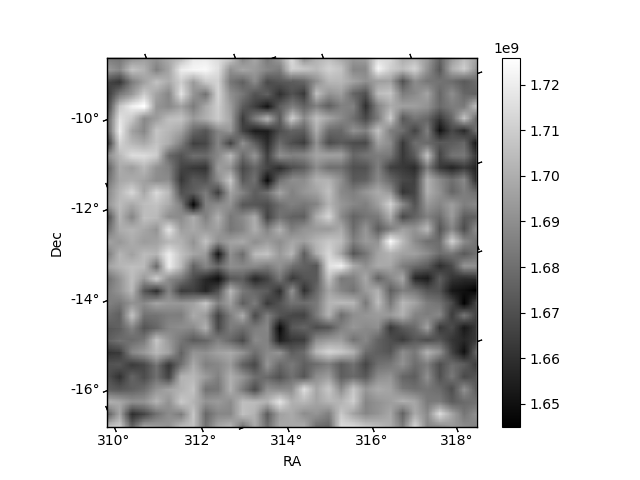
Quadrant B |
|---|---|---|---|
| Quadrant D | 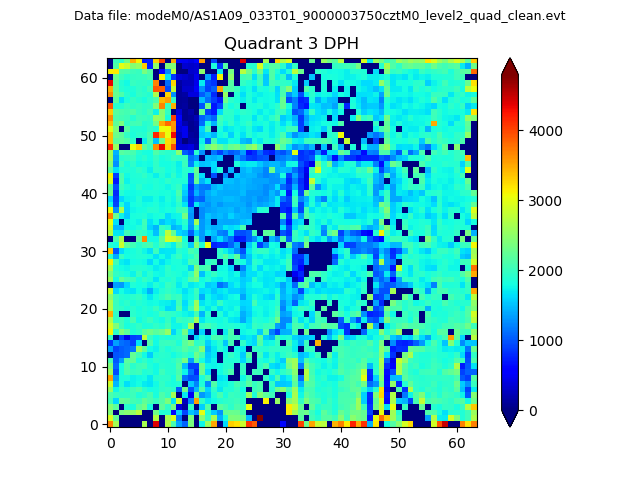 |
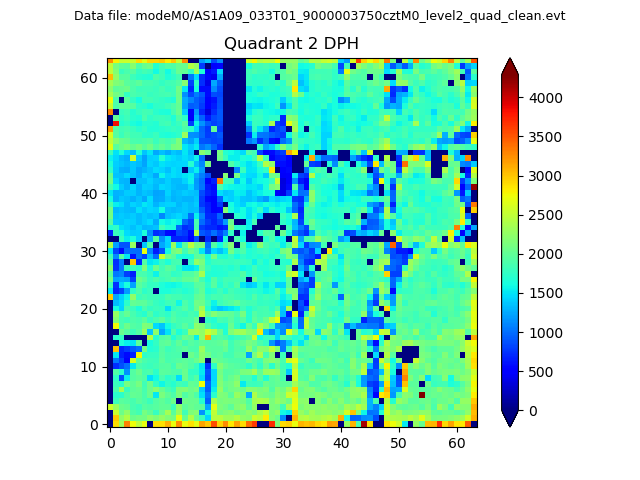 |
Quadrant C |
| Plot type | Count rate plots | Images |
|---|---|---|
| Comparison with Poisson distribution Blue bars denote a histogram of data divided into 1 sec bins. Red curve is a Poisson curve with rate = median count rate of data. |
 |
 |
| Quadrant-wise count rates Data is divided into 100 sec bins |
 |
|
| Module-wise count rates for Quadrant A Data is divided into 100 sec bins |
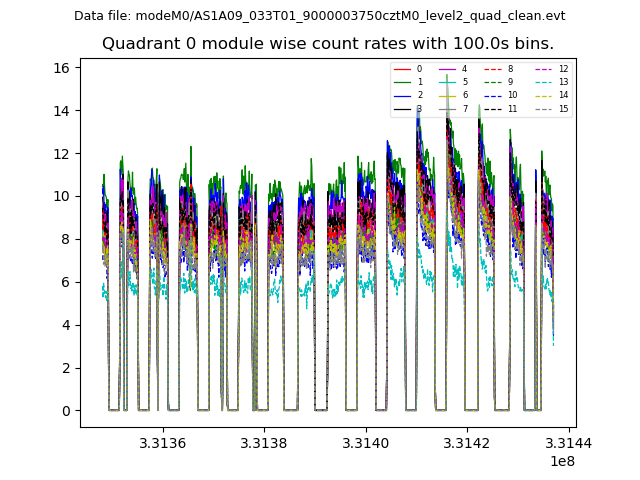 |
 |
| Module-wise count rates for Quadrant B Data is divided into 100 sec bins |
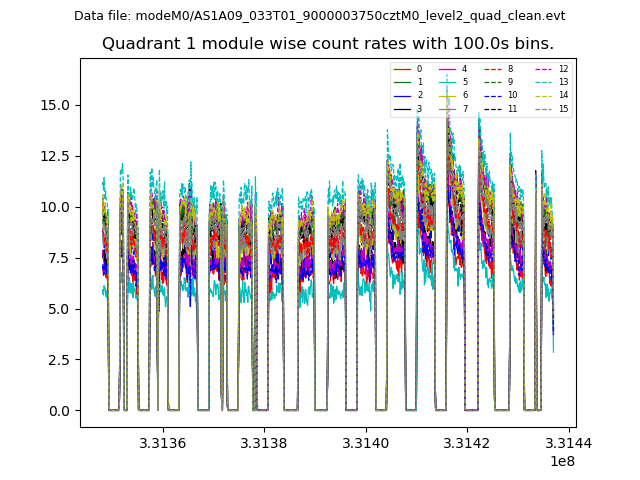 |
 |
| Module-wise count rates for Quadrant C Data is divided into 100 sec bins |
 |
 |
| Module-wise count rates for Quadrant D Data is divided into 100 sec bins |
 |
 |
| Parameter | Plot |
|---|---|
| CZT HV Monitor | 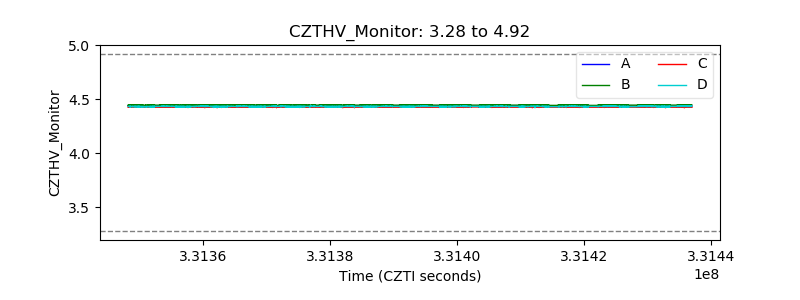 |
| D_VDD | 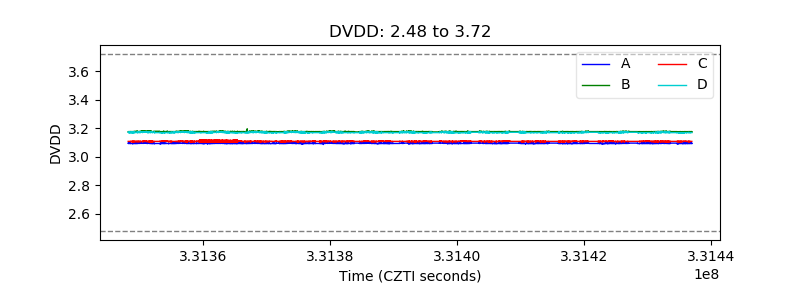 |
| Temperature 1 | 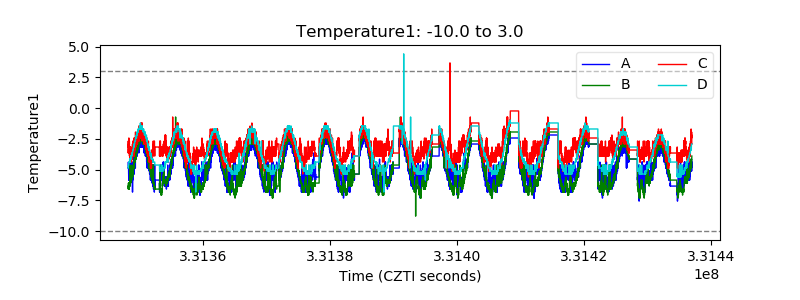 |
| Veto HV Monitor | 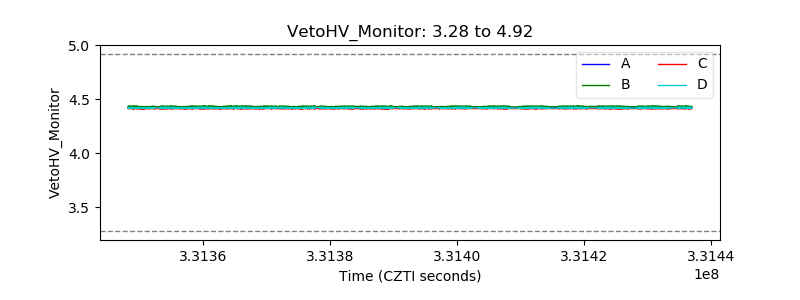 |
| Veto LLD | 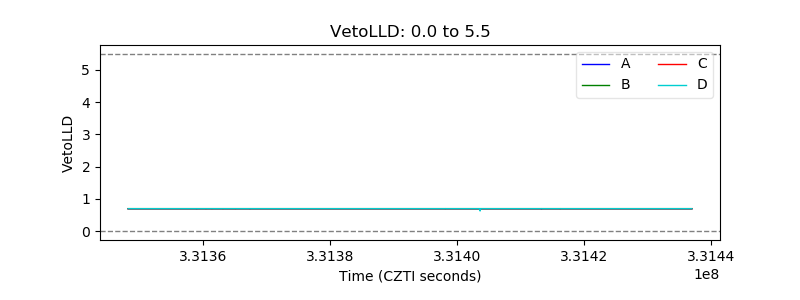 |
| Alpha Counter | 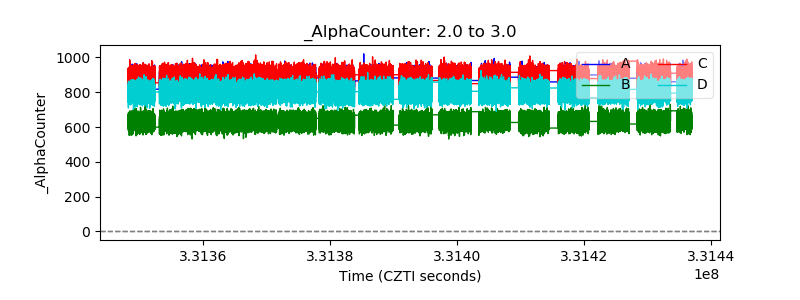 |
| _CPM_Rate | 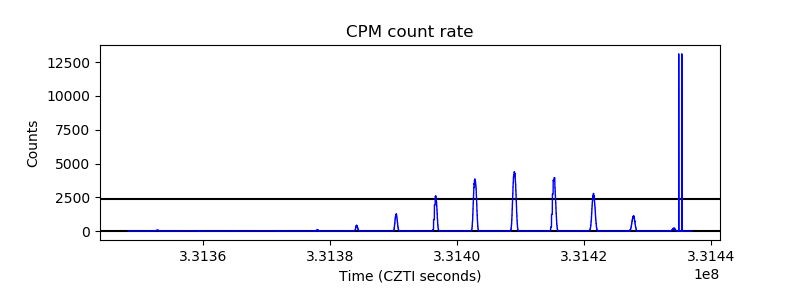 |
| CZT Counter | 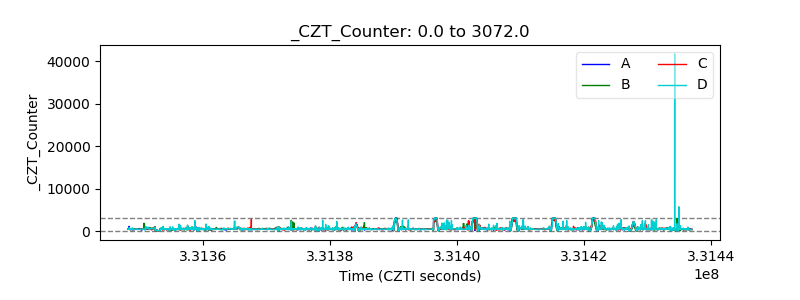 |
| +2.5 Volts monitor | 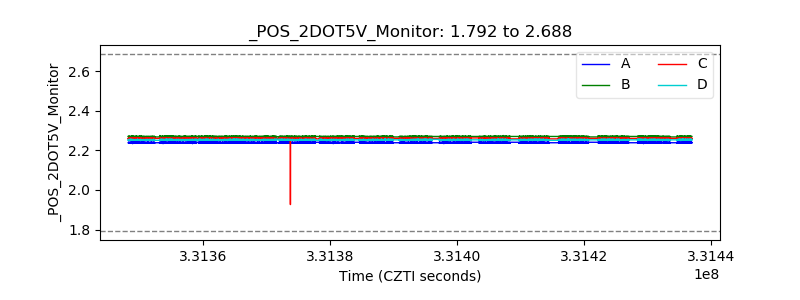 |
| +5 Volts monitor | 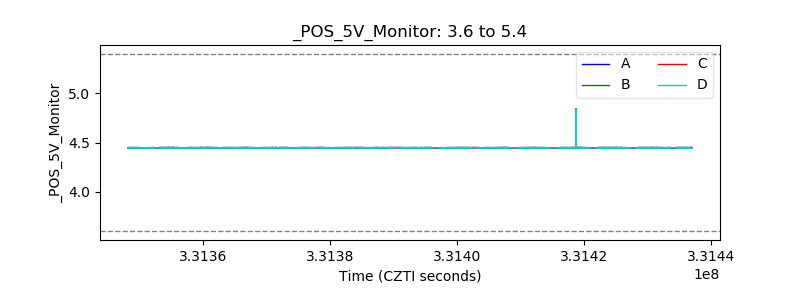 |
| _ROLL_ROT | 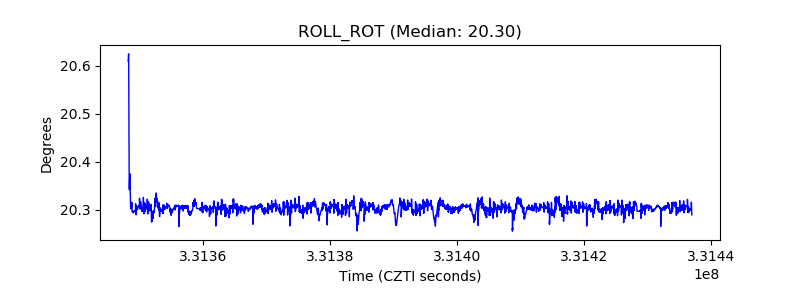 |
| _Roll_DEC | 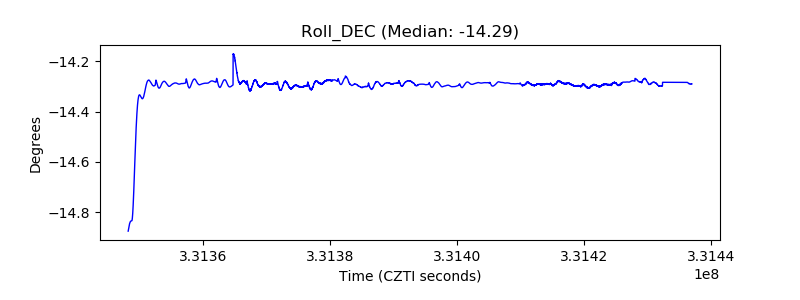 |
| _Roll_RA | 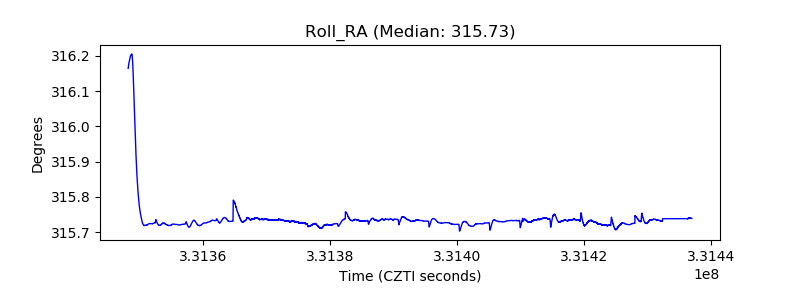 |
| Veto Counter | 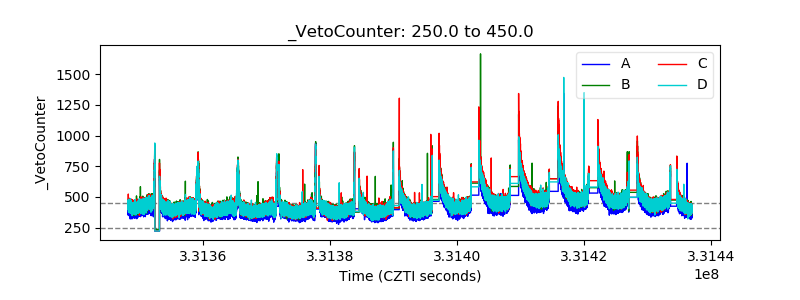 |