| Param | Original file | Final file |
|---|---|---|
| Filename | modeM0/AS1A09_033T01_9000003750_25740cztM0_level2.evt | modeM0/AS1A09_033T01_9000003750_25740cztM0_level2_quad_clean.evt |
| Size (bytes) | 517,230,720 | 110,424,960 |
| Size | 493.3 MB | 105.3 MB |
| Events in quadrant A | 3,638,723 | 708,505 |
| Events in quadrant B | 3,757,957 | 725,910 |
| Events in quadrant C | 3,736,034 | 694,675 |
| Events in quadrant D | 4,012,239 | 683,156 |
| Mode M0 | |||
|---|---|---|---|
| Quadrant | BADHDUFLAG | Total packets | Discarded packets |
| A | 0 | 15696 | 0 |
| B | 0 | 15843 | 0 |
| C | 0 | 15818 | 0 |
| D | 0 | 16806 | 0 |
| Mode M9 | |||
|---|---|---|---|
| Quadrant | BADHDUFLAG | Total packets | Discarded packets |
| A | 0 | 2 | 0 |
| B | 0 | 2 | 0 |
| C | 0 | 2 | 0 |
| D | 0 | 2 | 0 |
| Quadrant | Total seconds | Saturated seconds | Saturation percentage |
|---|---|---|---|
| A | 7641 | 183 | 2.394974% |
| B | 7641 | 179 | 2.342625% |
| C | 7641 | 189 | 2.473498% |
| D | 7641 | 180 | 2.355713% |
Noise dominated data is calculated using 1-second bins in cleaned event files. If a bin has >2000 counts, and if more than 50% of those come from <1% of pixels, then it is considered to be noise-dominated and hence unusable.
| Quadrant | # 1 sec bins | Bins with >0 counts | Bins with >2000 counts | High rate bins dominated by noise | Noise dominated (total time) | Noise dominated (detector-on time) | Marked lightcurve |
|---|---|---|---|---|---|---|---|
| A | 7856 | 7641 | 0 | 0 | 0.00% | 0.00% | 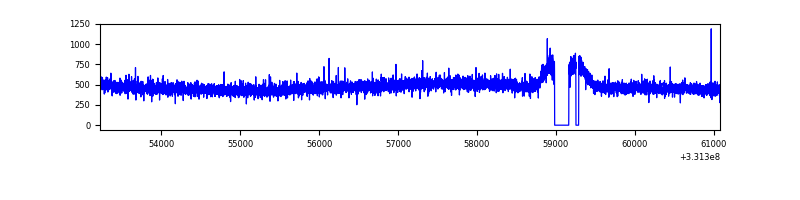 |
| B | 7856 | 7641 | 1 | 1 | 0.01% | 0.01% | 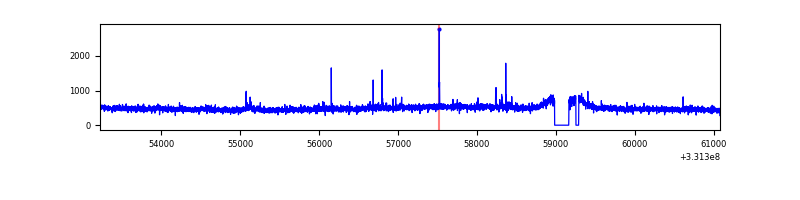 |
| C | 7856 | 7643 | 0 | 0 | 0.00% | 0.00% | 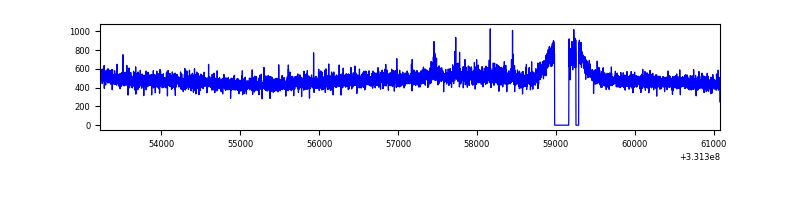 |
| D | 7856 | 7642 | 21 | 21 | 0.27% | 0.27% | 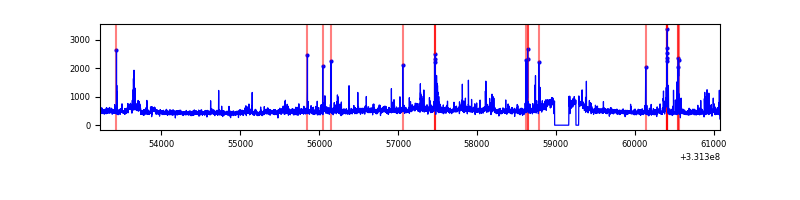 |
Top three noisy pixels from each quadrant. If the there are fewer than three noisy pixels in the level2.evt file, extra rows are filled as -1
| Pixel properties | Quadrant properties | ||||||
|---|---|---|---|---|---|---|---|
| Quadrant | DetID | PixID | Counts | Sigma | Mean | Median | Sigma |
| A | 13 | 254 | 11449 | 55.22 | 942 | 920 | 190.7 |
| A | 3 | 137 | 8645 | 40.51 | 942 | 920 | 190.7 |
| A | 0 | 226 | 7876 | 36.48 | 942 | 920 | 190.7 |
| B | 3 | 112 | 34758 | 186.89 | 937 | 915 | 181.1 |
| B | 15 | 222 | 31234 | 167.43 | 937 | 915 | 181.1 |
| B | 12 | 111 | 22306 | 118.13 | 937 | 915 | 181.1 |
| C | 14 | 238 | 142269 | 664.76 | 910 | 916 | 212.6 |
| C | 3 | 233 | 33826 | 154.77 | 910 | 916 | 212.6 |
| C | 13 | 61 | 6054 | 24.16 | 910 | 916 | 212.6 |
| D | 1 | 52 | 285358 | 1271.05 | 927 | 900 | 223.8 |
| D | 7 | 80 | 84927 | 375.46 | 927 | 900 | 223.8 |
| D | 8 | 195 | 73011 | 322.22 | 927 | 900 | 223.8 |
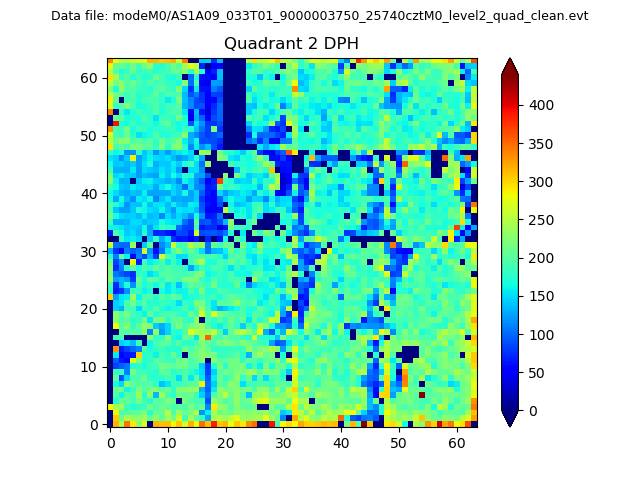
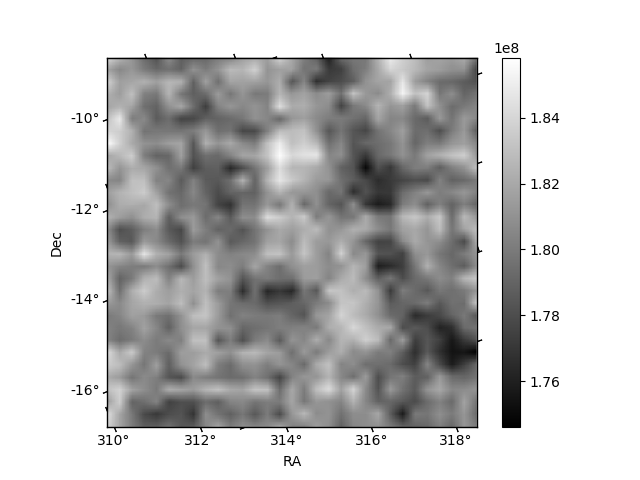
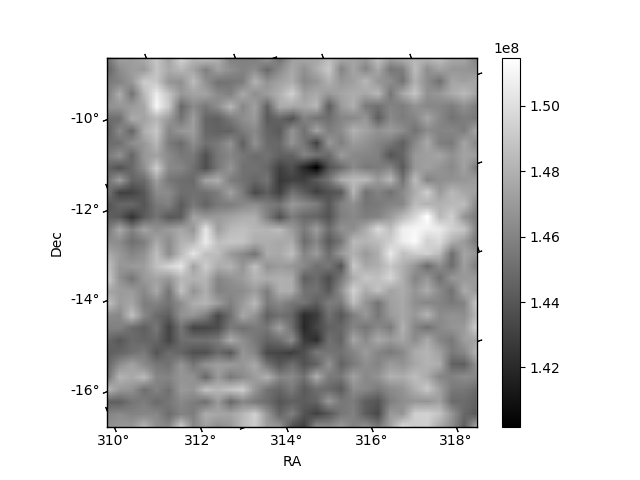
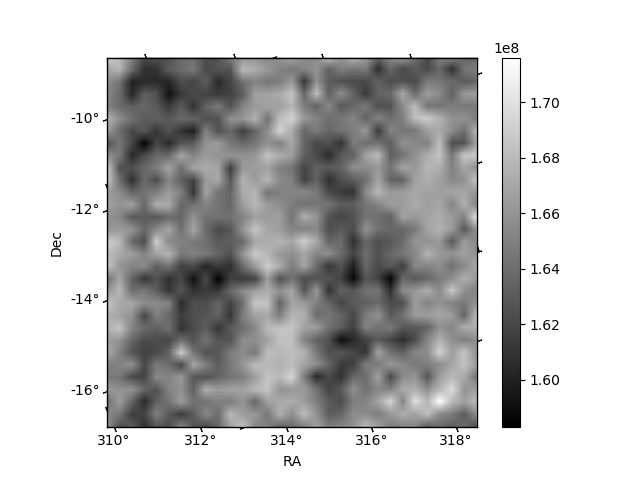
Histogram calculated using DETX and DETY for each event in the final _common_clean file
| Quadrant A | 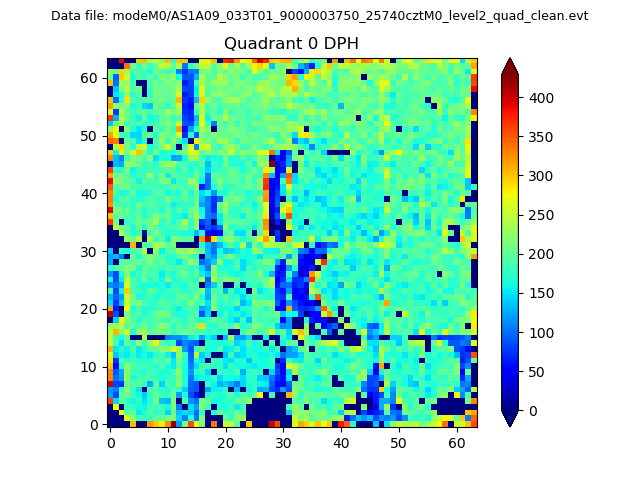 |
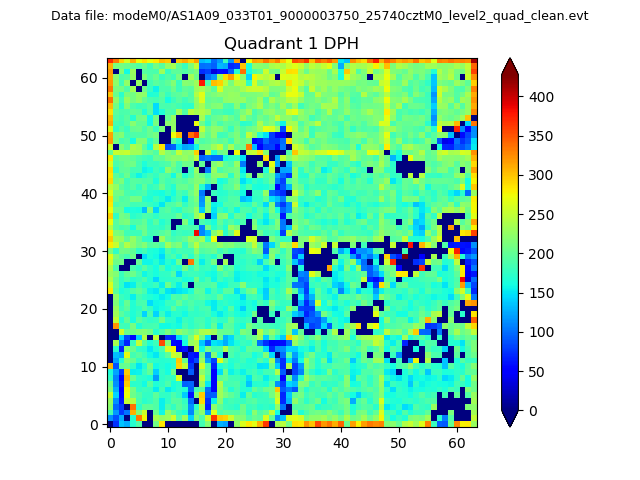 |
Quadrant B |
|---|---|---|---|
| Quadrant D | 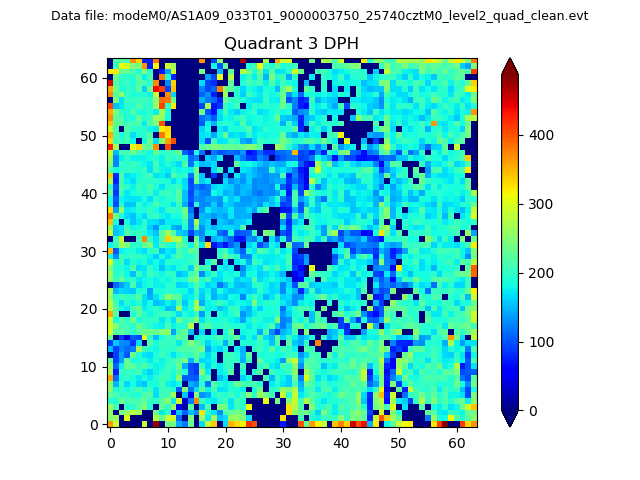 |
 |
Quadrant C |
| Plot type | Count rate plots | Images |
|---|---|---|
| Comparison with Poisson distribution Blue bars denote a histogram of data divided into 1 sec bins. Red curve is a Poisson curve with rate = median count rate of data. |
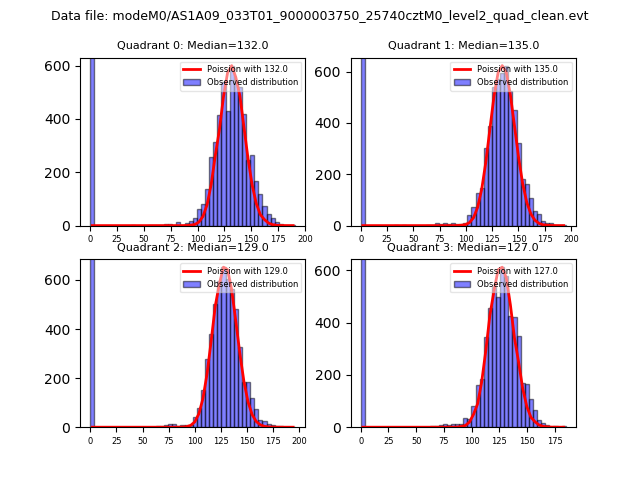 |
 |
| Quadrant-wise count rates Data is divided into 100 sec bins |
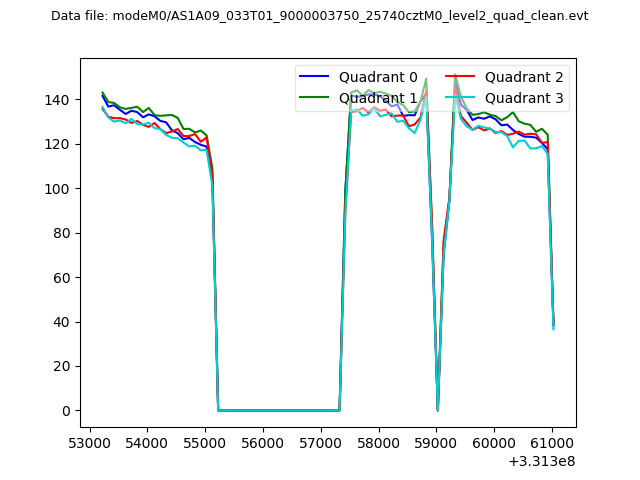 |
|
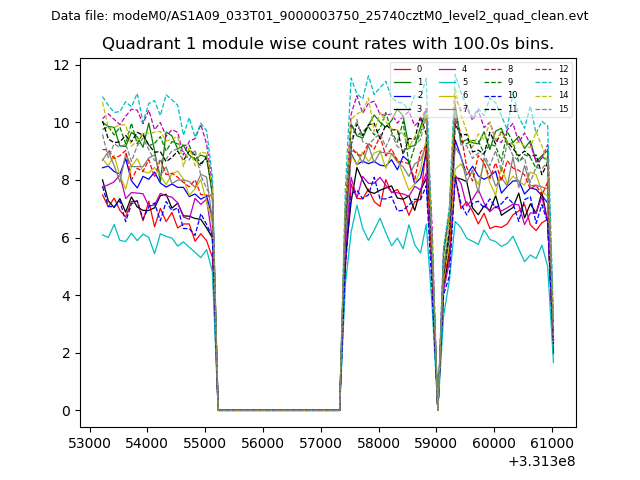
| Module-wise count rates for Quadrant A Data is divided into 100 sec bins |
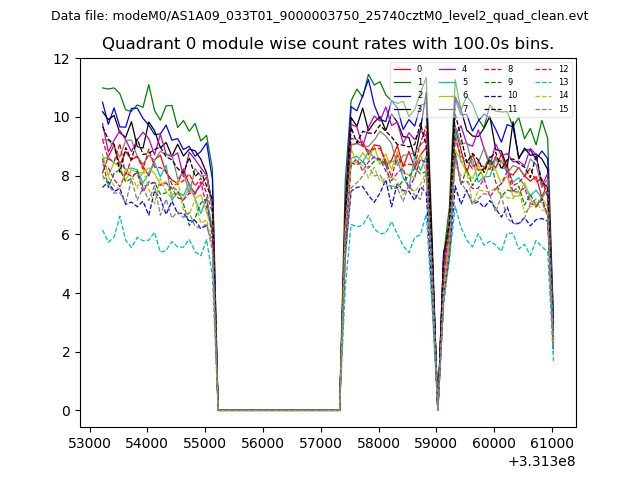 |
 |
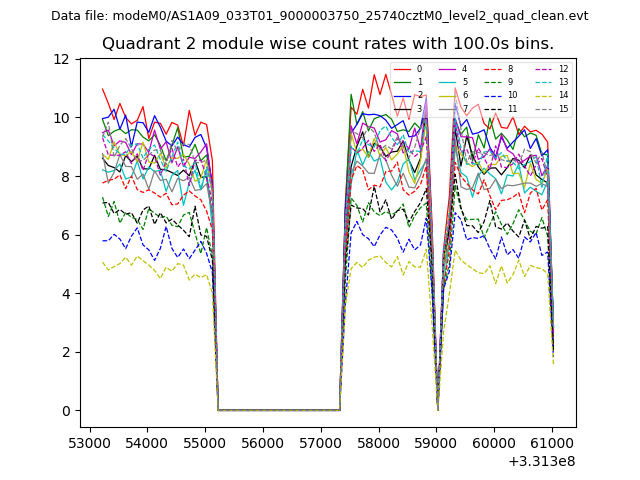
| Module-wise count rates for Quadrant B Data is divided into 100 sec bins |
 |
 |
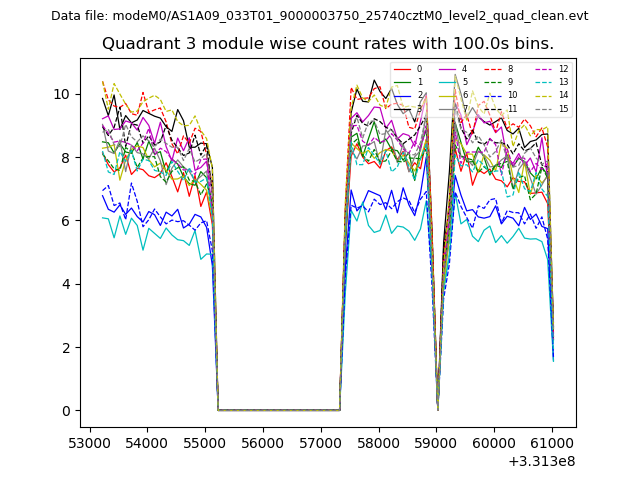
| Module-wise count rates for Quadrant C Data is divided into 100 sec bins |
 |
 |
| Module-wise count rates for Quadrant D Data is divided into 100 sec bins |
 |
 |
| Parameter | Plot |
|---|---|
| CZT HV Monitor | 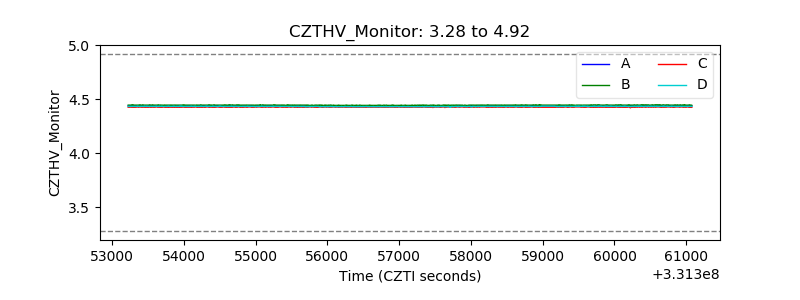 |
| D_VDD | 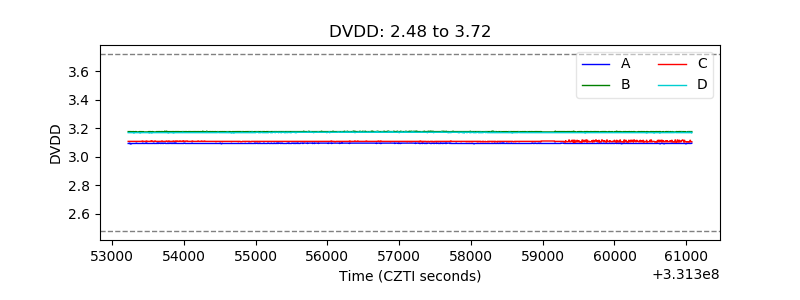 |
| Temperature 1 | 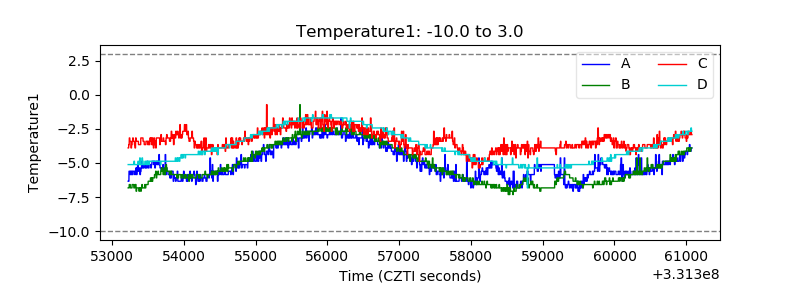 |
| Veto HV Monitor | 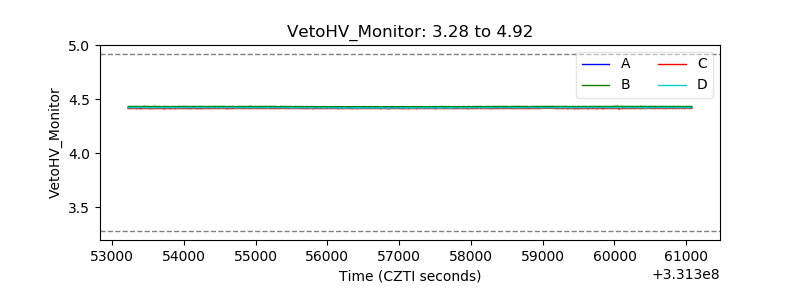 |
| Veto LLD | 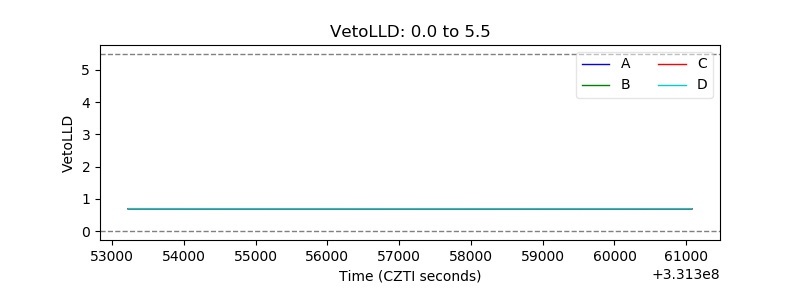 |
| Alpha Counter | 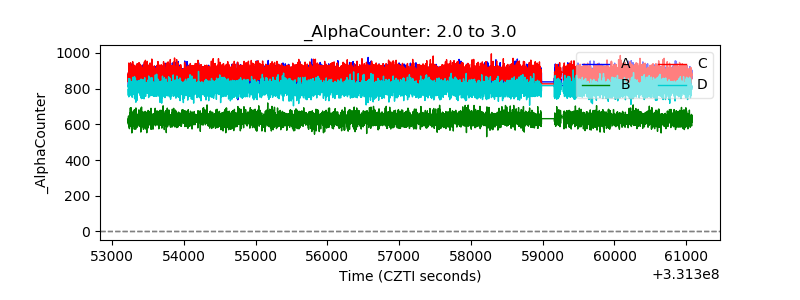 |
| _CPM_Rate | 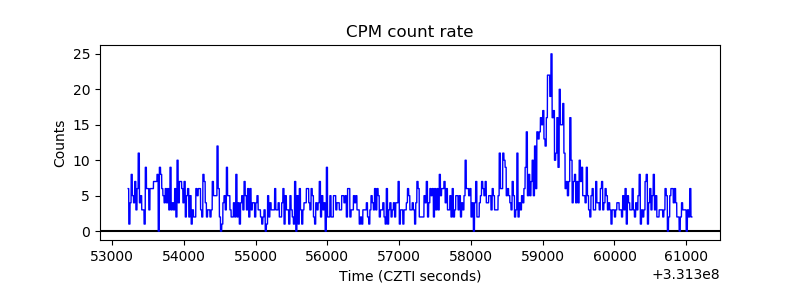 |
| CZT Counter | 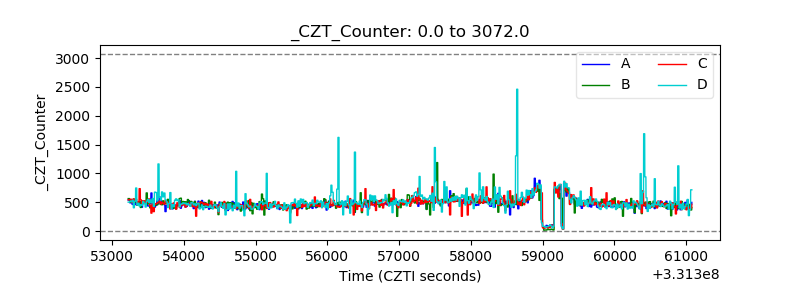 |
| +2.5 Volts monitor |  |
| +5 Volts monitor | 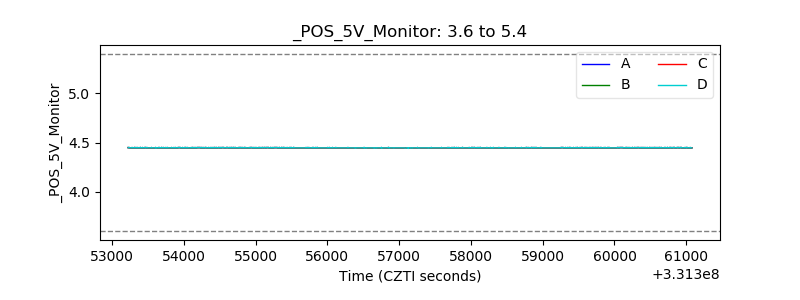 |
| _ROLL_ROT | 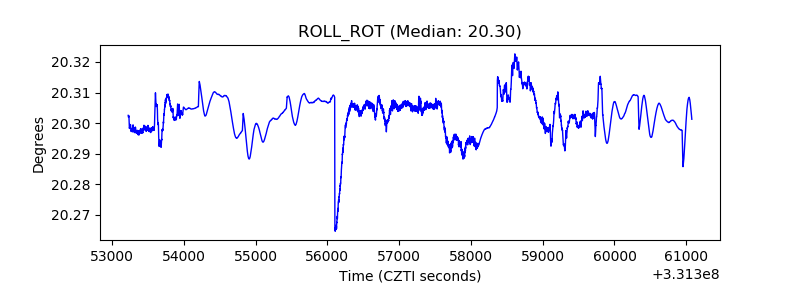 |
| _Roll_DEC |  |
| _Roll_RA | 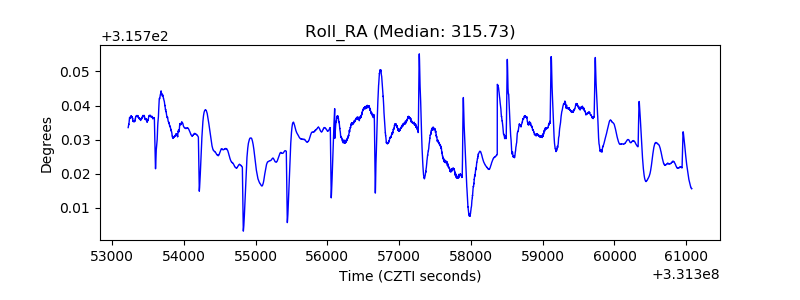 |
| Veto Counter | 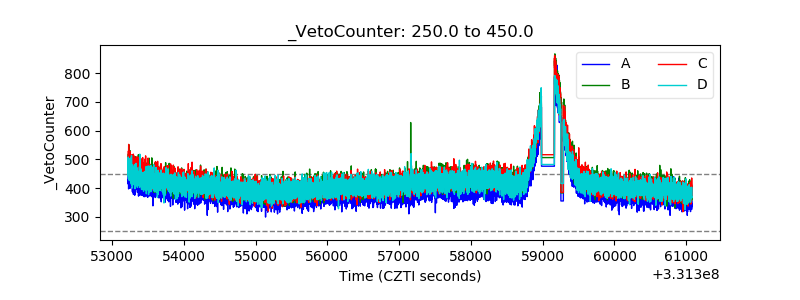 |