| Param | Original file | Final file |
|---|---|---|
| Filename | modeM0/AS1A09_033T01_9000003750_25741cztM0_level2.evt | modeM0/AS1A09_033T01_9000003750_25741cztM0_level2_quad_clean.evt |
| Size (bytes) | 1,256,235,840 | 234,043,200 |
| Size | 1.2 GB | 223.2 MB |
| Events in quadrant A | 8,834,561 | 1,470,548 |
| Events in quadrant B | 9,250,388 | 1,503,925 |
| Events in quadrant C | 9,008,907 | 1,441,860 |
| Events in quadrant D | 9,722,207 | 1,419,410 |
| Mode M0 | |||
|---|---|---|---|
| Quadrant | BADHDUFLAG | Total packets | Discarded packets |
| A | 0 | 37683 | 0 |
| B | 0 | 39073 | 0 |
| C | 0 | 37897 | 0 |
| D | 0 | 40366 | 0 |
| Mode M9 | |||
|---|---|---|---|
| Quadrant | BADHDUFLAG | Total packets | Discarded packets |
| A | 0 | 9 | 0 |
| B | 0 | 9 | 0 |
| C | 0 | 9 | 0 |
| D | 0 | 9 | 0 |
| Quadrant | Total seconds | Saturated seconds | Saturation percentage |
|---|---|---|---|
| A | 18166 | 530 | 2.917538% |
| B | 18166 | 584 | 3.214797% |
| C | 18166 | 564 | 3.104701% |
| D | 18166 | 515 | 2.834966% |
Noise dominated data is calculated using 1-second bins in cleaned event files. If a bin has >2000 counts, and if more than 50% of those come from <1% of pixels, then it is considered to be noise-dominated and hence unusable.
| Quadrant | # 1 sec bins | Bins with >0 counts | Bins with >2000 counts | High rate bins dominated by noise | Noise dominated (total time) | Noise dominated (detector-on time) | Marked lightcurve |
|---|---|---|---|---|---|---|---|
| A | 19136 | 18166 | 0 | 0 | 0.00% | 0.00% | 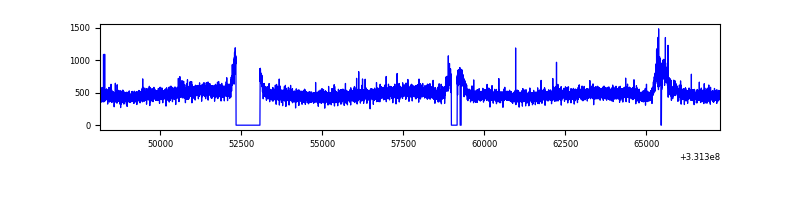 |
| B | 19136 | 18166 | 6 | 6 | 0.03% | 0.03% | 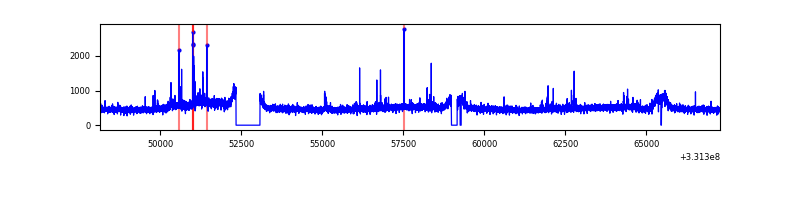 |
| C | 19136 | 18168 | 0 | 0 | 0.00% | 0.00% | 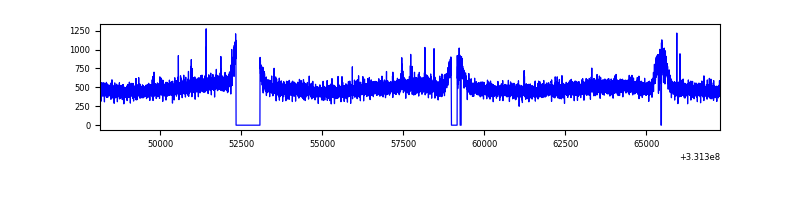 |
| D | 19136 | 18167 | 52 | 52 | 0.27% | 0.29% | 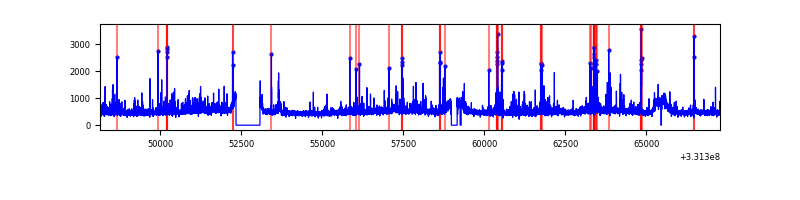 |
Top three noisy pixels from each quadrant. If the there are fewer than three noisy pixels in the level2.evt file, extra rows are filled as -1
| Pixel properties | Quadrant properties | ||||||
|---|---|---|---|---|---|---|---|
| Quadrant | DetID | PixID | Counts | Sigma | Mean | Median | Sigma |
| A | 0 | 13 | 31887 | 64.47 | 2281 | 2224 | 460.1 |
| A | 13 | 254 | 26898 | 53.63 | 2281 | 2224 | 460.1 |
| A | 3 | 137 | 21302 | 41.46 | 2281 | 2224 | 460.1 |
| B | 3 | 112 | 192450 | 438.75 | 2260 | 2202 | 433.6 |
| B | 15 | 222 | 60115 | 133.56 | 2260 | 2202 | 433.6 |
| B | 4 | 171 | 59902 | 133.07 | 2260 | 2202 | 433.6 |
| C | 14 | 238 | 348067 | 673.8 | 2197 | 2210 | 513.3 |
| C | 3 | 233 | 65001 | 122.33 | 2197 | 2210 | 513.3 |
| C | 8 | 128 | 16853 | 28.53 | 2197 | 2210 | 513.3 |
| D | 1 | 52 | 680217 | 1253.94 | 2242 | 2177 | 540.7 |
| D | 8 | 195 | 175881 | 321.24 | 2242 | 2177 | 540.7 |
| D | 7 | 80 | 162967 | 297.36 | 2242 | 2177 | 540.7 |
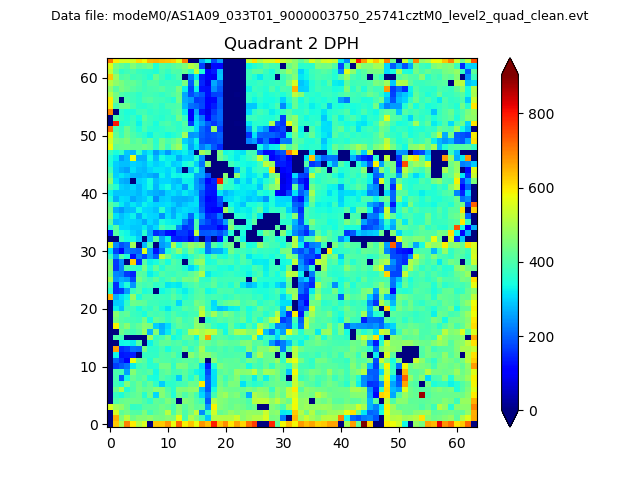
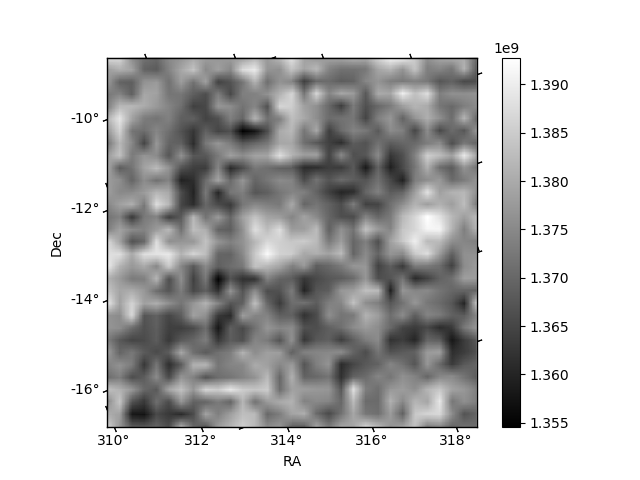
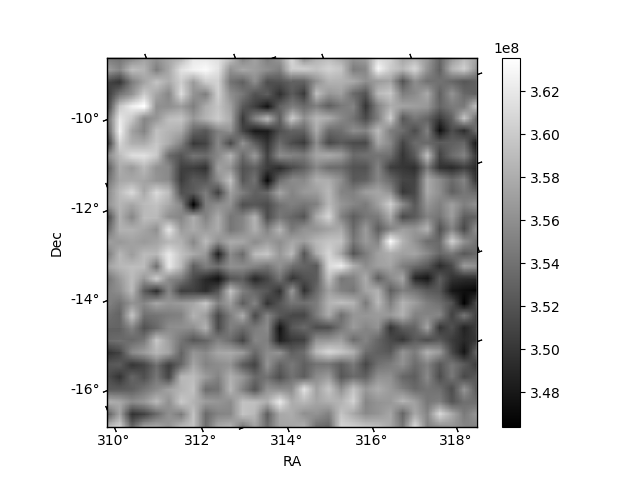
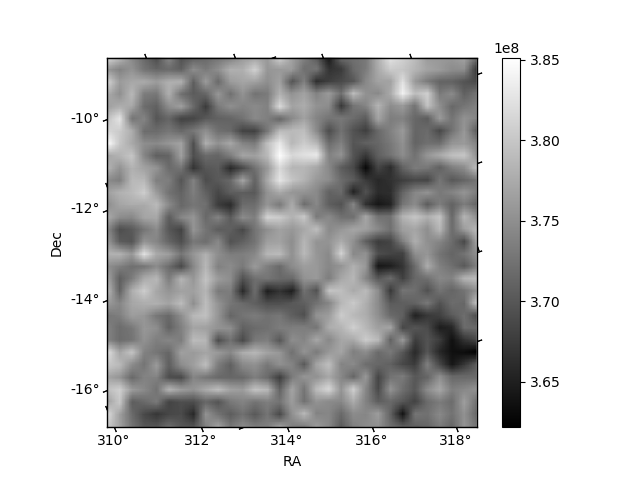
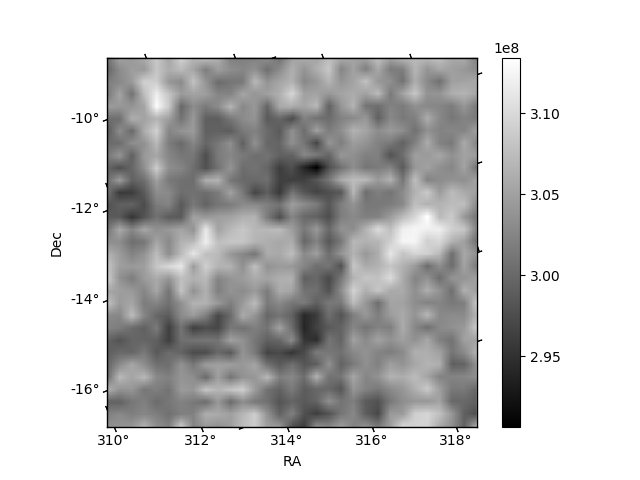
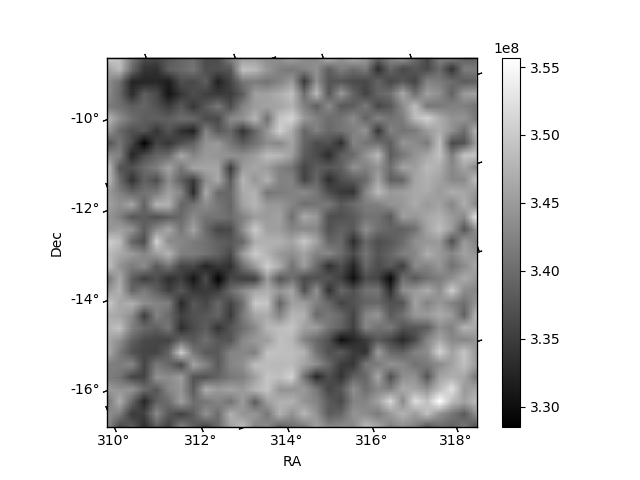
Histogram calculated using DETX and DETY for each event in the final _common_clean file
| Quadrant A | 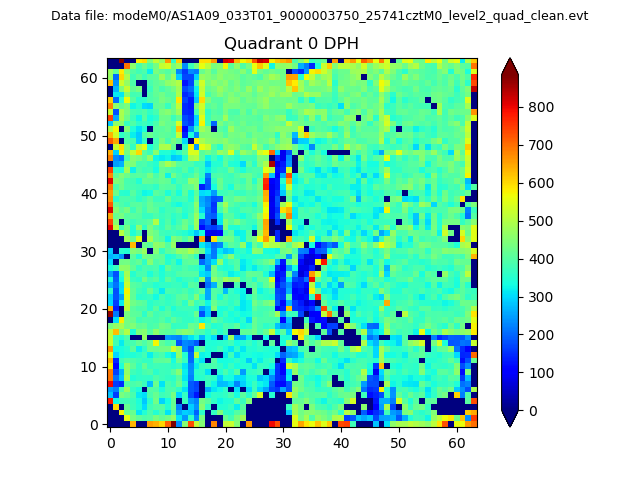 |
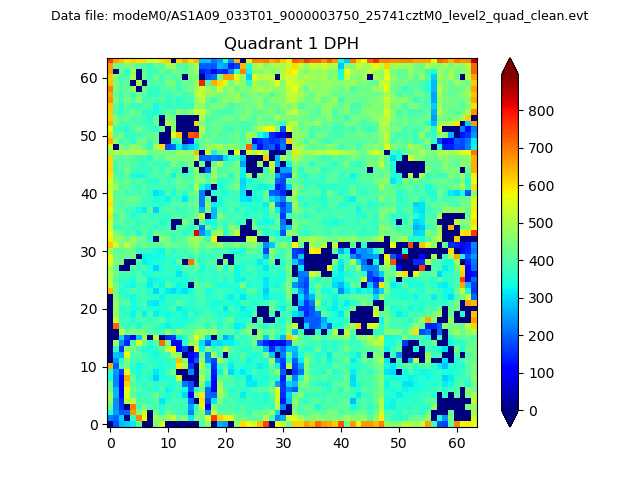 |
Quadrant B |
|---|---|---|---|
| Quadrant D | 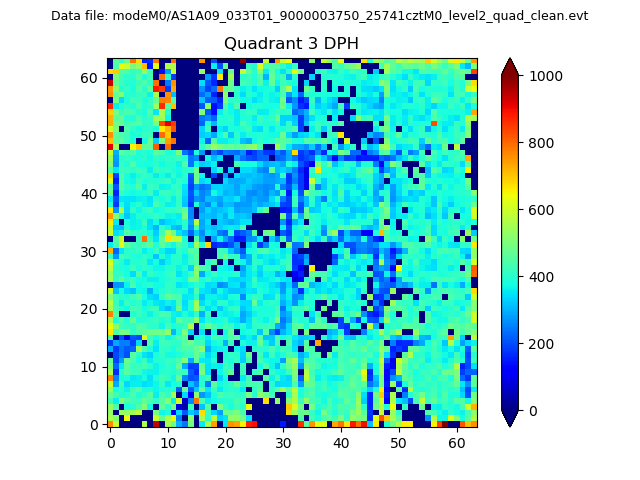 |
 |
Quadrant C |
| Plot type | Count rate plots | Images |
|---|---|---|
| Comparison with Poisson distribution Blue bars denote a histogram of data divided into 1 sec bins. Red curve is a Poisson curve with rate = median count rate of data. |
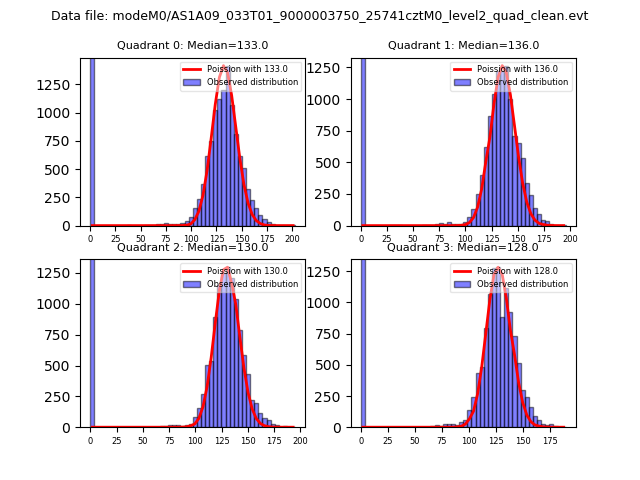 |
 |
| Quadrant-wise count rates Data is divided into 100 sec bins |
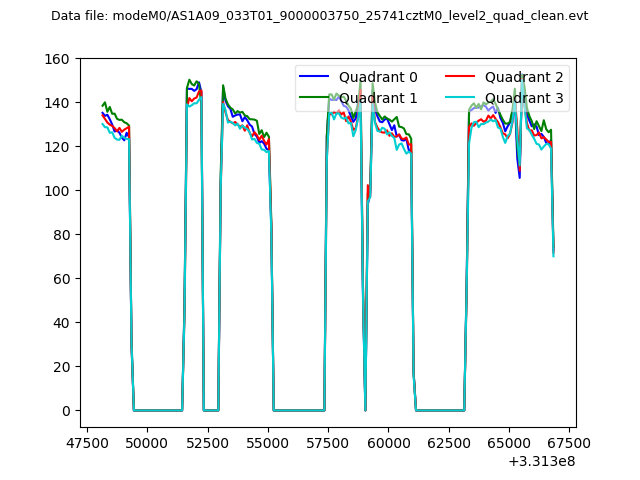 |
|
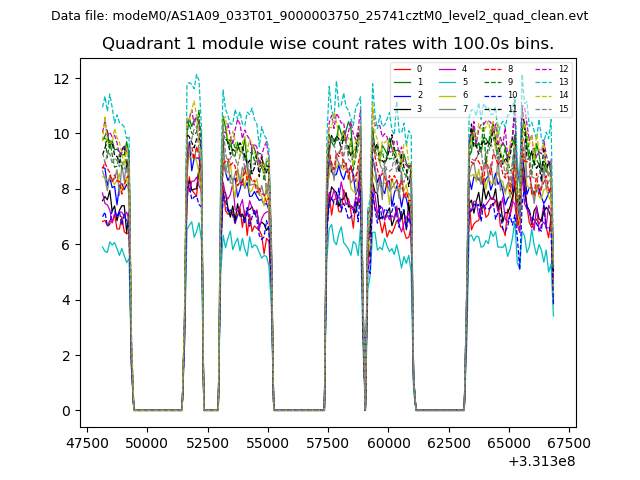
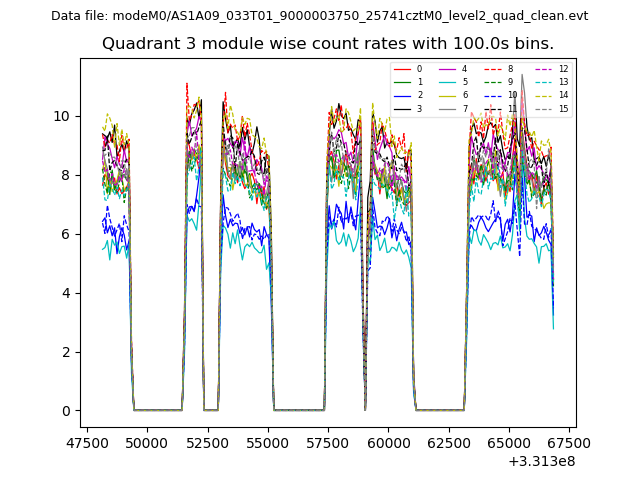
| Module-wise count rates for Quadrant A Data is divided into 100 sec bins |
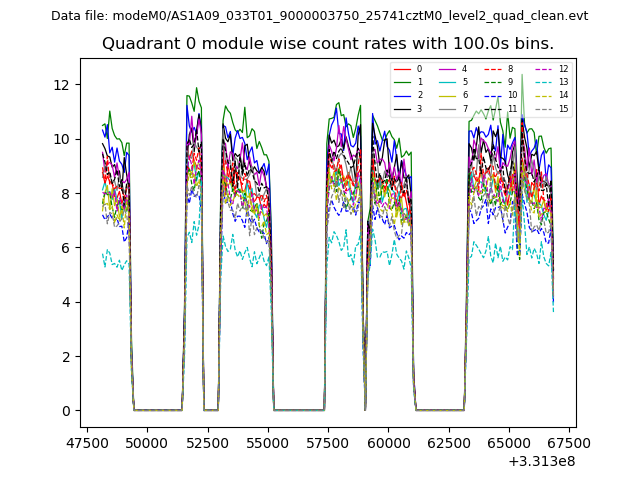 |
 |
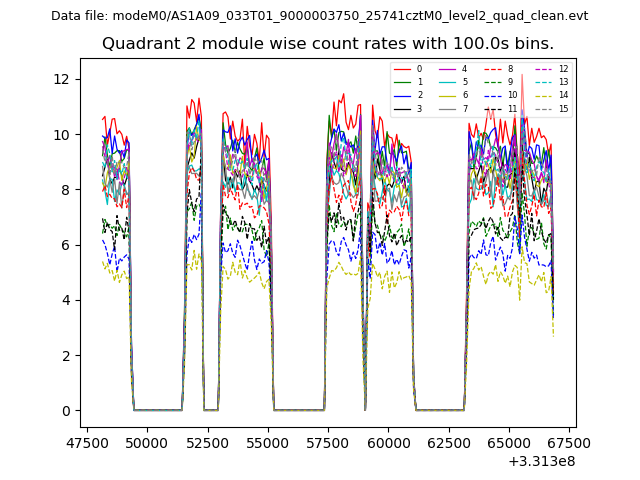
| Module-wise count rates for Quadrant B Data is divided into 100 sec bins |
 |
 |
| Module-wise count rates for Quadrant C Data is divided into 100 sec bins |
 |
 |
| Module-wise count rates for Quadrant D Data is divided into 100 sec bins |
 |
 |
| Parameter | Plot |
|---|---|
| CZT HV Monitor | 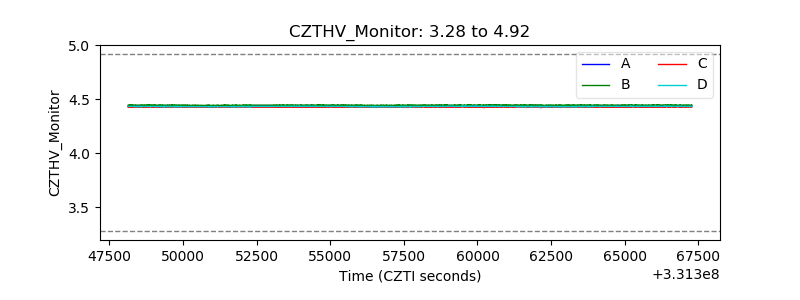 |
| D_VDD | 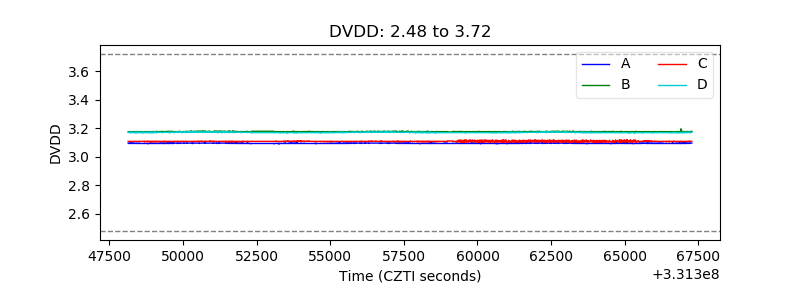 |
| Temperature 1 | 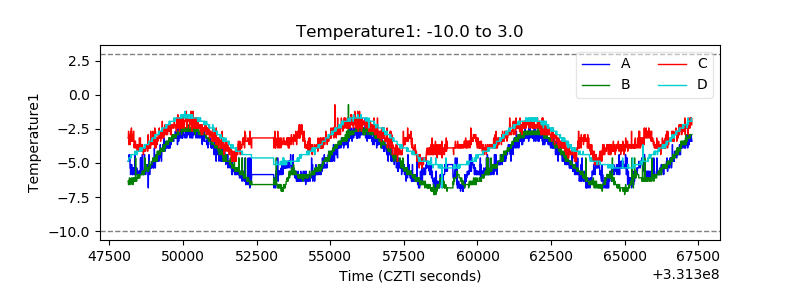 |
| Veto HV Monitor | 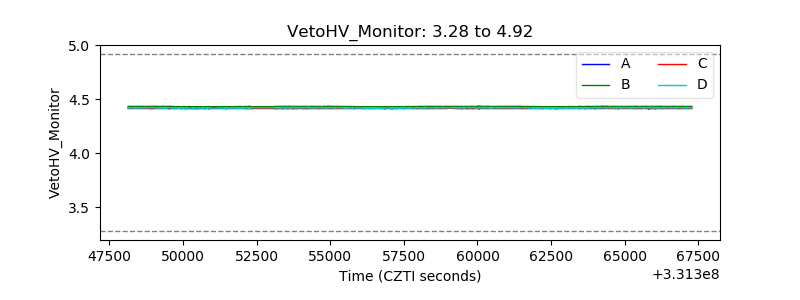 |
| Veto LLD | 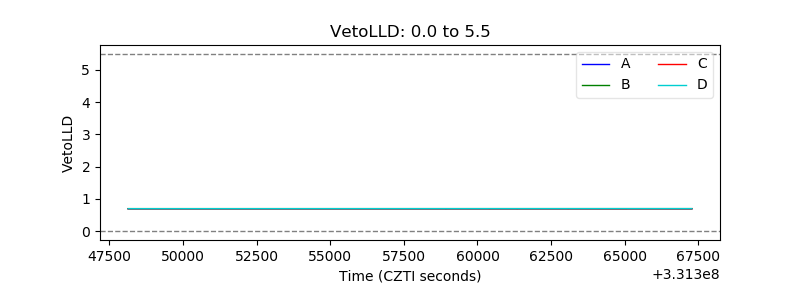 |
| Alpha Counter | 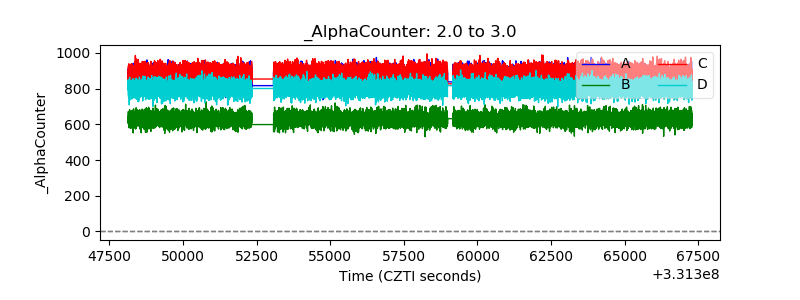 |
| _CPM_Rate | 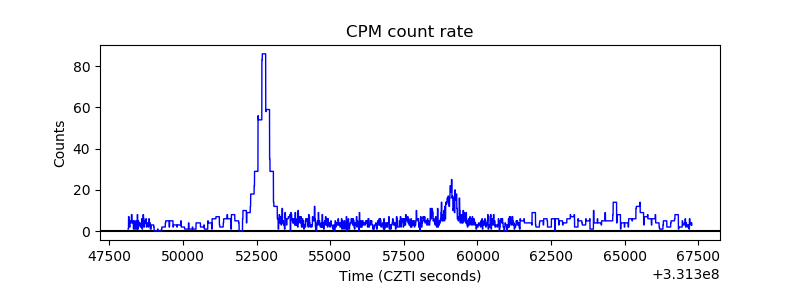 |
| CZT Counter | 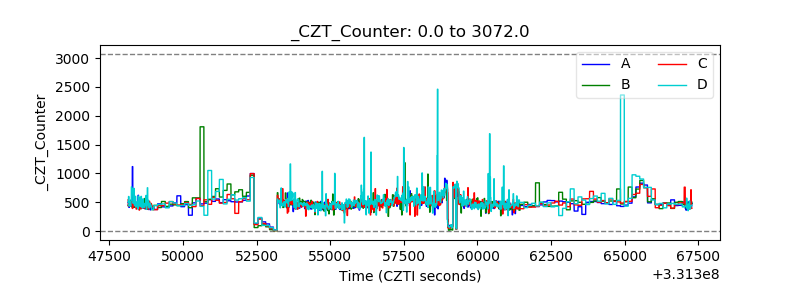 |
| +2.5 Volts monitor |  |
| +5 Volts monitor | 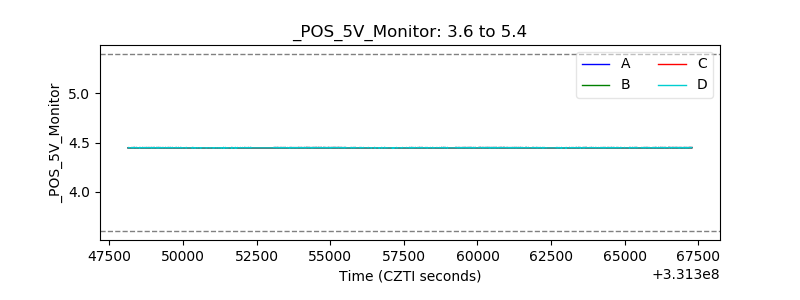 |
| _ROLL_ROT | 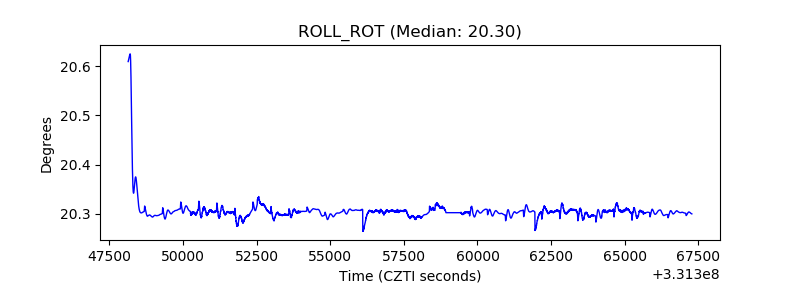 |
| _Roll_DEC | 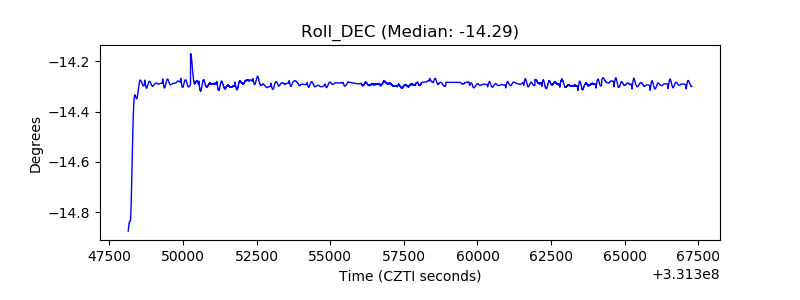 |
| _Roll_RA | 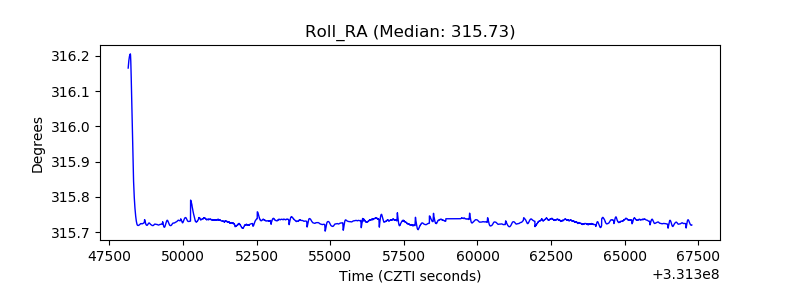 |
| Veto Counter | 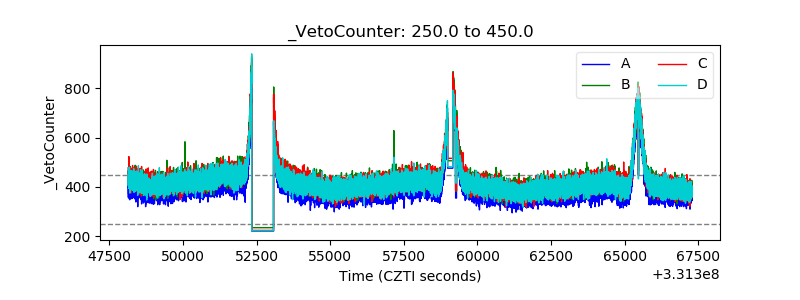 |