| Param | Original file | Final file |
|---|---|---|
| Filename | modeM0/AS1A09_033T01_9000003750_25742cztM0_level2.evt | modeM0/AS1A09_033T01_9000003750_25742cztM0_level2_quad_clean.evt |
| Size (bytes) | 467,637,120 | 85,129,920 |
| Size | 446.0 MB | 81.2 MB |
| Events in quadrant A | 3,336,425 | 528,286 |
| Events in quadrant B | 3,450,749 | 536,524 |
| Events in quadrant C | 3,405,316 | 514,963 |
| Events in quadrant D | 3,490,823 | 507,264 |
| Mode M0 | |||
|---|---|---|---|
| Quadrant | BADHDUFLAG | Total packets | Discarded packets |
| A | 0 | 14388 | 0 |
| B | 0 | 14643 | 0 |
| C | 0 | 14497 | 0 |
| D | 0 | 14936 | 0 |
| Mode M9 | |||
|---|---|---|---|
| Quadrant | BADHDUFLAG | Total packets | Discarded packets |
| A | 0 | 4 | 0 |
| B | 0 | 4 | 0 |
| C | 0 | 4 | 0 |
| D | 0 | 4 | 0 |
| Quadrant | Total seconds | Saturated seconds | Saturation percentage |
|---|---|---|---|
| A | 7051 | 106 | 1.503333% |
| B | 7051 | 118 | 1.673521% |
| C | 7051 | 125 | 1.772798% |
| D | 7050 | 89 | 1.262411% |
Noise dominated data is calculated using 1-second bins in cleaned event files. If a bin has >2000 counts, and if more than 50% of those come from <1% of pixels, then it is considered to be noise-dominated and hence unusable.
| Quadrant | # 1 sec bins | Bins with >0 counts | Bins with >2000 counts | High rate bins dominated by noise | Noise dominated (total time) | Noise dominated (detector-on time) | Marked lightcurve |
|---|---|---|---|---|---|---|---|
| A | 7386 | 7051 | 0 | 0 | 0.00% | 0.00% | 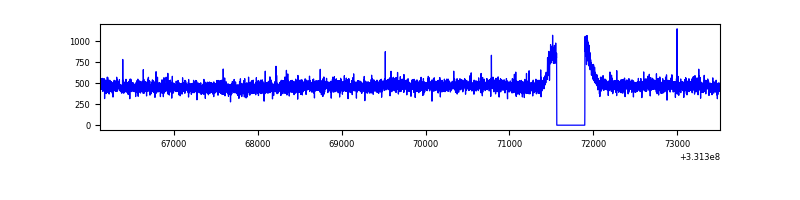 |
| B | 7386 | 7051 | 1 | 1 | 0.01% | 0.01% | 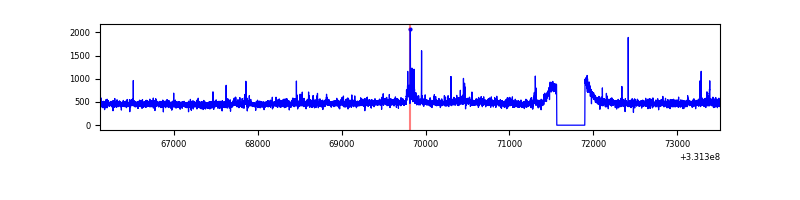 |
| C | 7386 | 7051 | 6 | 6 | 0.08% | 0.09% | 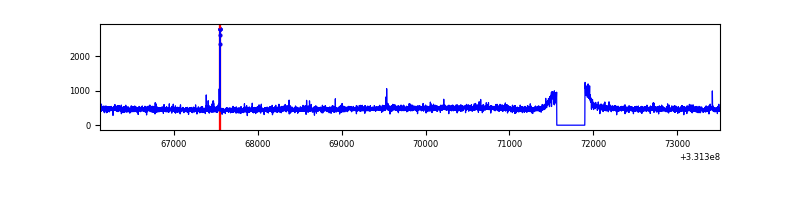 |
| D | 7385 | 7050 | 11 | 11 | 0.15% | 0.16% | 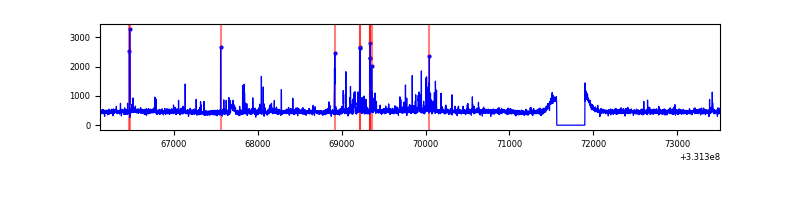 |
Top three noisy pixels from each quadrant. If the there are fewer than three noisy pixels in the level2.evt file, extra rows are filled as -1
| Pixel properties | Quadrant properties | ||||||
|---|---|---|---|---|---|---|---|
| Quadrant | DetID | PixID | Counts | Sigma | Mean | Median | Sigma |
| A | 13 | 254 | 10049 | 52.65 | 864 | 843 | 174.8 |
| A | 3 | 137 | 8322 | 42.77 | 864 | 843 | 174.8 |
| A | 0 | 226 | 7039 | 35.44 | 864 | 843 | 174.8 |
| B | 15 | 222 | 62937 | 374.49 | 852 | 829 | 165.8 |
| B | 12 | 111 | 20746 | 120.09 | 852 | 829 | 165.8 |
| B | 11 | 111 | 18788 | 108.29 | 852 | 829 | 165.8 |
| C | 14 | 238 | 131846 | 672.4 | 827 | 833 | 194.8 |
| C | 3 | 233 | 45936 | 231.48 | 827 | 833 | 194.8 |
| C | 13 | 61 | 5606 | 24.5 | 827 | 833 | 194.8 |
| D | 1 | 52 | 104023 | 503.91 | 844 | 819 | 204.8 |
| D | 7 | 80 | 80755 | 390.3 | 844 | 819 | 204.8 |
| D | 13 | 104 | 50342 | 241.81 | 844 | 819 | 204.8 |
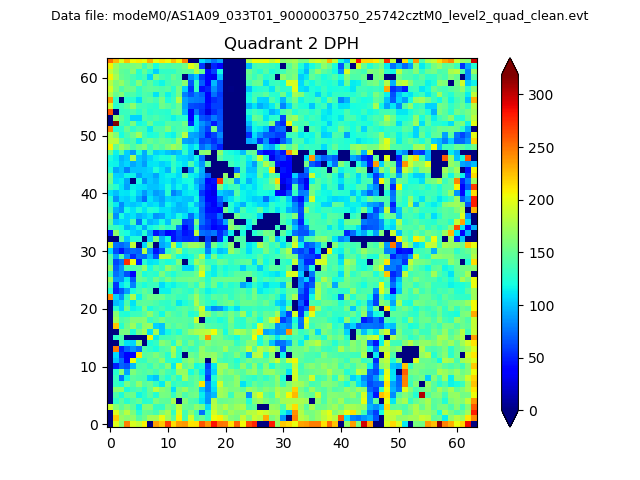
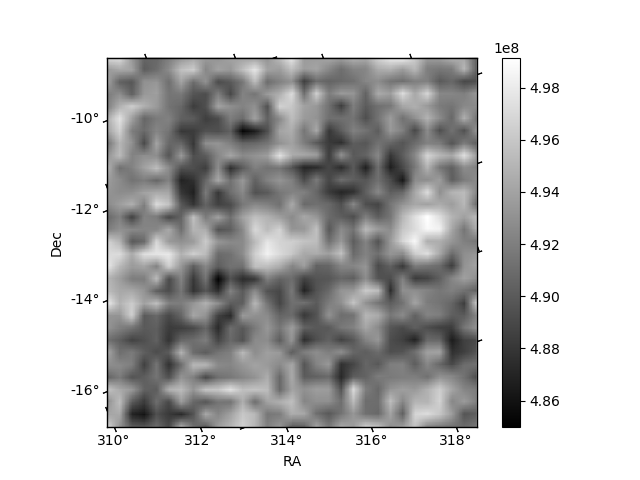
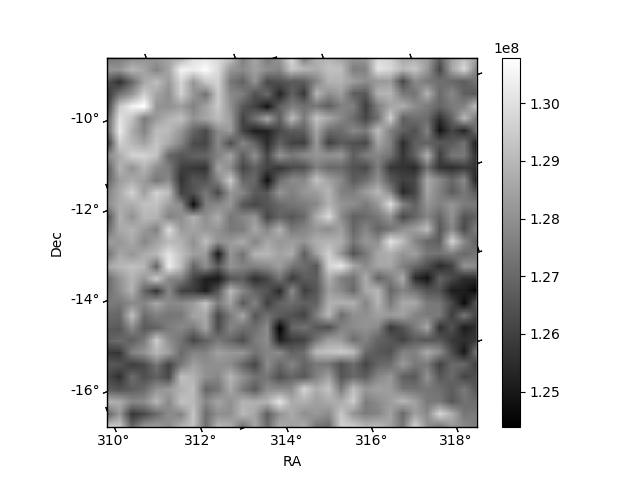
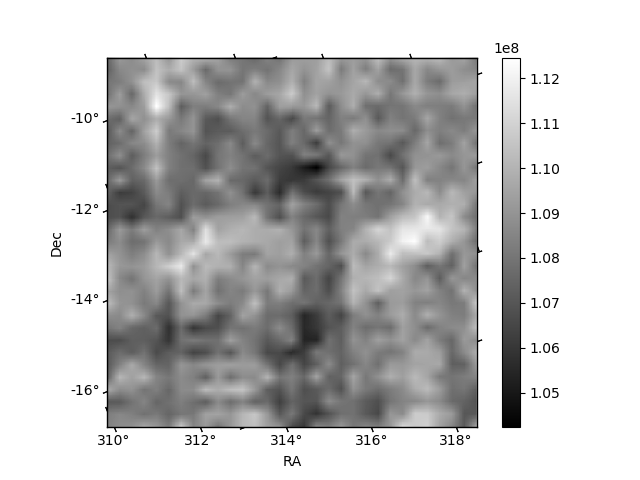
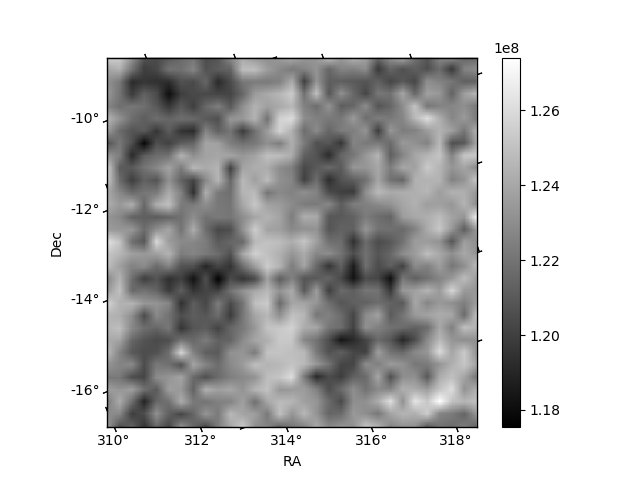
Histogram calculated using DETX and DETY for each event in the final _common_clean file
| Quadrant A | 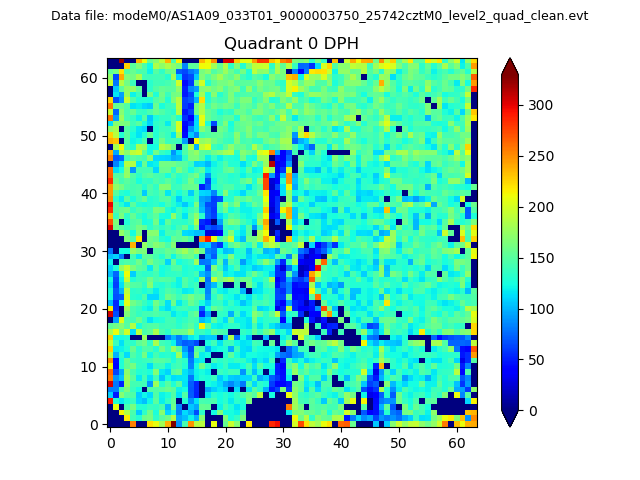 |
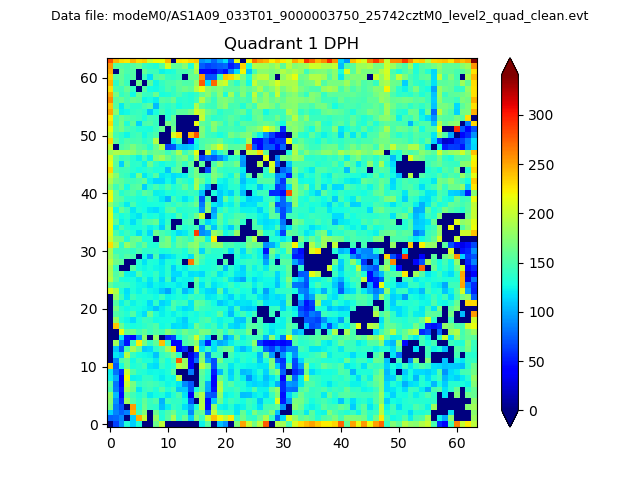 |
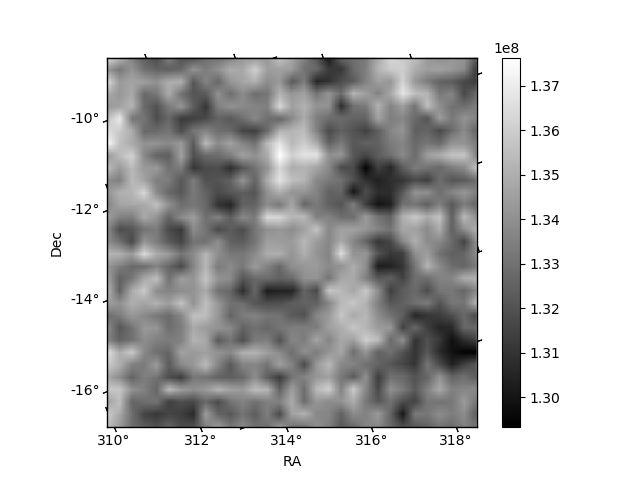
Quadrant B |
|---|---|---|---|
| Quadrant D | 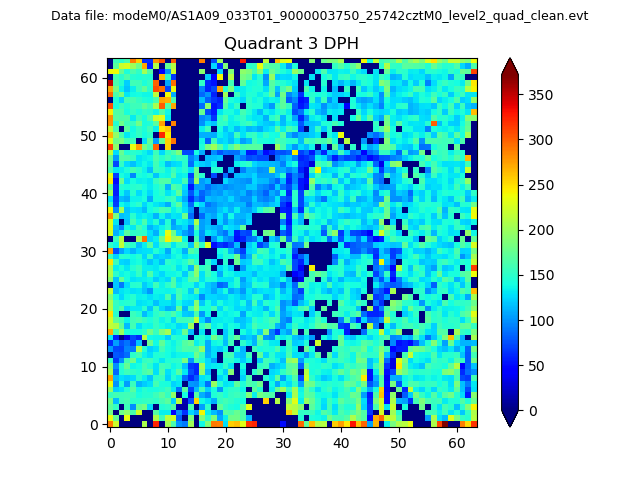 |
 |
Quadrant C |
| Plot type | Count rate plots | Images |
|---|---|---|
| Comparison with Poisson distribution Blue bars denote a histogram of data divided into 1 sec bins. Red curve is a Poisson curve with rate = median count rate of data. |
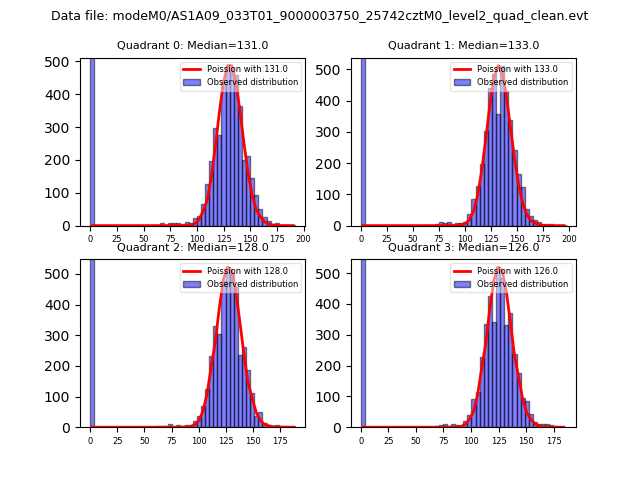 |
 |
| Quadrant-wise count rates Data is divided into 100 sec bins |
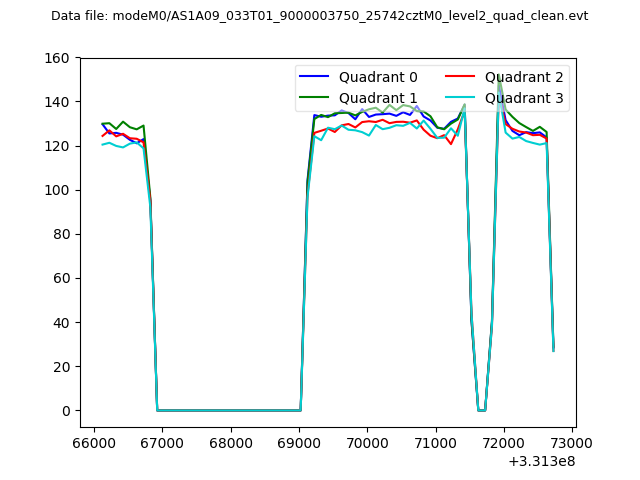 |
|
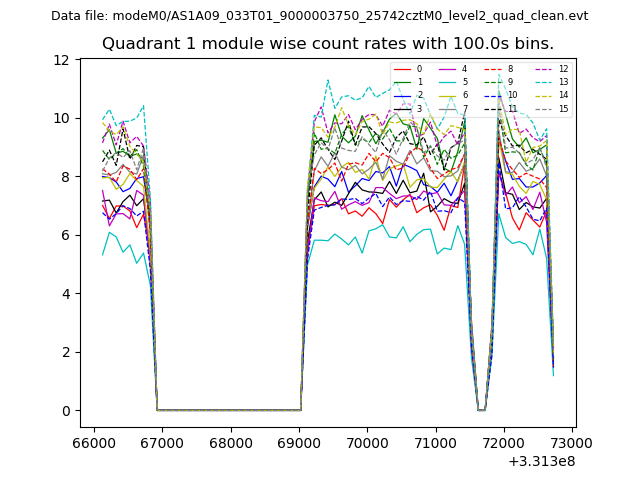
| Module-wise count rates for Quadrant A Data is divided into 100 sec bins |
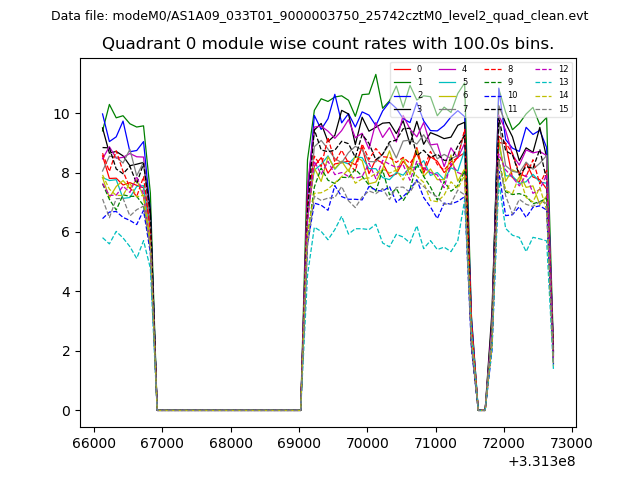 |
 |
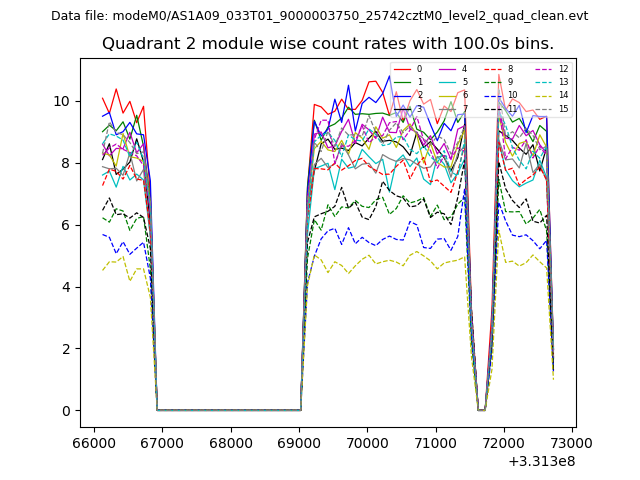
| Module-wise count rates for Quadrant B Data is divided into 100 sec bins |
 |
 |
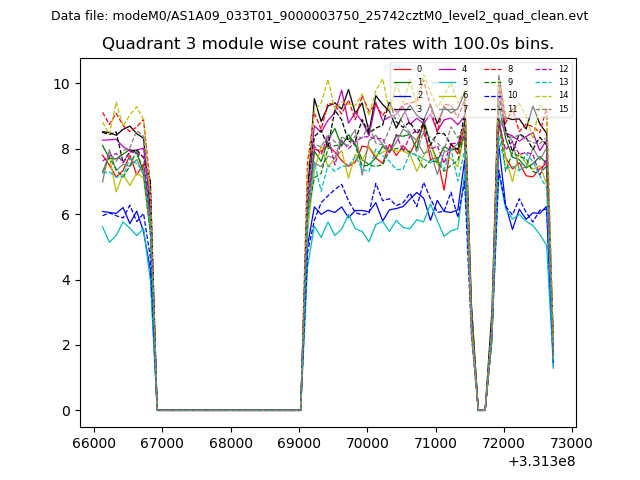
| Module-wise count rates for Quadrant C Data is divided into 100 sec bins |
 |
 |
| Module-wise count rates for Quadrant D Data is divided into 100 sec bins |
 |
 |
| Parameter | Plot |
|---|---|
| CZT HV Monitor | 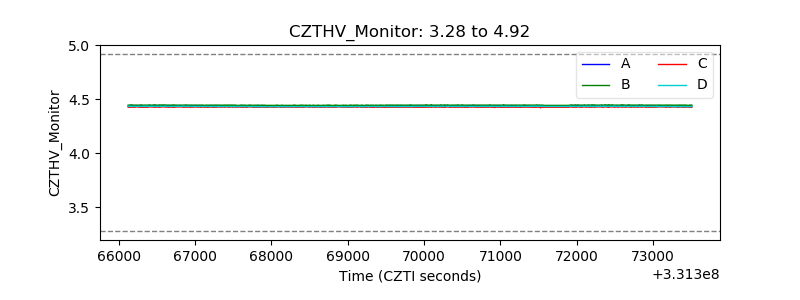 |
| D_VDD | 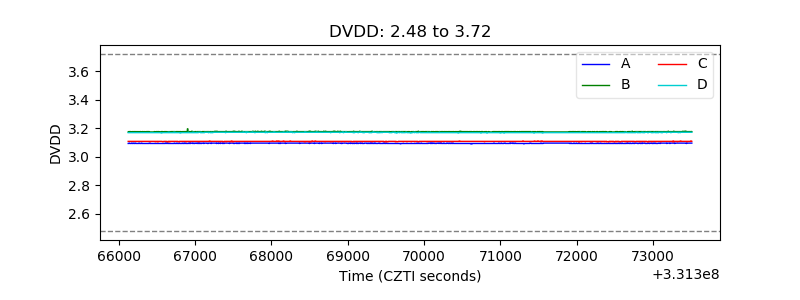 |
| Temperature 1 | 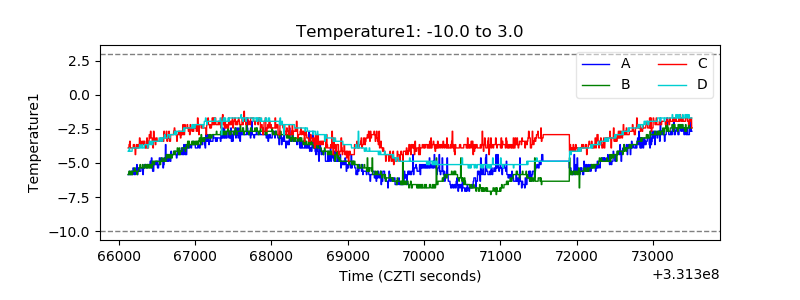 |
| Veto HV Monitor | 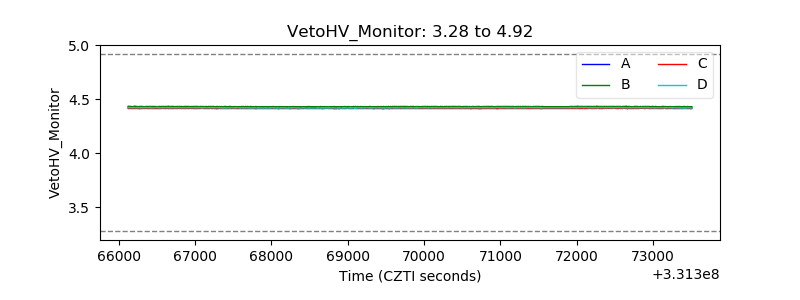 |
| Veto LLD | 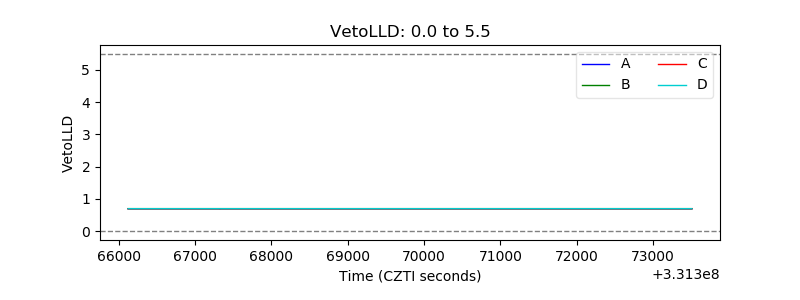 |
| Alpha Counter | 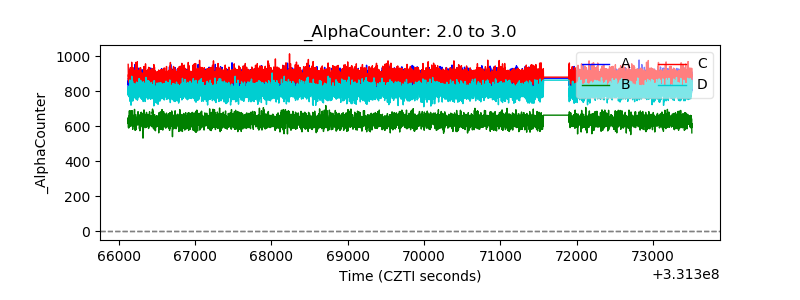 |
| _CPM_Rate | 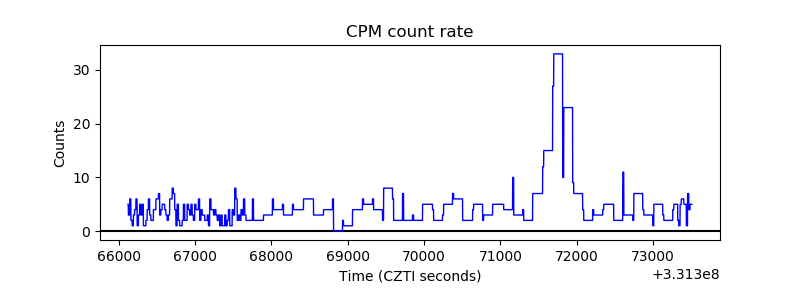 |
| CZT Counter | 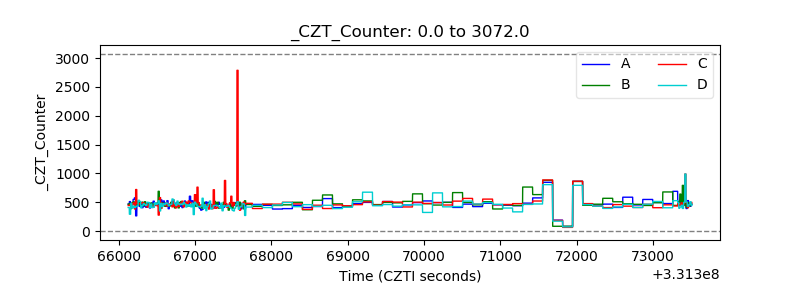 |
| +2.5 Volts monitor |  |
| +5 Volts monitor |  |
| _ROLL_ROT | 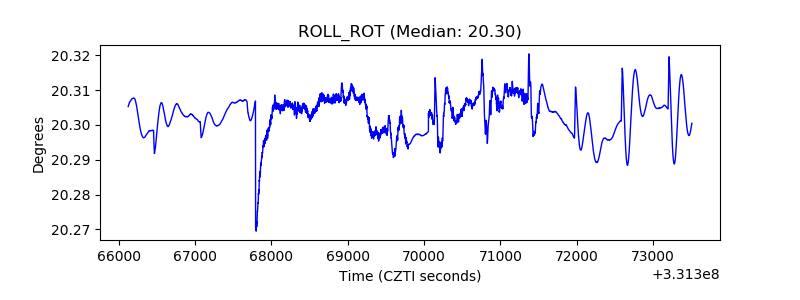 |
| _Roll_DEC | 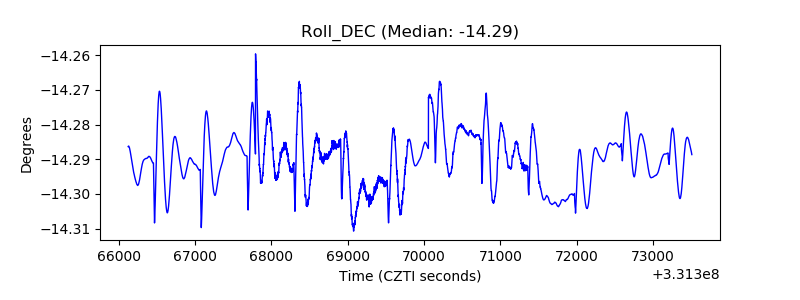 |
| _Roll_RA | 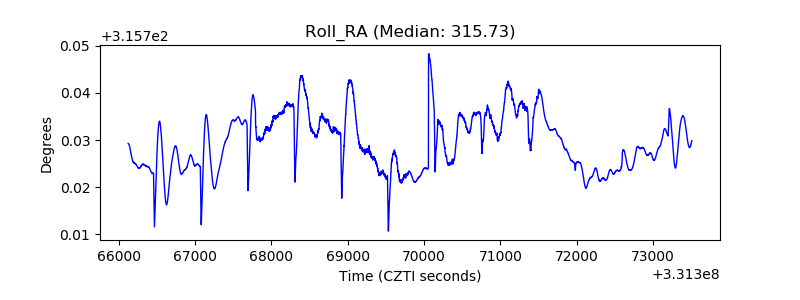 |
| Veto Counter |  |