| Param | Original file | Final file |
|---|---|---|
| Filename | modeM0/AS1A09_033T01_9000003750_25744cztM0_level2.evt | modeM0/AS1A09_033T01_9000003750_25744cztM0_level2_quad_clean.evt |
| Size (bytes) | 843,500,160 | 137,272,320 |
| Size | 804.4 MB | 130.9 MB |
| Events in quadrant A | 6,040,846 | 841,506 |
| Events in quadrant B | 6,308,748 | 842,535 |
| Events in quadrant C | 6,026,407 | 805,967 |
| Events in quadrant D | 6,320,752 | 800,833 |
| Mode M0 | |||
|---|---|---|---|
| Quadrant | BADHDUFLAG | Total packets | Discarded packets |
| A | 0 | 25600 | 0 |
| B | 0 | 26412 | 0 |
| C | 0 | 25607 | 0 |
| D | 0 | 26621 | 0 |
| Mode M9 | |||
|---|---|---|---|
| Quadrant | BADHDUFLAG | Total packets | Discarded packets |
| A | 0 | 12 | 0 |
| B | 0 | 12 | 0 |
| C | 0 | 12 | 0 |
| D | 0 | 12 | 0 |
| Quadrant | Total seconds | Saturated seconds | Saturation percentage |
|---|---|---|---|
| A | 12524 | 109 | 0.870329% |
| B | 12525 | 153 | 1.221557% |
| C | 12525 | 154 | 1.229541% |
| D | 12525 | 116 | 0.926148% |
Noise dominated data is calculated using 1-second bins in cleaned event files. If a bin has >2000 counts, and if more than 50% of those come from <1% of pixels, then it is considered to be noise-dominated and hence unusable.
| Quadrant | # 1 sec bins | Bins with >0 counts | Bins with >2000 counts | High rate bins dominated by noise | Noise dominated (total time) | Noise dominated (detector-on time) | Marked lightcurve |
|---|---|---|---|---|---|---|---|
| A | 13814 | 12524 | 0 | 0 | 0.00% | 0.00% | 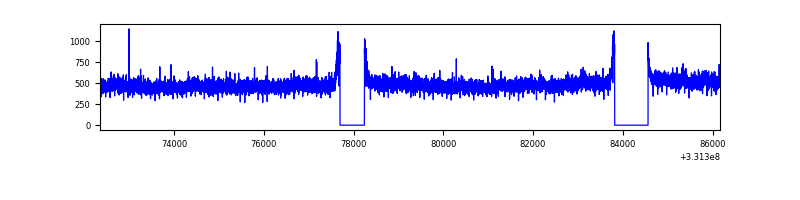 |
| B | 13815 | 12525 | 24 | 24 | 0.17% | 0.19% | 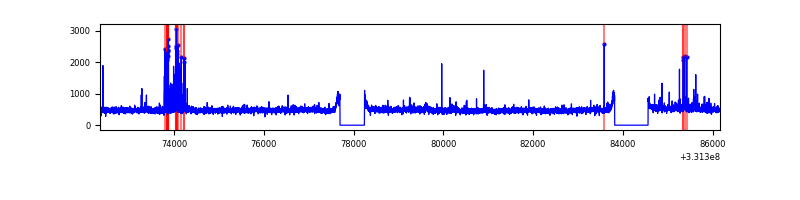 |
| C | 13815 | 12525 | 0 | 0 | 0.00% | 0.00% | 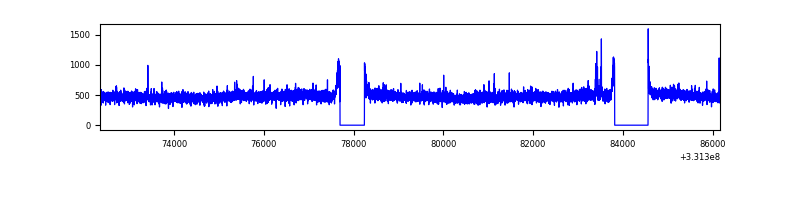 |
| D | 13815 | 12525 | 23 | 23 | 0.17% | 0.18% | 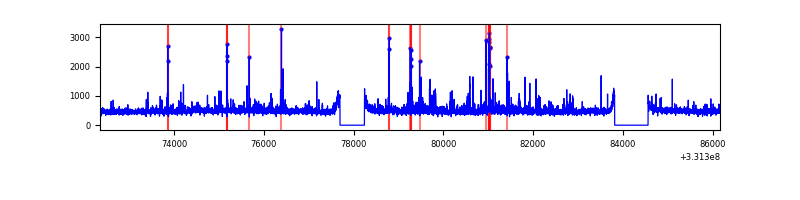 |
Top three noisy pixels from each quadrant. If the there are fewer than three noisy pixels in the level2.evt file, extra rows are filled as -1
| Pixel properties | Quadrant properties | ||||||
|---|---|---|---|---|---|---|---|
| Quadrant | DetID | PixID | Counts | Sigma | Mean | Median | Sigma |
| A | 10 | 17 | 107441 | 344.87 | 1533 | 1499 | 307.2 |
| A | 13 | 254 | 19039 | 57.1 | 1533 | 1499 | 307.2 |
| A | 6 | 16 | 16215 | 47.9 | 1533 | 1499 | 307.2 |
| B | 15 | 222 | 234886 | 805.82 | 1514 | 1475 | 289.7 |
| B | 0 | 190 | 38616 | 128.22 | 1514 | 1475 | 289.7 |
| B | 12 | 111 | 36529 | 121.02 | 1514 | 1475 | 289.7 |
| C | 14 | 238 | 234150 | 675.72 | 1467 | 1476 | 344.3 |
| C | 3 | 233 | 73035 | 207.82 | 1467 | 1476 | 344.3 |
| C | 13 | 61 | 9936 | 24.57 | 1467 | 1476 | 344.3 |
| D | 1 | 52 | 327400 | 904.36 | 1495 | 1457 | 360.4 |
| D | 8 | 195 | 121170 | 332.16 | 1495 | 1457 | 360.4 |
| D | 13 | 104 | 72123 | 196.07 | 1495 | 1457 | 360.4 |
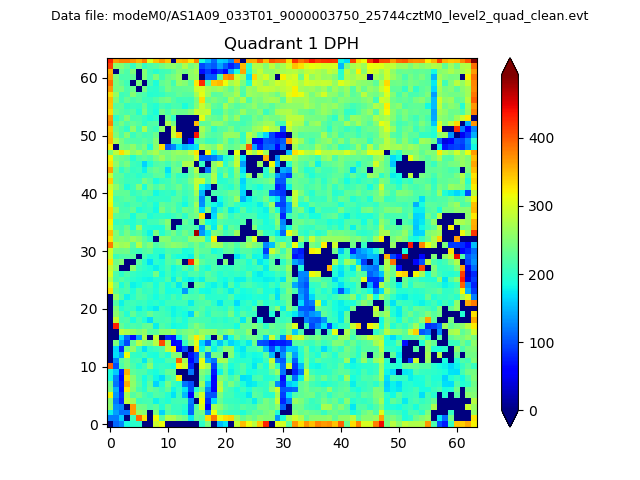
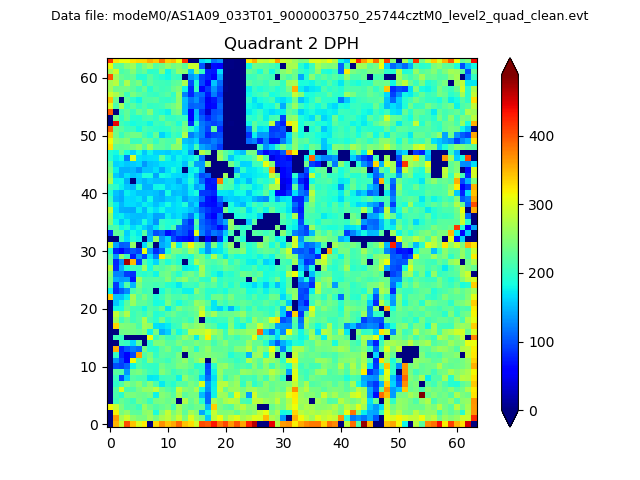
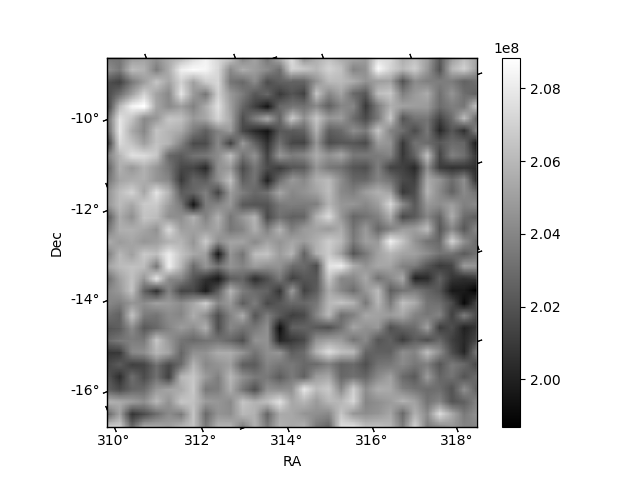
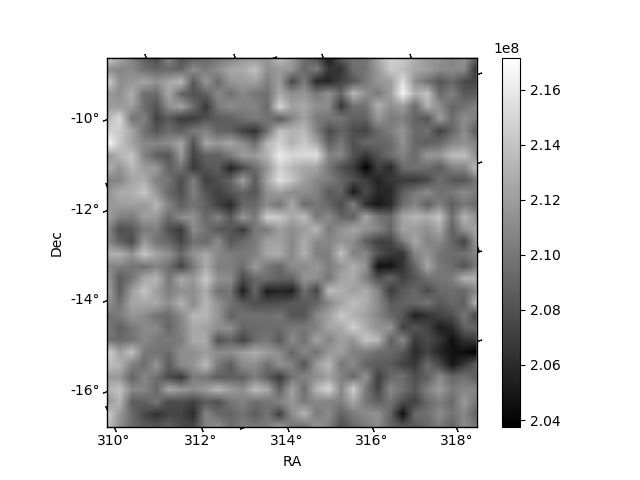
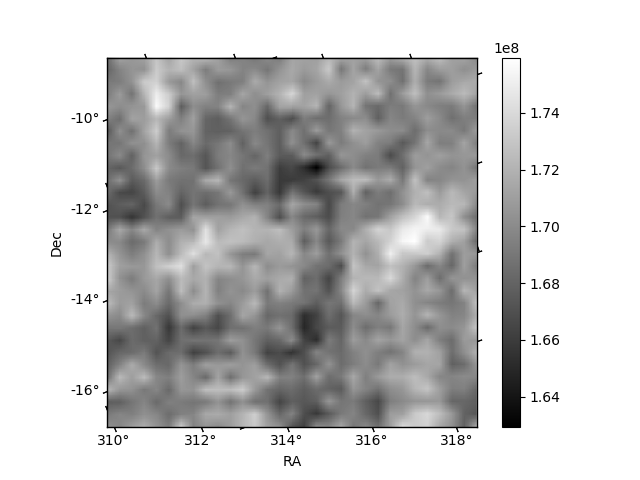
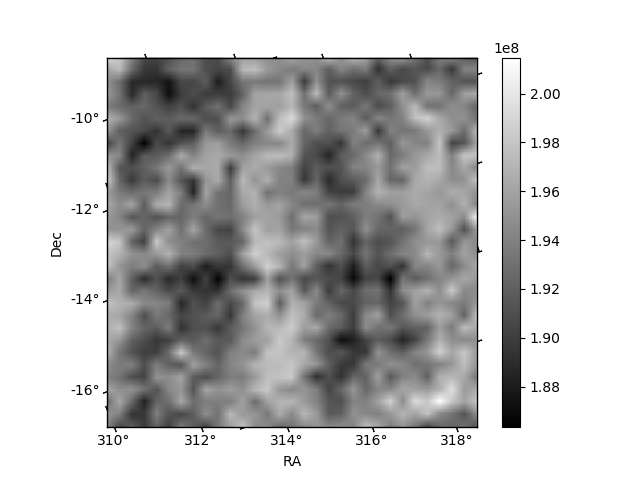
Histogram calculated using DETX and DETY for each event in the final _common_clean file
| Quadrant A |  |
 |
Quadrant B |
|---|---|---|---|
| Quadrant D |  |
 |
Quadrant C |
| Plot type | Count rate plots | Images |
|---|---|---|
| Comparison with Poisson distribution Blue bars denote a histogram of data divided into 1 sec bins. Red curve is a Poisson curve with rate = median count rate of data. |
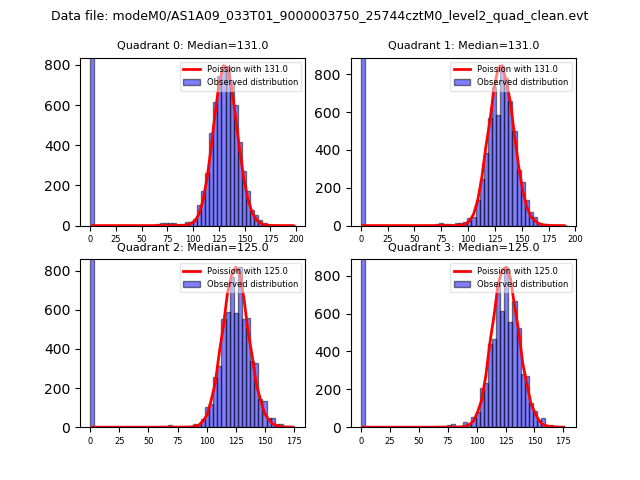 |
 |
| Quadrant-wise count rates Data is divided into 100 sec bins |
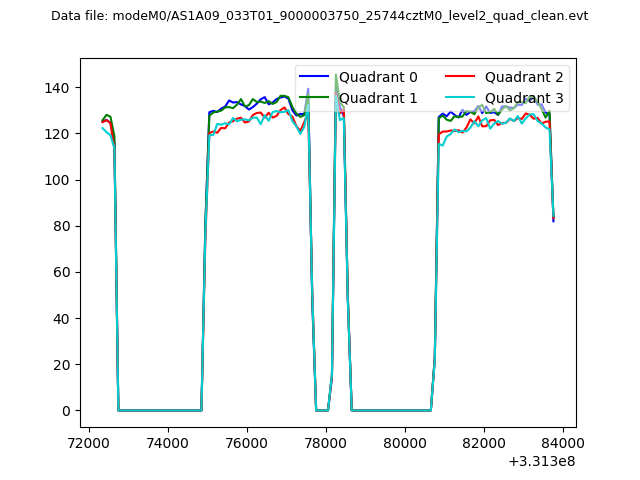 |
|
| Module-wise count rates for Quadrant A Data is divided into 100 sec bins |
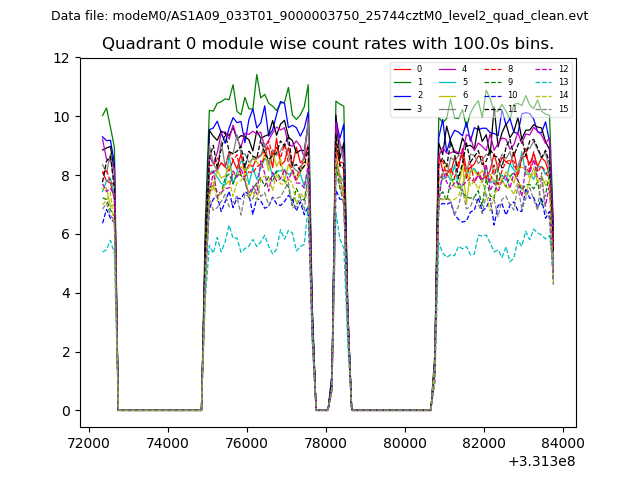 |
 |
| Module-wise count rates for Quadrant B Data is divided into 100 sec bins |
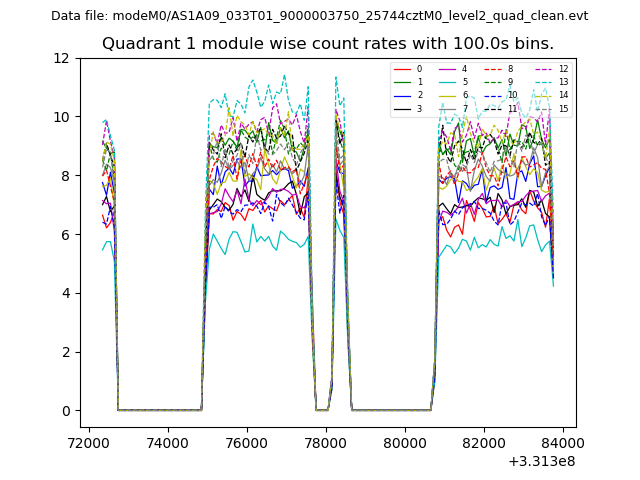 |
 |
| Module-wise count rates for Quadrant C Data is divided into 100 sec bins |
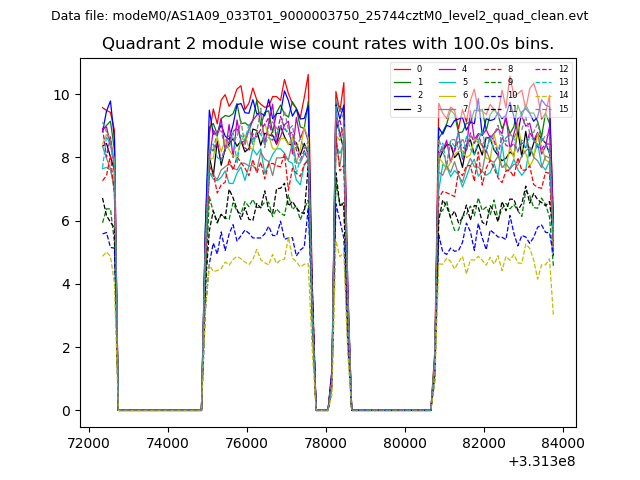 |
 |
| Module-wise count rates for Quadrant D Data is divided into 100 sec bins |
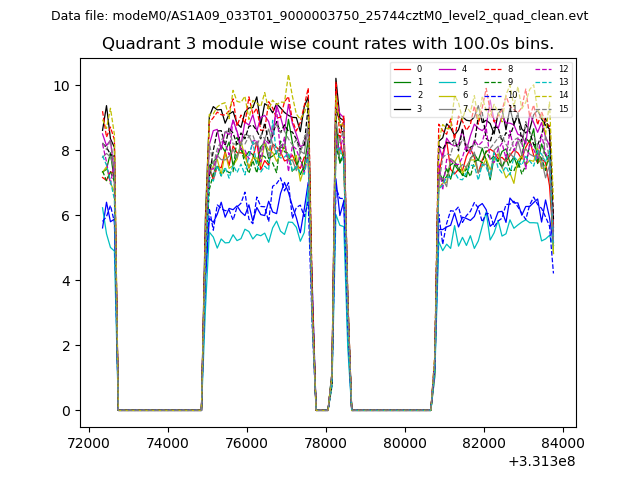 |
 |
| Parameter | Plot |
|---|---|
| CZT HV Monitor | 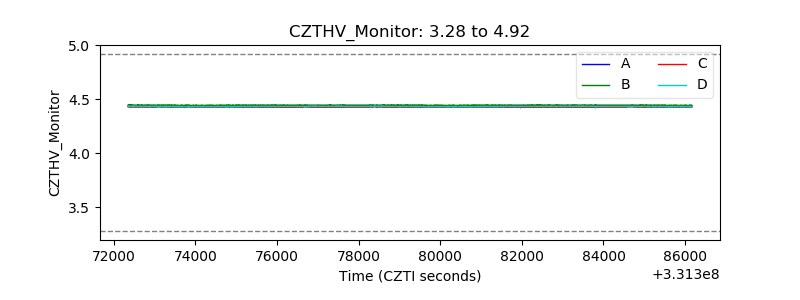 |
| D_VDD | 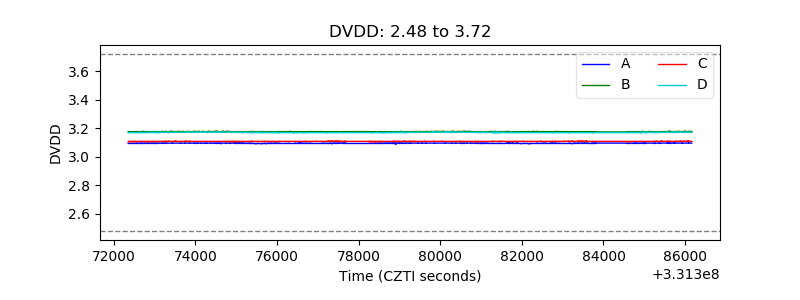 |
| Temperature 1 | 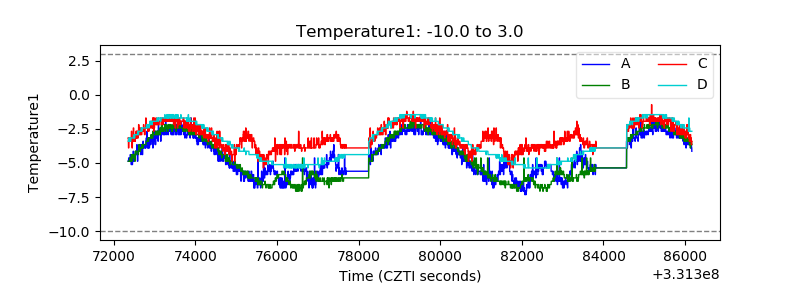 |
| Veto HV Monitor |  |
| Veto LLD | 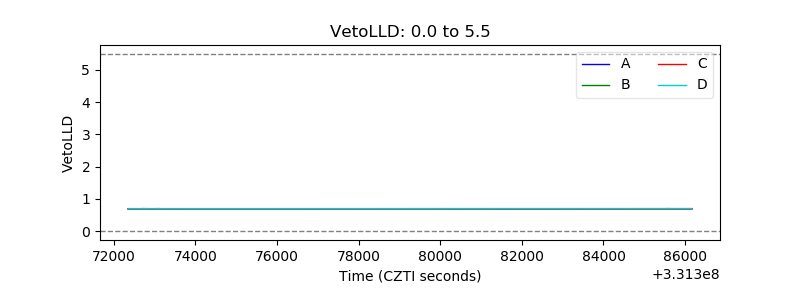 |
| Alpha Counter | 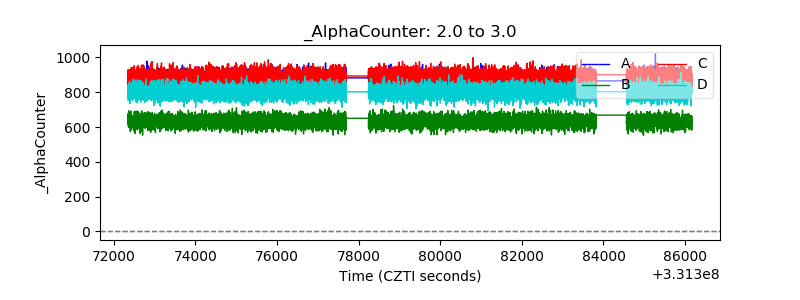 |
| _CPM_Rate |  |
| CZT Counter | 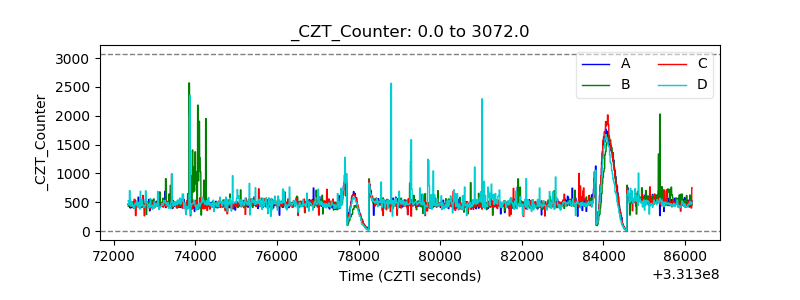 |
| +2.5 Volts monitor | 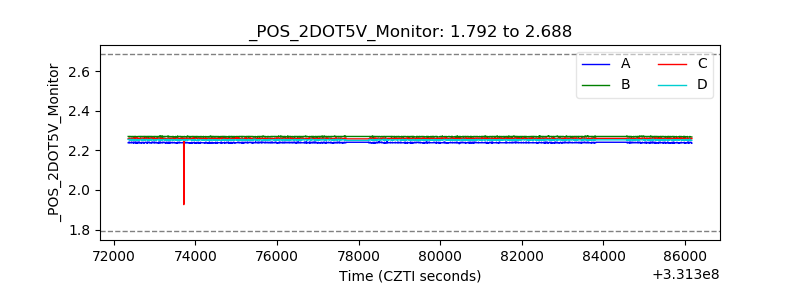 |
| +5 Volts monitor |  |
| _ROLL_ROT | 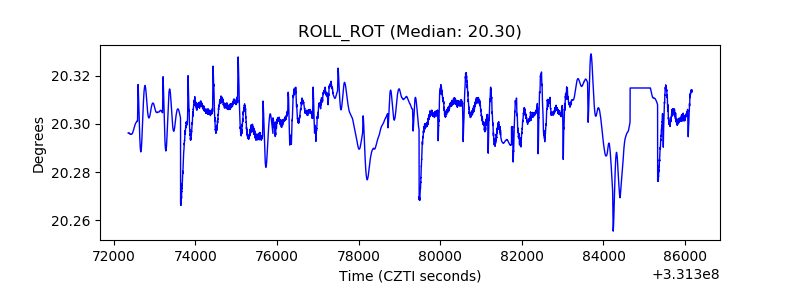 |
| _Roll_DEC | 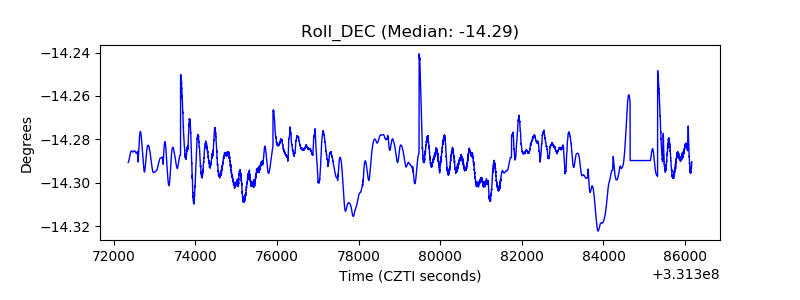 |
| _Roll_RA | 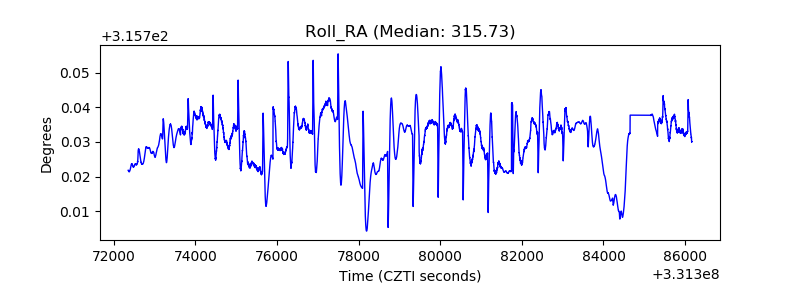 |
| Veto Counter | 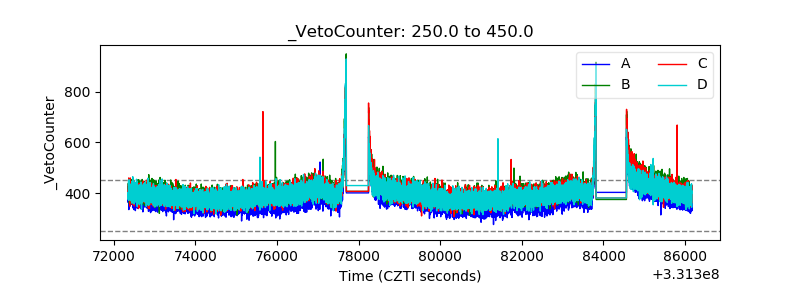 |