| Param | Original file | Final file |
|---|---|---|
| Filename | modeM0/AS1A09_033T01_9000003750_25745cztM0_level2.evt | modeM0/AS1A09_033T01_9000003750_25745cztM0_level2_quad_clean.evt |
| Size (bytes) | 468,239,040 | 70,444,800 |
| Size | 446.5 MB | 67.2 MB |
| Events in quadrant A | 3,365,856 | 425,575 |
| Events in quadrant B | 3,531,759 | 425,052 |
| Events in quadrant C | 3,362,958 | 405,023 |
| Events in quadrant D | 3,460,134 | 405,404 |
| Mode M0 | |||
|---|---|---|---|
| Quadrant | BADHDUFLAG | Total packets | Discarded packets |
| A | 0 | 14049 | 0 |
| B | 0 | 14748 | 0 |
| C | 0 | 14058 | 0 |
| D | 0 | 14633 | 0 |
| Mode M9 | |||
|---|---|---|---|
| Quadrant | BADHDUFLAG | Total packets | Discarded packets |
| A | 0 | 9 | 0 |
| B | 0 | 10 | 0 |
| C | 0 | 10 | 0 |
| D | 0 | 10 | 0 |
| Quadrant | Total seconds | Saturated seconds | Saturation percentage |
|---|---|---|---|
| A | 6768 | 51 | 0.753546% |
| B | 6768 | 68 | 1.004728% |
| C | 6768 | 79 | 1.167258% |
| D | 6767 | 72 | 1.063987% |
Noise dominated data is calculated using 1-second bins in cleaned event files. If a bin has >2000 counts, and if more than 50% of those come from <1% of pixels, then it is considered to be noise-dominated and hence unusable.
| Quadrant | # 1 sec bins | Bins with >0 counts | Bins with >2000 counts | High rate bins dominated by noise | Noise dominated (total time) | Noise dominated (detector-on time) | Marked lightcurve |
|---|---|---|---|---|---|---|---|
| A | 7693 | 6768 | 0 | 0 | 0.00% | 0.00% | 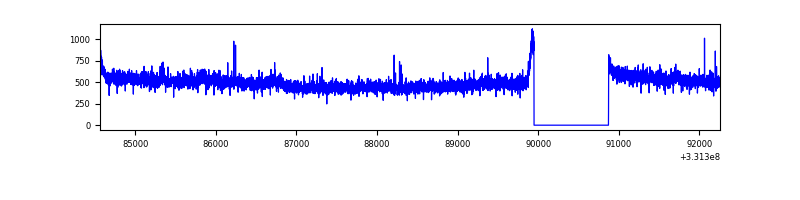 |
| B | 7693 | 6768 | 6 | 6 | 0.08% | 0.09% | 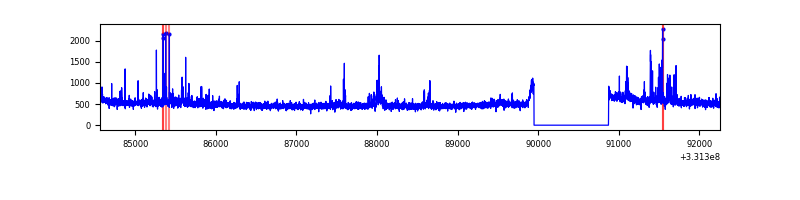 |
| C | 7693 | 6768 | 0 | 0 | 0.00% | 0.00% | 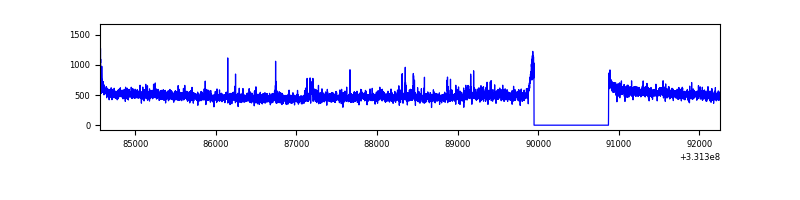 |
| D | 7692 | 6767 | 34 | 34 | 0.44% | 0.50% | 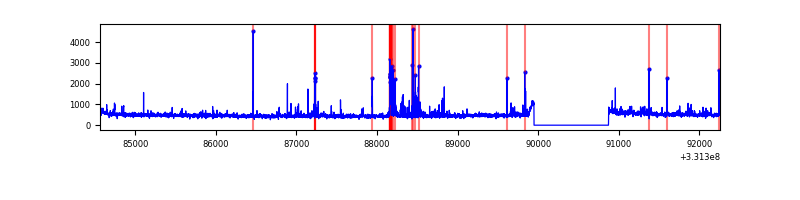 |
Top three noisy pixels from each quadrant. If the there are fewer than three noisy pixels in the level2.evt file, extra rows are filled as -1
| Pixel properties | Quadrant properties | ||||||
|---|---|---|---|---|---|---|---|
| Quadrant | DetID | PixID | Counts | Sigma | Mean | Median | Sigma |
| A | 10 | 17 | 60883 | 349.27 | 853 | 836 | 171.9 |
| A | 6 | 16 | 12127 | 65.68 | 853 | 836 | 171.9 |
| A | 13 | 254 | 10384 | 55.54 | 853 | 836 | 171.9 |
| B | 15 | 222 | 162700 | 1005.88 | 841 | 820 | 160.9 |
| B | 0 | 245 | 25382 | 152.62 | 841 | 820 | 160.9 |
| B | 0 | 190 | 23780 | 142.67 | 841 | 820 | 160.9 |
| C | 14 | 238 | 130252 | 675.32 | 812 | 816 | 191.7 |
| C | 3 | 233 | 63062 | 324.76 | 812 | 816 | 191.7 |
| C | 13 | 61 | 5463 | 24.24 | 812 | 816 | 191.7 |
| D | 1 | 52 | 162428 | 803.0 | 829 | 805 | 201.3 |
| D | 13 | 104 | 96190 | 473.9 | 829 | 805 | 201.3 |
| D | 2 | 234 | 29265 | 141.4 | 829 | 805 | 201.3 |
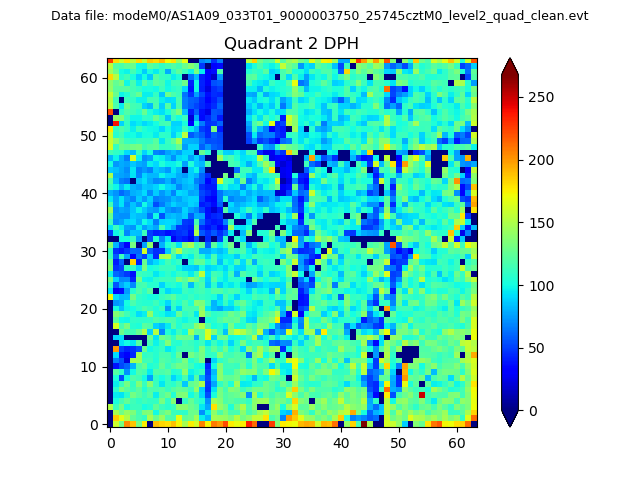
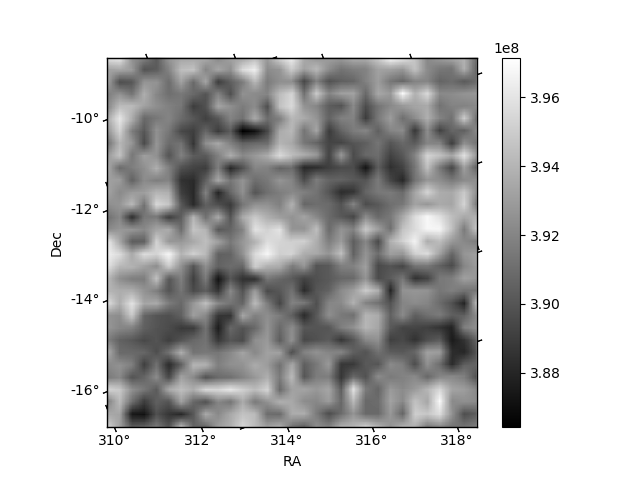
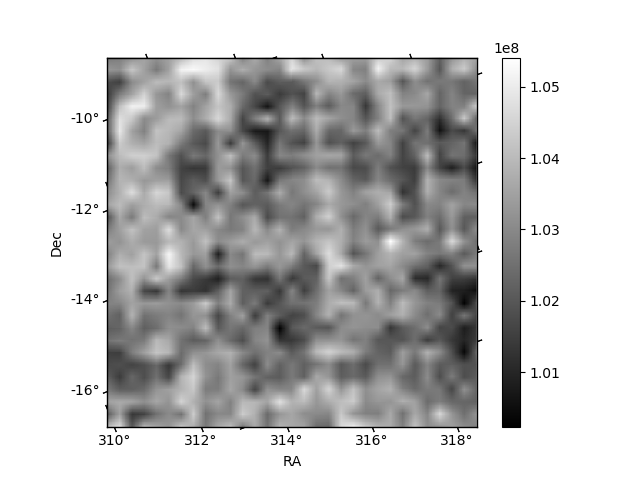
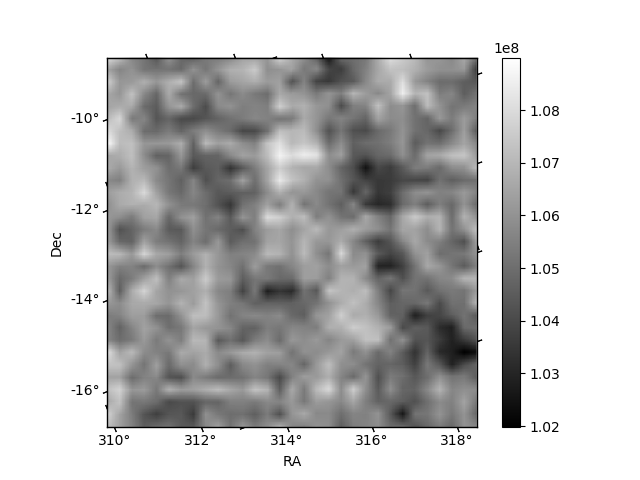
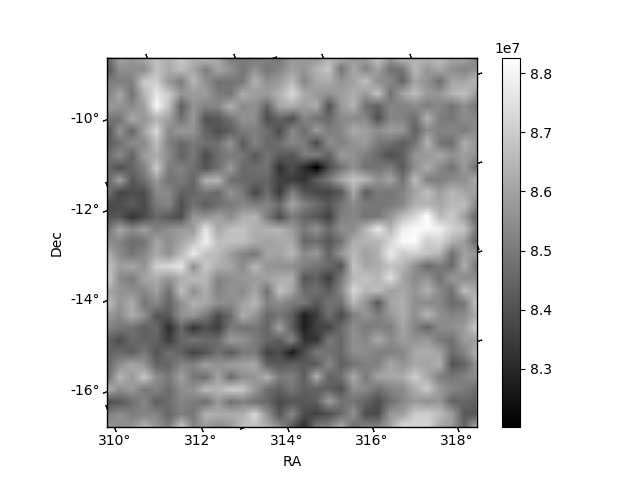
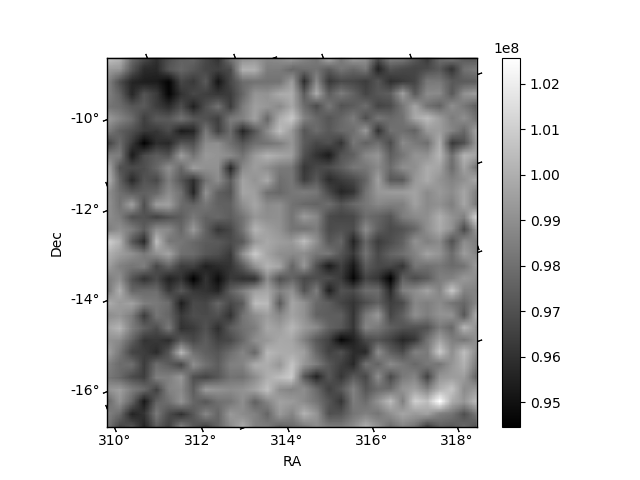
Histogram calculated using DETX and DETY for each event in the final _common_clean file
| Quadrant A | 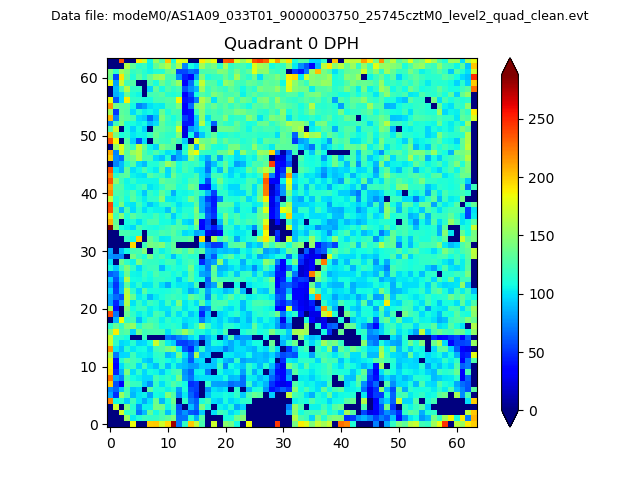 |
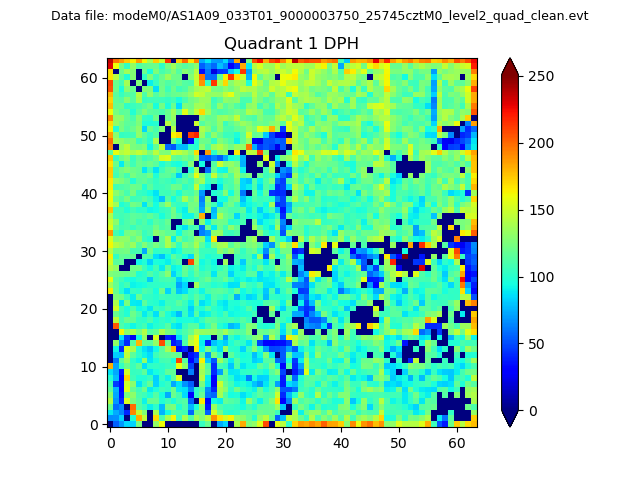 |
Quadrant B |
|---|---|---|---|
| Quadrant D | 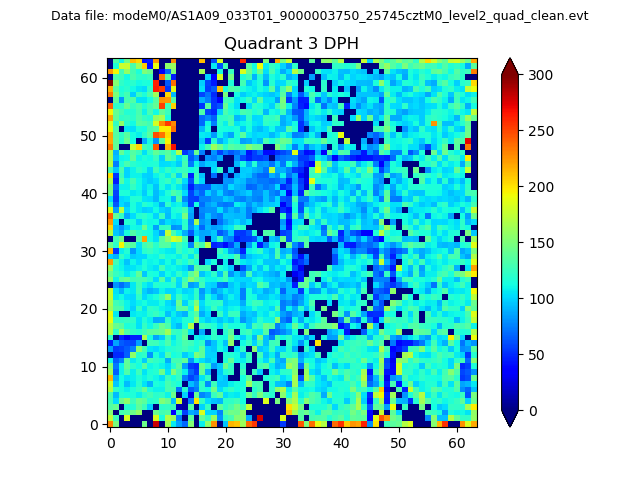 |
 |
Quadrant C |
| Plot type | Count rate plots | Images |
|---|---|---|
| Comparison with Poisson distribution Blue bars denote a histogram of data divided into 1 sec bins. Red curve is a Poisson curve with rate = median count rate of data. |
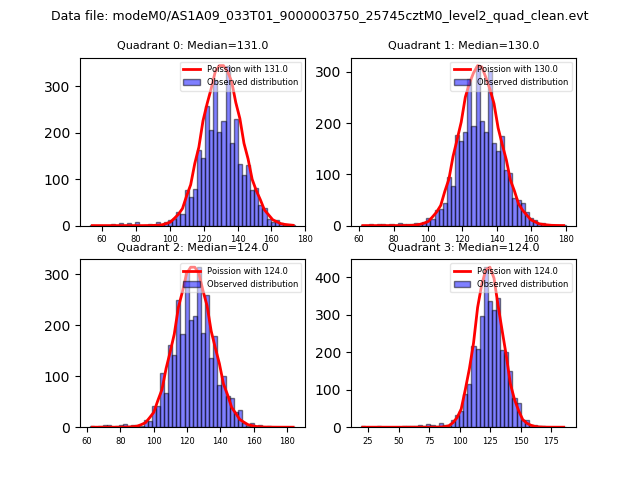 |
 |
| Quadrant-wise count rates Data is divided into 100 sec bins |
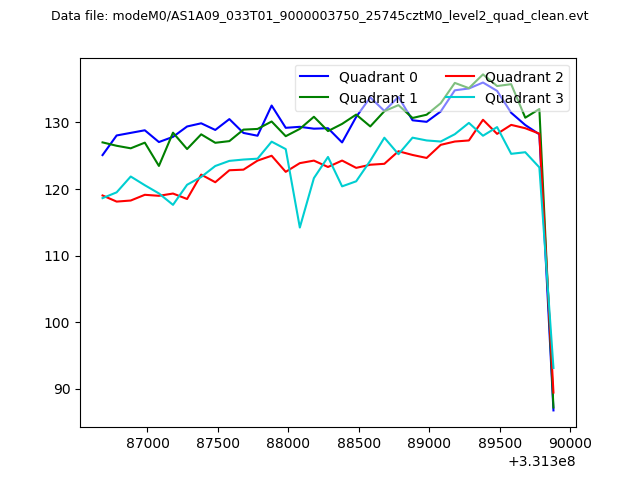 |
|
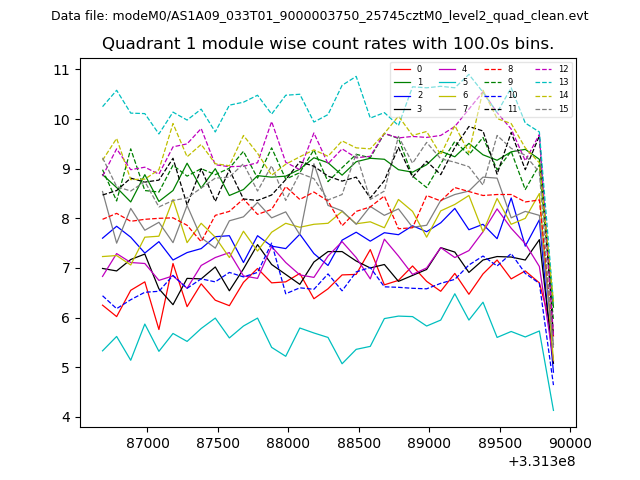
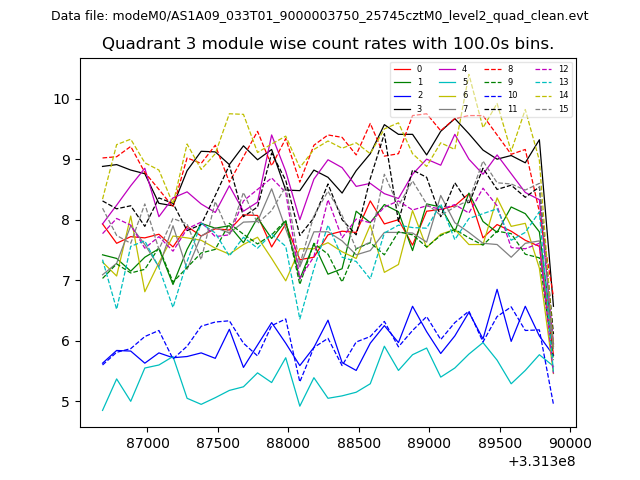
| Module-wise count rates for Quadrant A Data is divided into 100 sec bins |
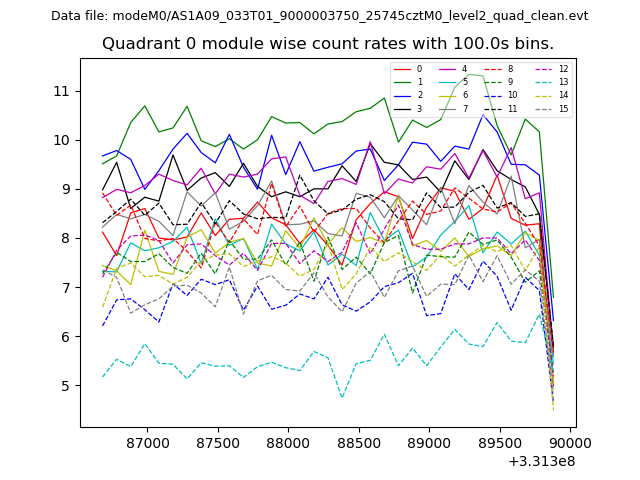 |
 |
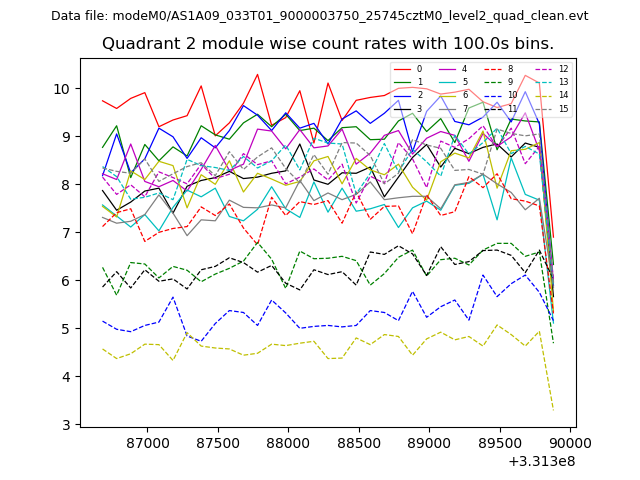
| Module-wise count rates for Quadrant B Data is divided into 100 sec bins |
 |
 |
| Module-wise count rates for Quadrant C Data is divided into 100 sec bins |
 |
 |
| Module-wise count rates for Quadrant D Data is divided into 100 sec bins |
 |
 |
| Parameter | Plot |
|---|---|
| CZT HV Monitor | 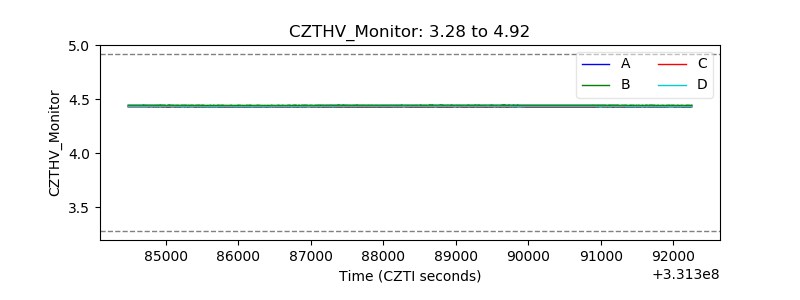 |
| D_VDD | 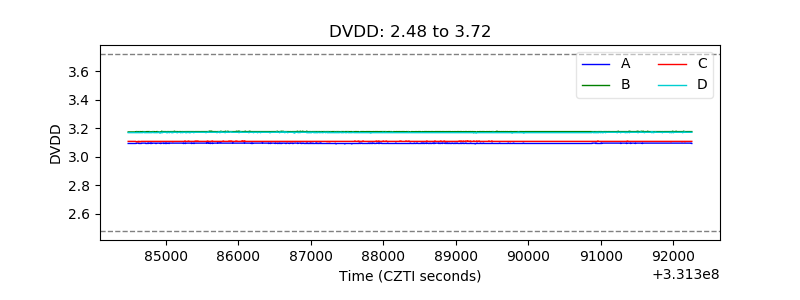 |
| Temperature 1 |  |
| Veto HV Monitor | 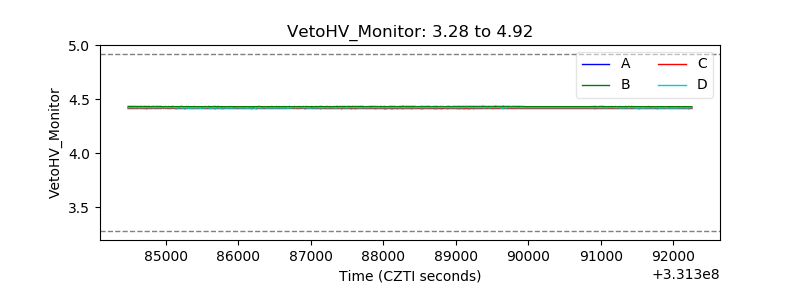 |
| Veto LLD | 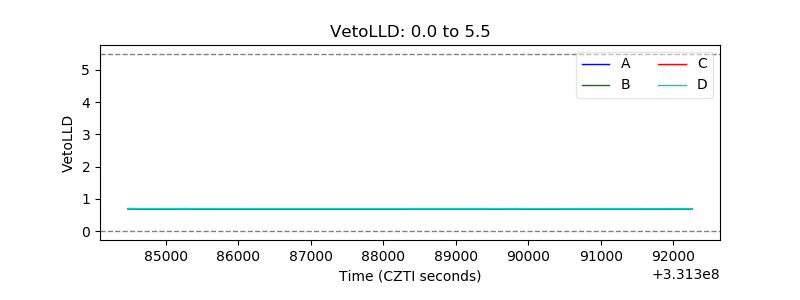 |
| Alpha Counter | 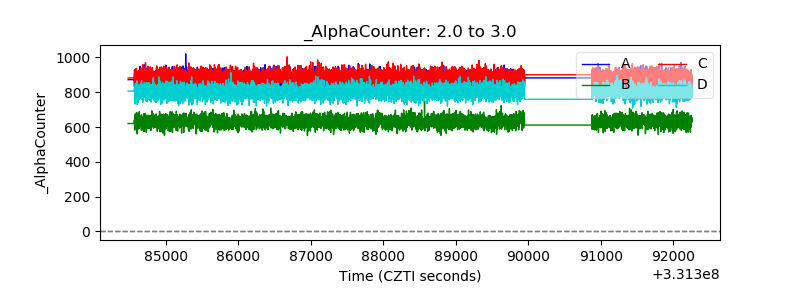 |
| _CPM_Rate | 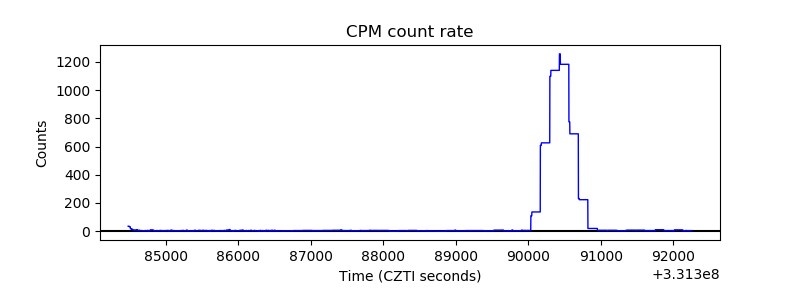 |
| CZT Counter | 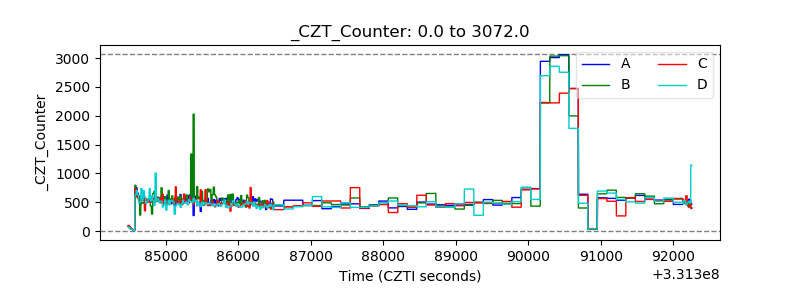 |
| +2.5 Volts monitor |  |
| +5 Volts monitor |  |
| _ROLL_ROT | 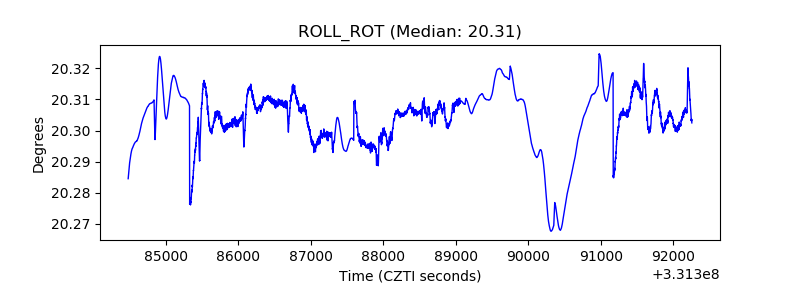 |
| _Roll_DEC | 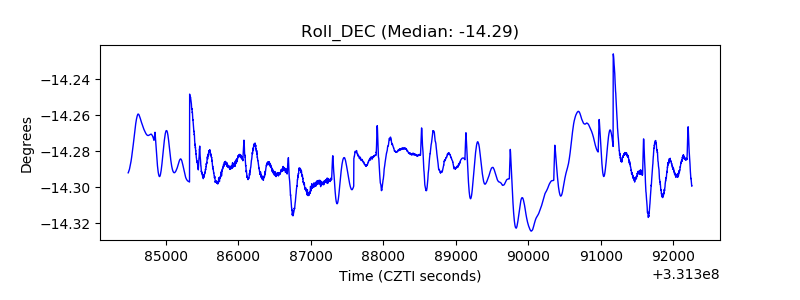 |
| _Roll_RA | 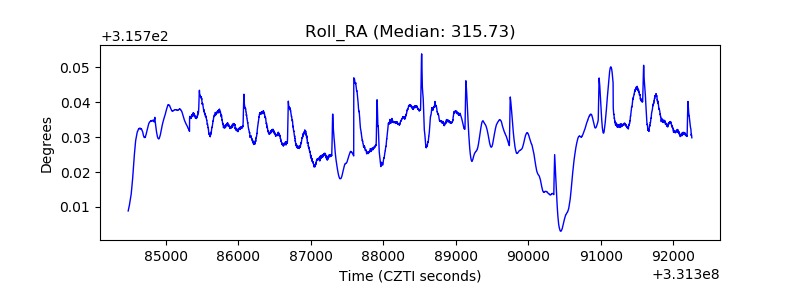 |
| Veto Counter | 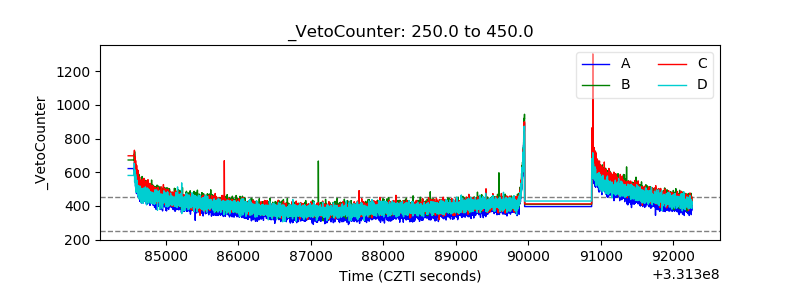 |