| Param | Original file | Final file |
|---|---|---|
| Filename | modeM0/AS1A09_033T01_9000003750_25746cztM0_level2.evt | modeM0/AS1A09_033T01_9000003750_25746cztM0_level2_quad_clean.evt |
| Size (bytes) | 476,395,200 | 79,174,080 |
| Size | 454.3 MB | 75.5 MB |
| Events in quadrant A | 3,351,129 | 495,789 |
| Events in quadrant B | 3,485,662 | 496,571 |
| Events in quadrant C | 3,384,908 | 473,741 |
| Events in quadrant D | 3,757,032 | 470,552 |
| Mode M0 | |||
|---|---|---|---|
| Quadrant | BADHDUFLAG | Total packets | Discarded packets |
| A | 0 | 14095 | 0 |
| B | 0 | 14699 | 0 |
| C | 0 | 14132 | 0 |
| D | 0 | 15530 | 0 |
| Mode M9 | |||
|---|---|---|---|
| Quadrant | BADHDUFLAG | Total packets | Discarded packets |
| A | 0 | 19 | 0 |
| B | 0 | 19 | 0 |
| C | 0 | 19 | 0 |
| D | 0 | 19 | 0 |
| Quadrant | Total seconds | Saturated seconds | Saturation percentage |
|---|---|---|---|
| A | 6602 | 82 | 1.242048% |
| B | 6603 | 94 | 1.423595% |
| C | 6603 | 117 | 1.771922% |
| D | 6602 | 137 | 2.075129% |
Noise dominated data is calculated using 1-second bins in cleaned event files. If a bin has >2000 counts, and if more than 50% of those come from <1% of pixels, then it is considered to be noise-dominated and hence unusable.
| Quadrant | # 1 sec bins | Bins with >0 counts | Bins with >2000 counts | High rate bins dominated by noise | Noise dominated (total time) | Noise dominated (detector-on time) | Marked lightcurve |
|---|---|---|---|---|---|---|---|
| A | 8602 | 6602 | 0 | 0 | 0.00% | 0.00% | 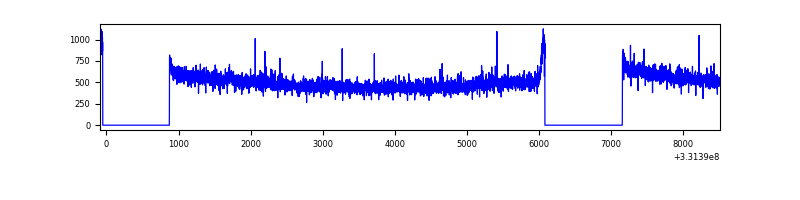 |
| B | 8603 | 6603 | 4 | 4 | 0.05% | 0.06% | 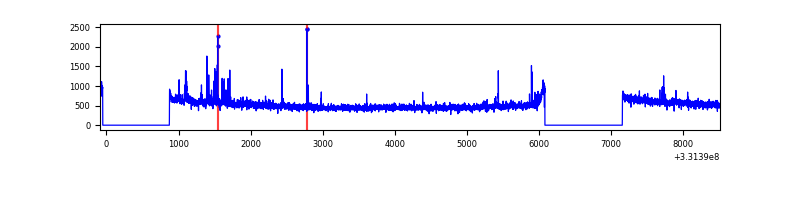 |
| C | 8603 | 6603 | 0 | 0 | 0.00% | 0.00% | 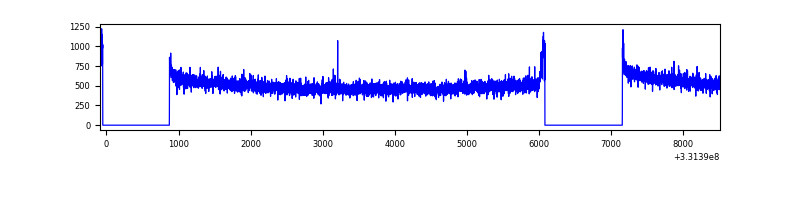 |
| D | 8602 | 6602 | 65 | 65 | 0.76% | 0.98% | 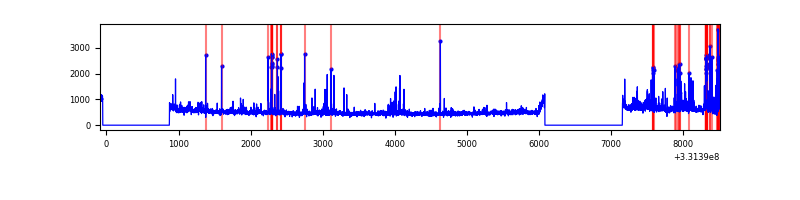 |
Top three noisy pixels from each quadrant. If the there are fewer than three noisy pixels in the level2.evt file, extra rows are filled as -1
| Pixel properties | Quadrant properties | ||||||
|---|---|---|---|---|---|---|---|
| Quadrant | DetID | PixID | Counts | Sigma | Mean | Median | Sigma |
| A | 6 | 16 | 38993 | 223.78 | 859 | 841 | 170.5 |
| A | 13 | 254 | 10031 | 53.9 | 859 | 841 | 170.5 |
| A | 3 | 137 | 7858 | 41.16 | 859 | 841 | 170.5 |
| B | 15 | 222 | 96771 | 594.64 | 852 | 833 | 161.3 |
| B | 0 | 190 | 19923 | 118.32 | 852 | 833 | 161.3 |
| B | 12 | 111 | 19602 | 116.33 | 852 | 833 | 161.3 |
| C | 14 | 238 | 134188 | 690.76 | 824 | 830 | 193.1 |
| C | 3 | 233 | 35444 | 179.29 | 824 | 830 | 193.1 |
| C | 13 | 61 | 5521 | 24.3 | 824 | 830 | 193.1 |
| D | 1 | 52 | 267808 | 1323.44 | 835 | 814 | 201.7 |
| D | 13 | 104 | 135697 | 668.59 | 835 | 814 | 201.7 |
| D | 8 | 195 | 115601 | 568.98 | 835 | 814 | 201.7 |
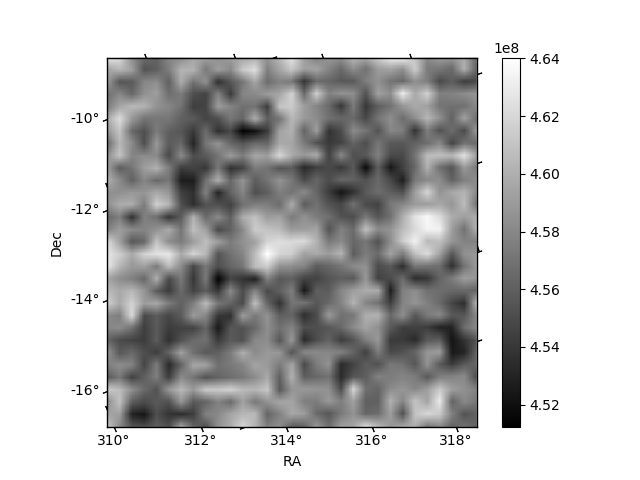
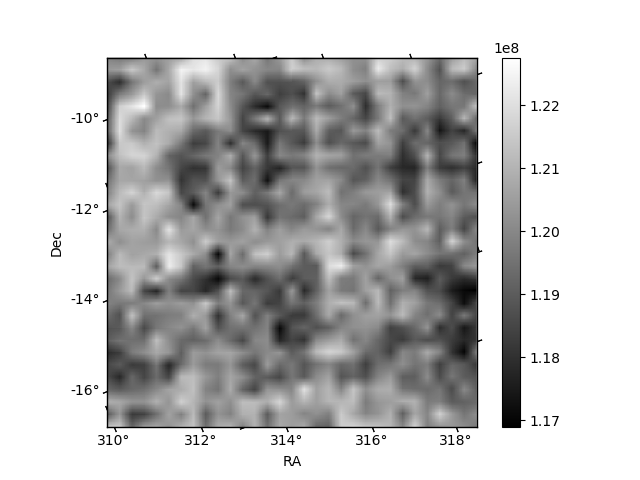
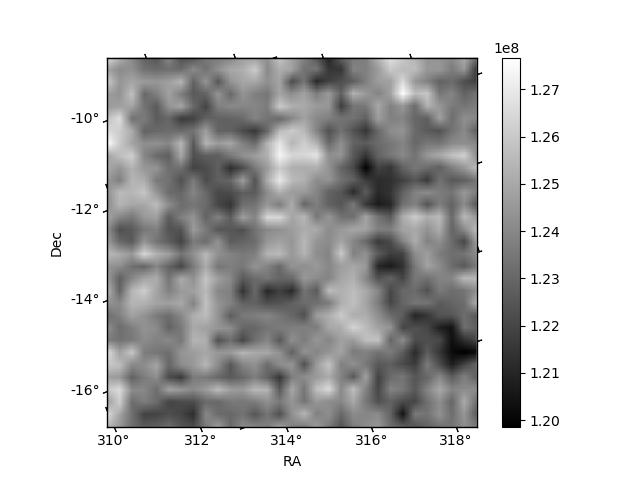
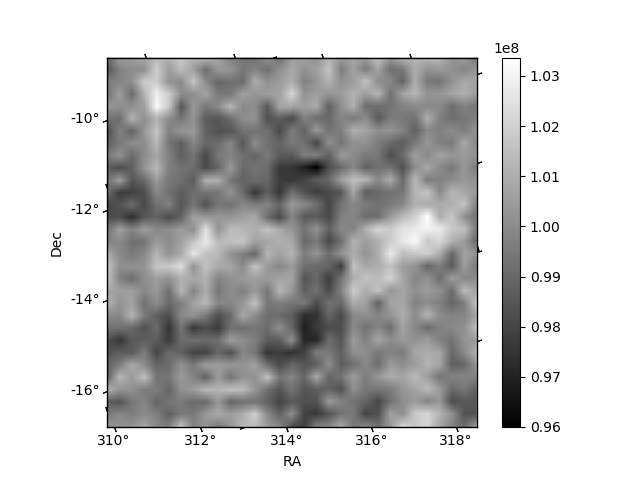
Histogram calculated using DETX and DETY for each event in the final _common_clean file
| Quadrant A | 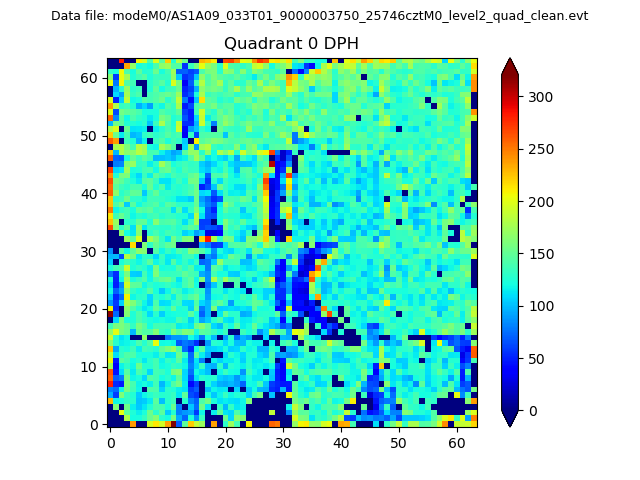 |
 |
Quadrant B |
|---|---|---|---|
| Quadrant D | 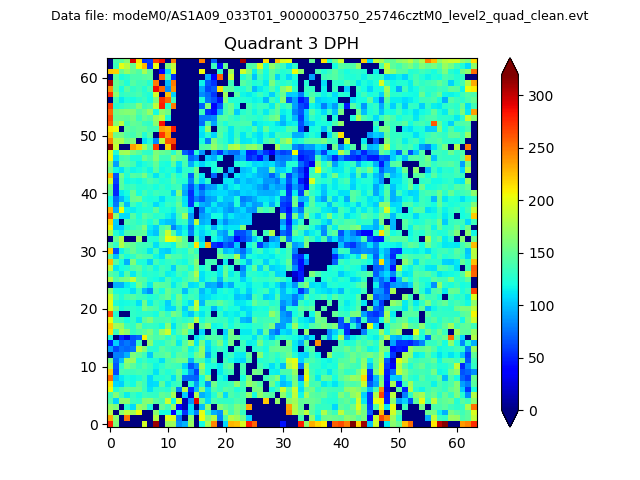 |
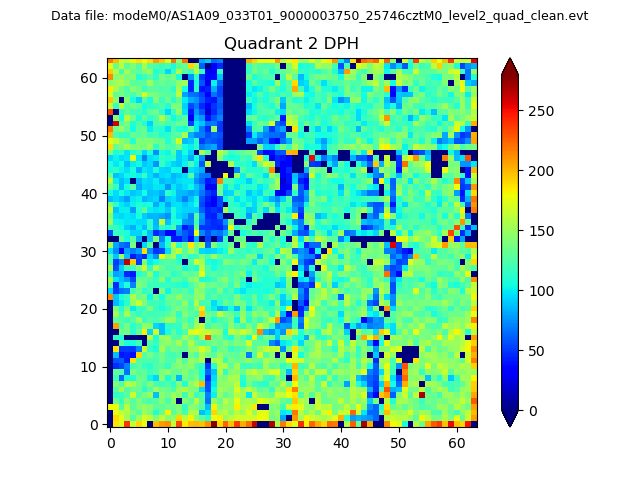 |
Quadrant C |
| Plot type | Count rate plots | Images |
|---|---|---|
| Comparison with Poisson distribution Blue bars denote a histogram of data divided into 1 sec bins. Red curve is a Poisson curve with rate = median count rate of data. |
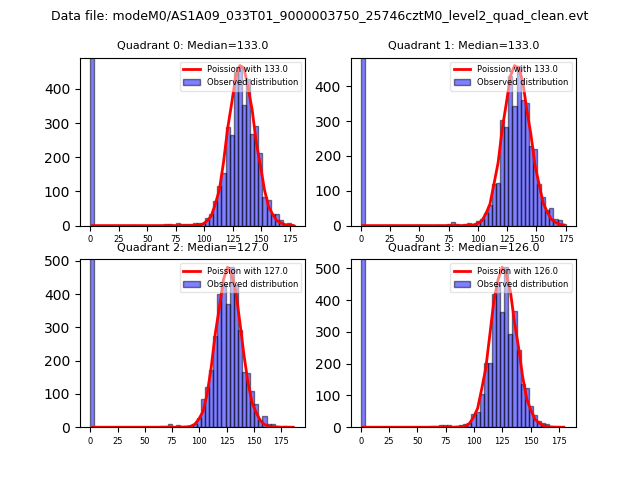 |
 |
| Quadrant-wise count rates Data is divided into 100 sec bins |
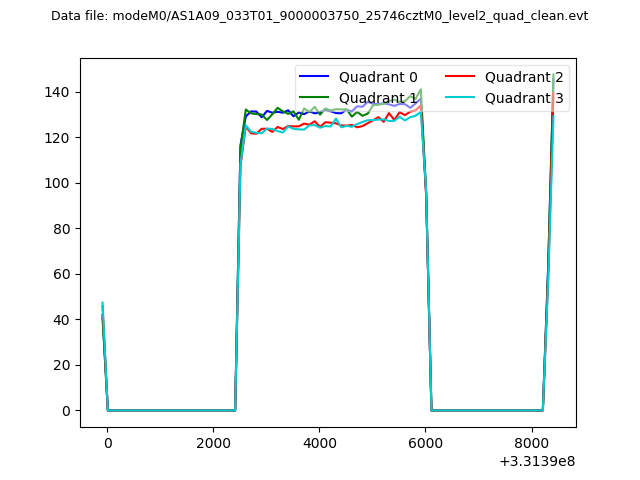 |
|
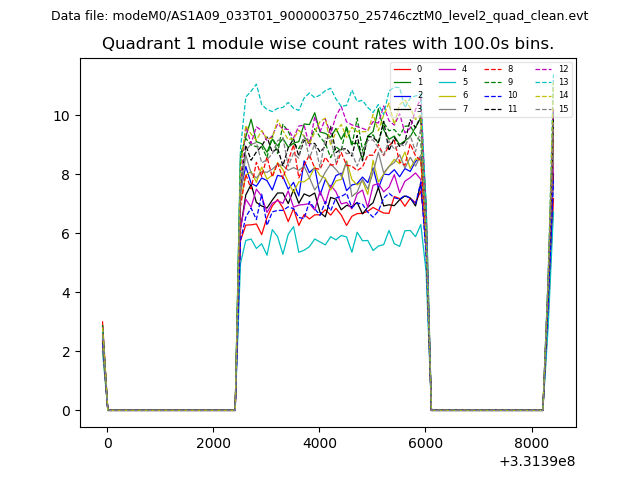
| Module-wise count rates for Quadrant A Data is divided into 100 sec bins |
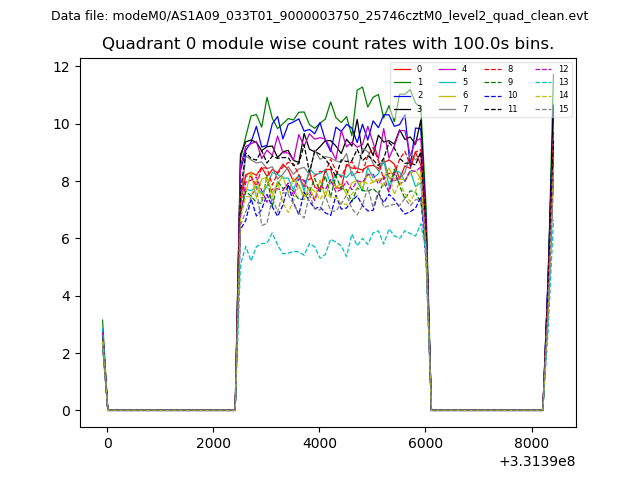 |
 |
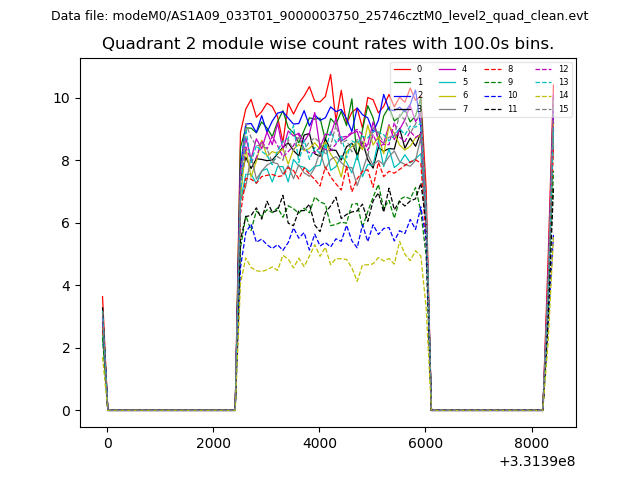
| Module-wise count rates for Quadrant B Data is divided into 100 sec bins |
 |
 |
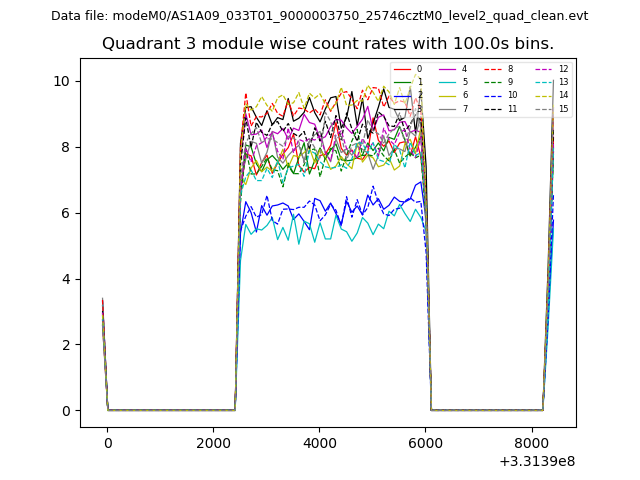
| Module-wise count rates for Quadrant C Data is divided into 100 sec bins |
 |
 |
| Module-wise count rates for Quadrant D Data is divided into 100 sec bins |
 |
 |
| Parameter | Plot |
|---|---|
| CZT HV Monitor | 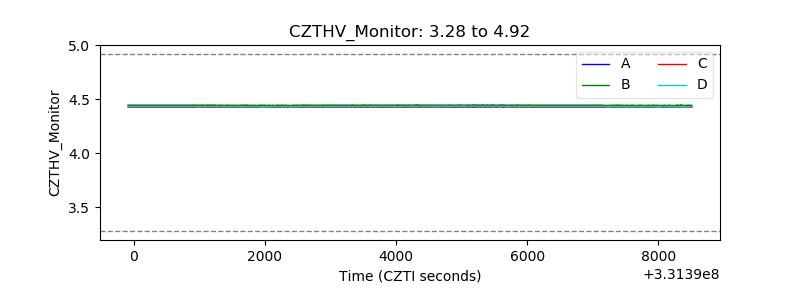 |
| D_VDD | 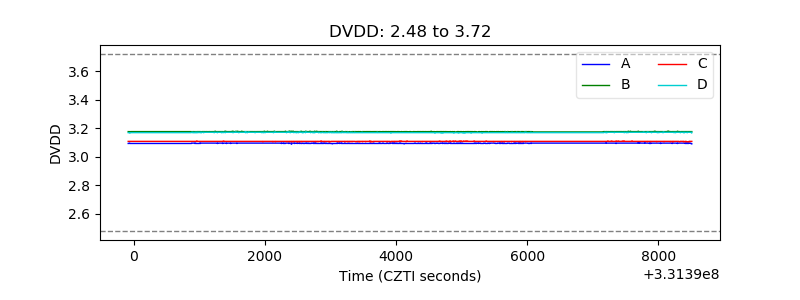 |
| Temperature 1 | 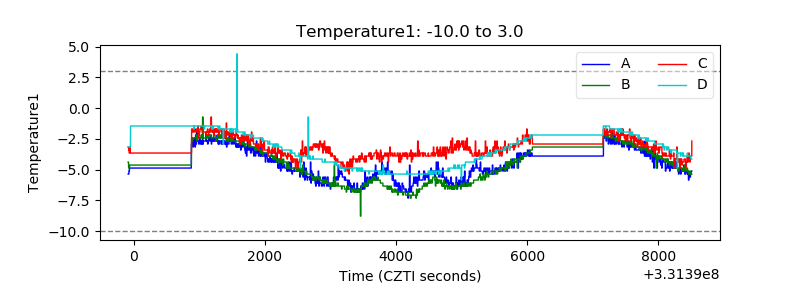 |
| Veto HV Monitor | 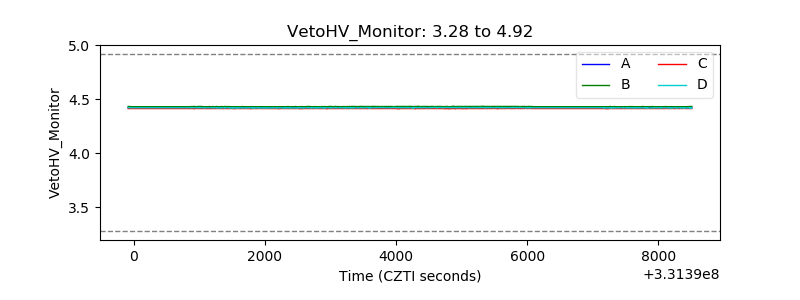 |
| Veto LLD | 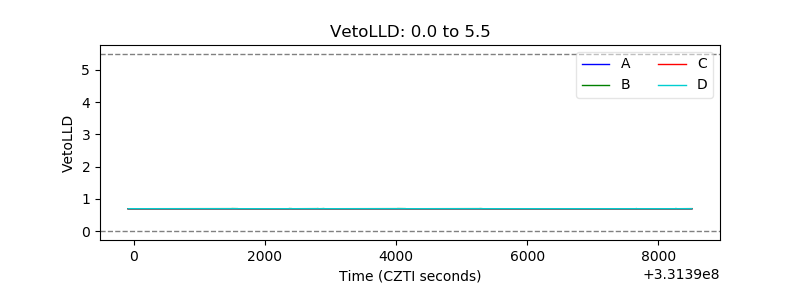 |
| Alpha Counter | 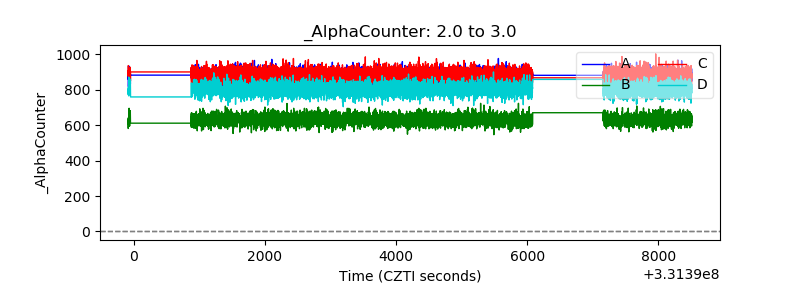 |
| _CPM_Rate | 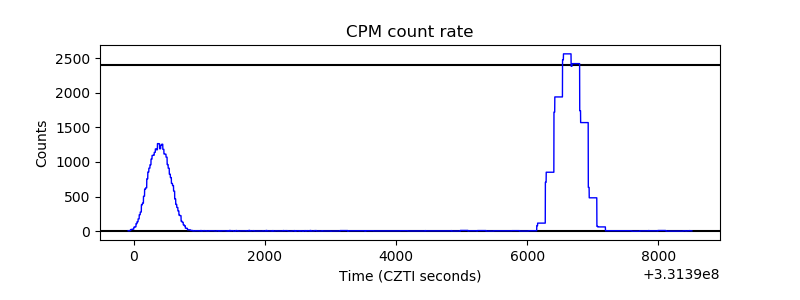 |
| CZT Counter | 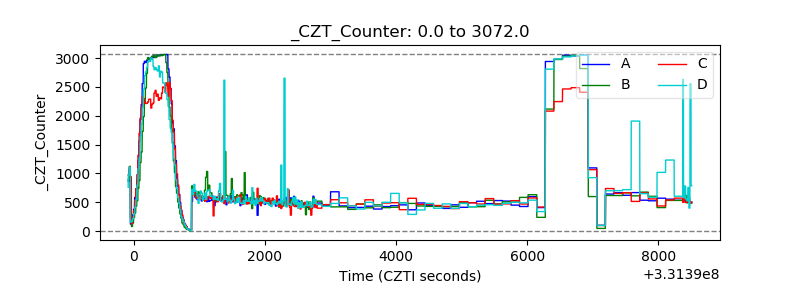 |
| +2.5 Volts monitor |  |
| +5 Volts monitor |  |
| _ROLL_ROT | 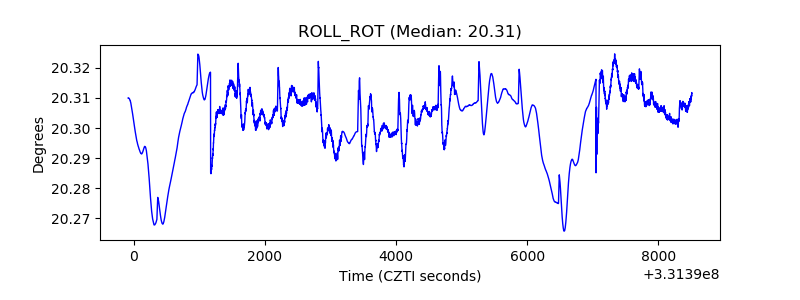 |
| _Roll_DEC | 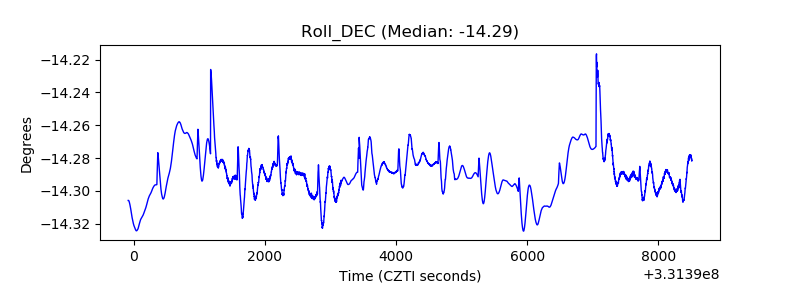 |
| _Roll_RA | 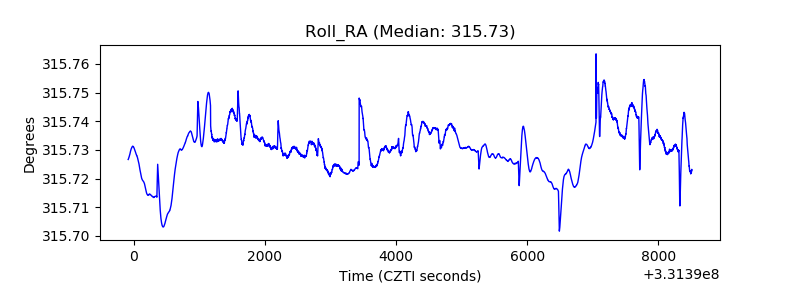 |
| Veto Counter | 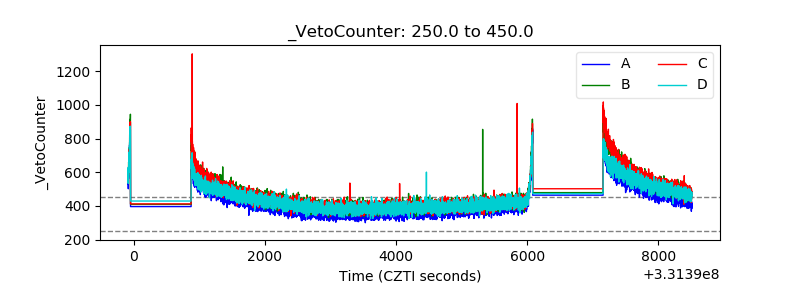 |