| Param | Original file | Final file |
|---|---|---|
| Filename | modeM0/AS1A09_033T01_9000003750_25748cztM0_level2.evt | modeM0/AS1A09_033T01_9000003750_25748cztM0_level2_quad_clean.evt |
| Size (bytes) | 505,298,880 | 89,205,120 |
| Size | 481.9 MB | 85.1 MB |
| Events in quadrant A | 3,290,397 | 579,221 |
| Events in quadrant B | 3,790,280 | 580,367 |
| Events in quadrant C | 3,669,478 | 554,428 |
| Events in quadrant D | 4,123,037 | 545,380 |
| Mode M0 | |||
|---|---|---|---|
| Quadrant | BADHDUFLAG | Total packets | Discarded packets |
| A | 0 | 13892 | 0 |
| B | 0 | 15451 | 0 |
| C | 0 | 14983 | 0 |
| D | 0 | 16528 | 0 |
| Mode M9 | |||
|---|---|---|---|
| Quadrant | BADHDUFLAG | Total packets | Discarded packets |
| A | 0 | 12 | 0 |
| B | 0 | 12 | 0 |
| C | 0 | 12 | 0 |
| D | 0 | 12 | 0 |
| Quadrant | Total seconds | Saturated seconds | Saturation percentage |
|---|---|---|---|
| A | 6335 | 42 | 0.662983% |
| B | 6336 | 152 | 2.398990% |
| C | 6336 | 202 | 3.188131% |
| D | 6336 | 148 | 2.335859% |
Noise dominated data is calculated using 1-second bins in cleaned event files. If a bin has >2000 counts, and if more than 50% of those come from <1% of pixels, then it is considered to be noise-dominated and hence unusable.
| Quadrant | # 1 sec bins | Bins with >0 counts | Bins with >2000 counts | High rate bins dominated by noise | Noise dominated (total time) | Noise dominated (detector-on time) | Marked lightcurve |
|---|---|---|---|---|---|---|---|
| A | 7535 | 6335 | 0 | 0 | 0.00% | 0.00% | 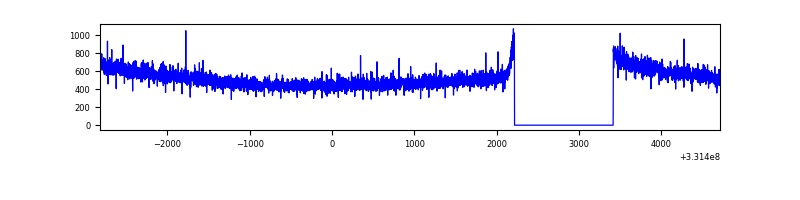 |
| B | 7536 | 6336 | 82 | 82 | 1.09% | 1.29% | 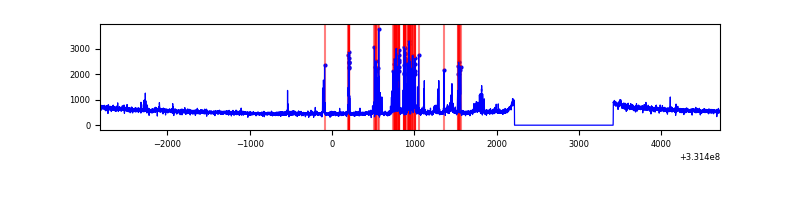 |
| C | 7536 | 6336 | 57 | 57 | 0.76% | 0.90% | 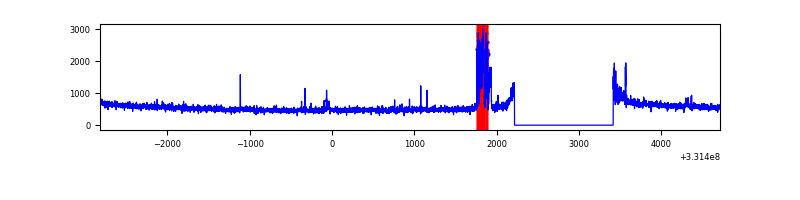 |
| D | 7536 | 6336 | 101 | 101 | 1.34% | 1.59% | 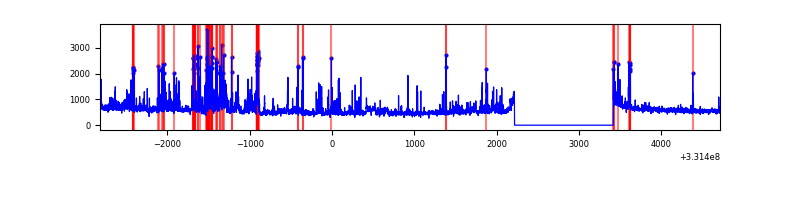 |
Top three noisy pixels from each quadrant. If the there are fewer than three noisy pixels in the level2.evt file, extra rows are filled as -1
| Pixel properties | Quadrant properties | ||||||
|---|---|---|---|---|---|---|---|
| Quadrant | DetID | PixID | Counts | Sigma | Mean | Median | Sigma |
| A | 13 | 254 | 10296 | 55.83 | 852 | 837 | 169.4 |
| A | 3 | 137 | 7662 | 40.29 | 852 | 837 | 169.4 |
| A | 0 | 226 | 7149 | 37.26 | 852 | 837 | 169.4 |
| B | 15 | 222 | 432455 | 2688.4 | 848 | 829 | 160.6 |
| B | 12 | 111 | 18848 | 112.23 | 848 | 829 | 160.6 |
| B | 0 | 190 | 18122 | 107.71 | 848 | 829 | 160.6 |
| C | 3 | 233 | 329803 | 1716.14 | 820 | 828 | 191.7 |
| C | 14 | 238 | 133910 | 694.24 | 820 | 828 | 191.7 |
| C | 1 | 16 | 7653 | 35.6 | 820 | 828 | 191.7 |
| D | 1 | 52 | 427786 | 2135.75 | 829 | 807 | 199.9 |
| D | 8 | 195 | 161158 | 802.08 | 829 | 807 | 199.9 |
| D | 12 | 233 | 156323 | 777.89 | 829 | 807 | 199.9 |
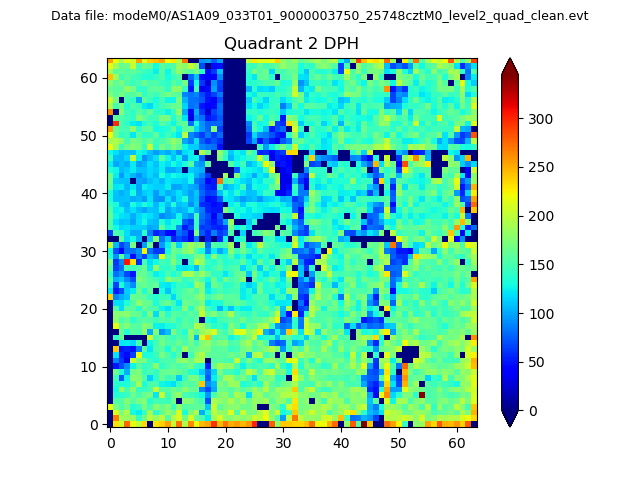
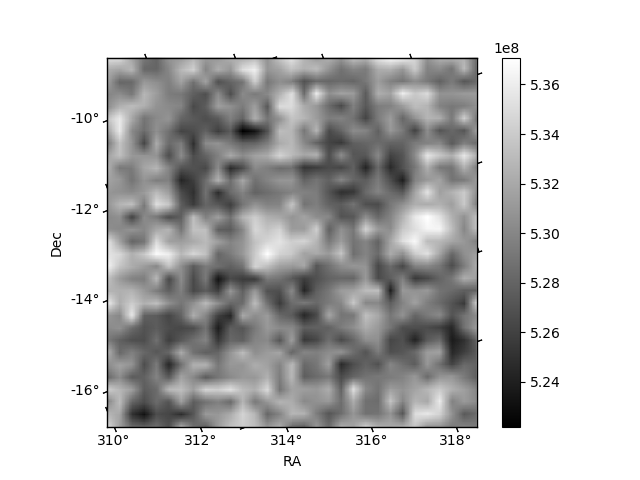
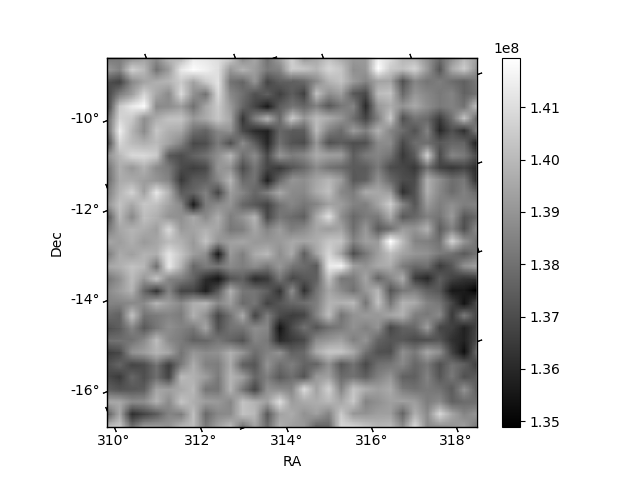
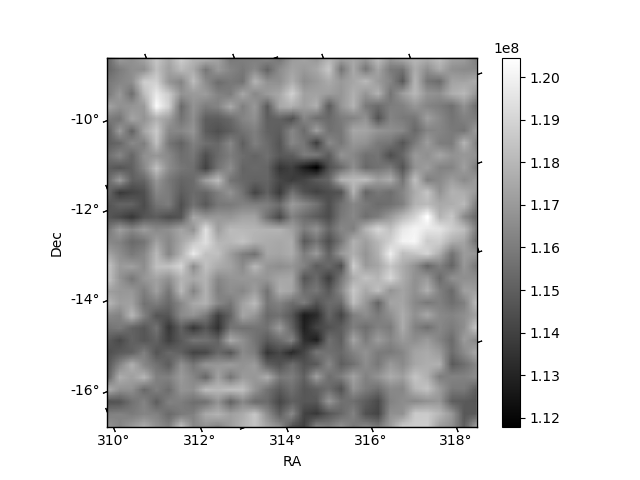
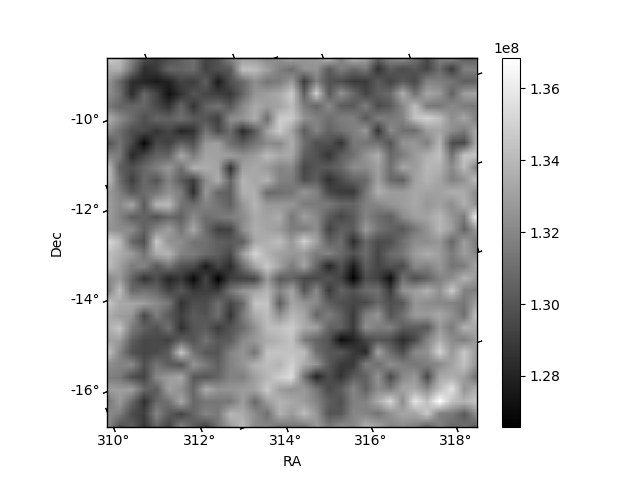
Histogram calculated using DETX and DETY for each event in the final _common_clean file
| Quadrant A | 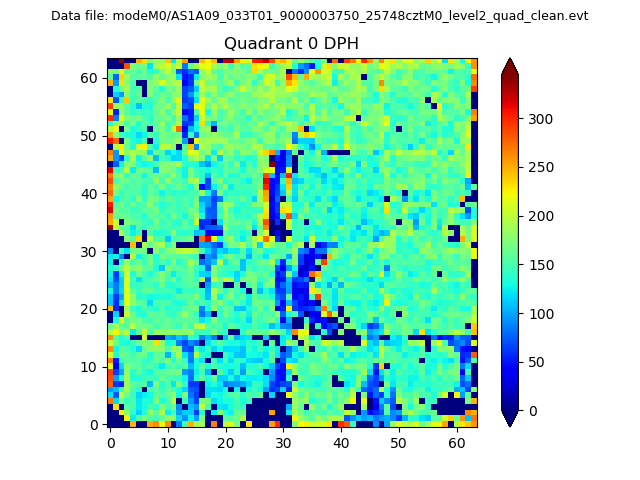 |
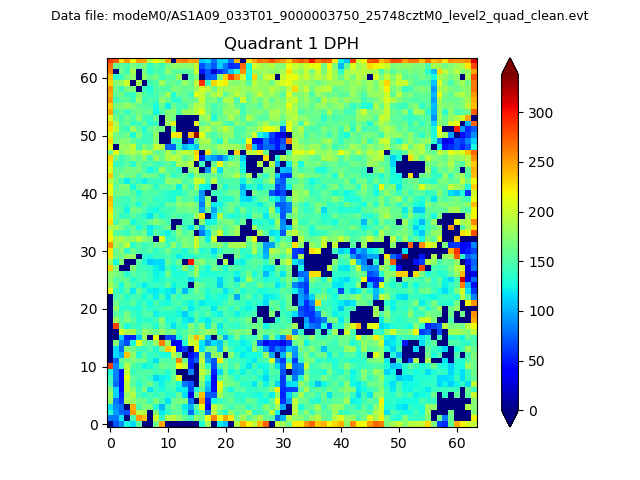 |
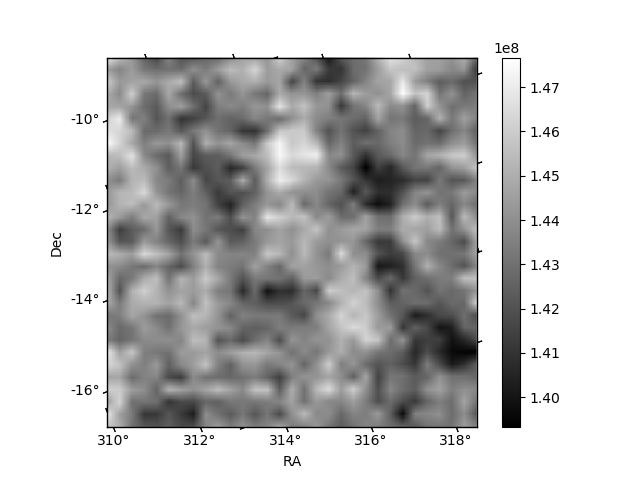
Quadrant B |
|---|---|---|---|
| Quadrant D | 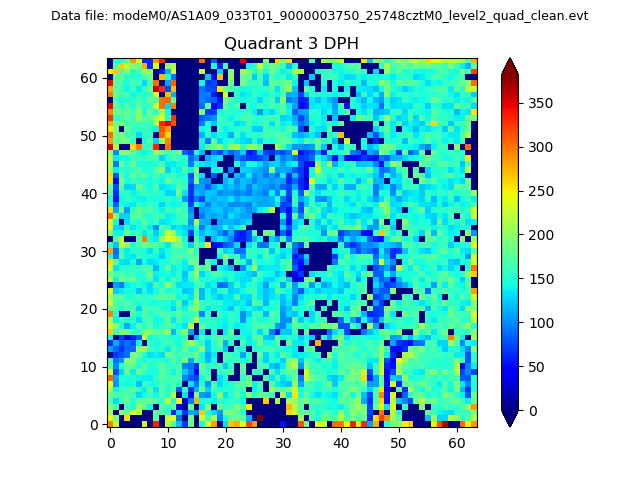 |
 |
Quadrant C |
| Plot type | Count rate plots | Images |
|---|---|---|
| Comparison with Poisson distribution Blue bars denote a histogram of data divided into 1 sec bins. Red curve is a Poisson curve with rate = median count rate of data. |
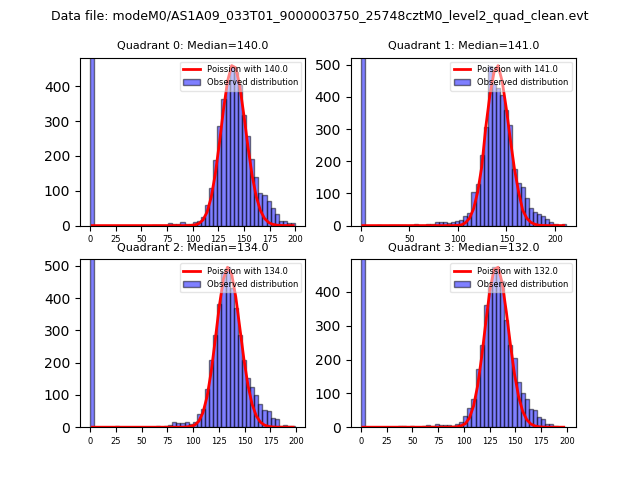 |
 |
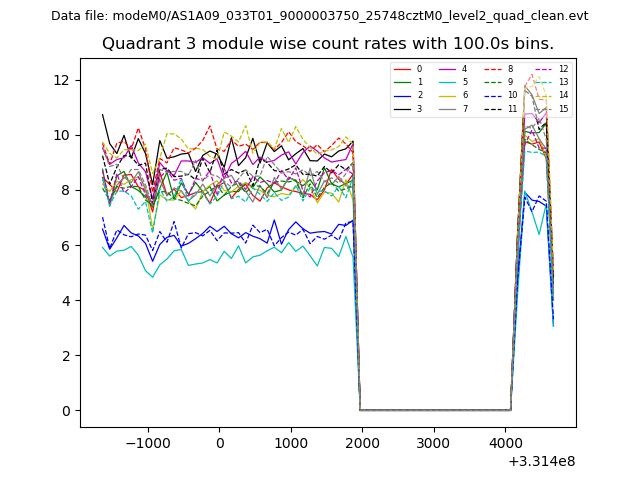
| Quadrant-wise count rates Data is divided into 100 sec bins |
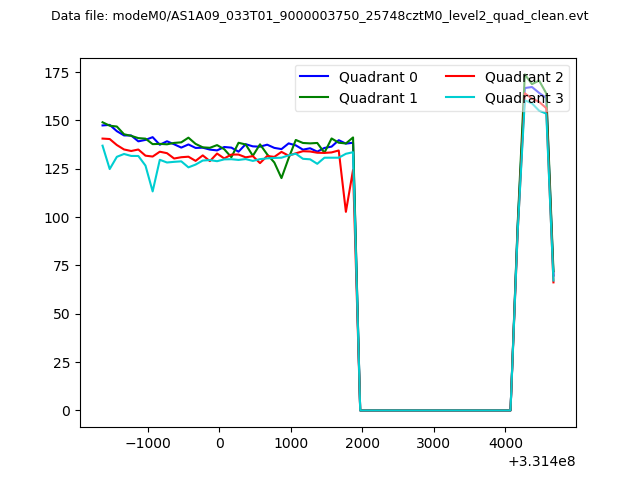 |
|
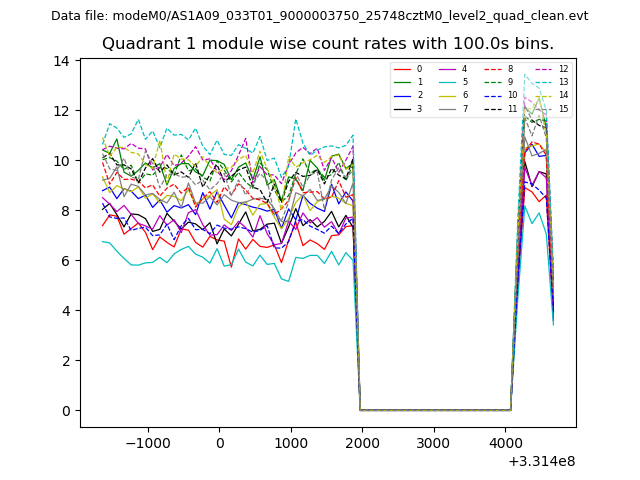
| Module-wise count rates for Quadrant A Data is divided into 100 sec bins |
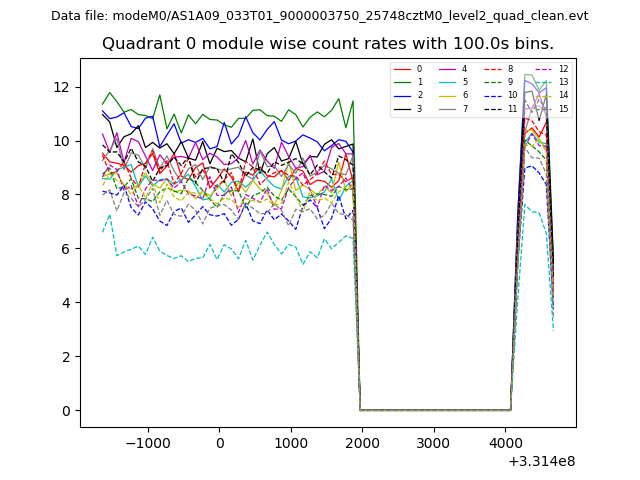 |
 |
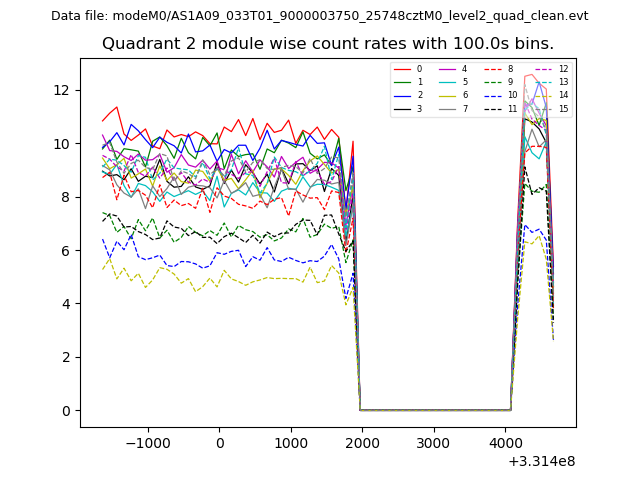
| Module-wise count rates for Quadrant B Data is divided into 100 sec bins |
 |
 |
| Module-wise count rates for Quadrant C Data is divided into 100 sec bins |
 |
 |
| Module-wise count rates for Quadrant D Data is divided into 100 sec bins |
 |
 |
| Parameter | Plot |
|---|---|
| CZT HV Monitor | 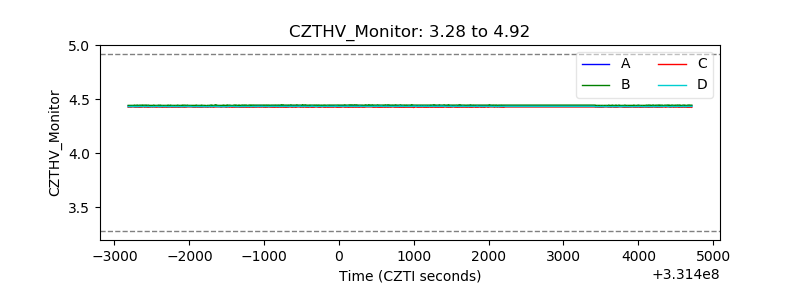 |
| D_VDD | 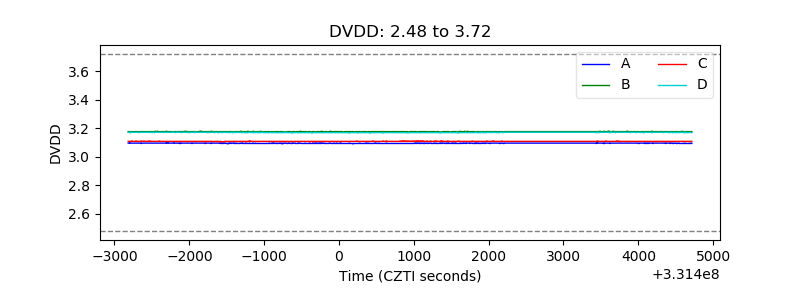 |
| Temperature 1 | 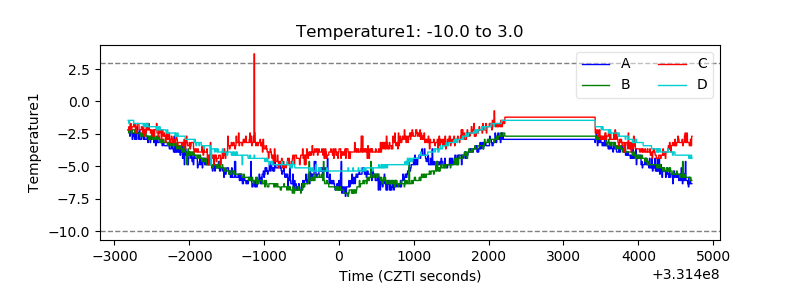 |
| Veto HV Monitor | 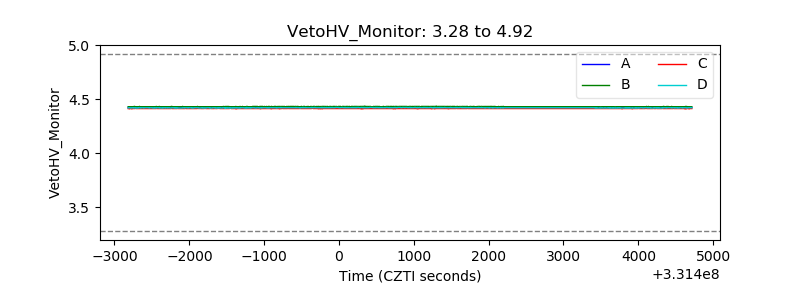 |
| Veto LLD | 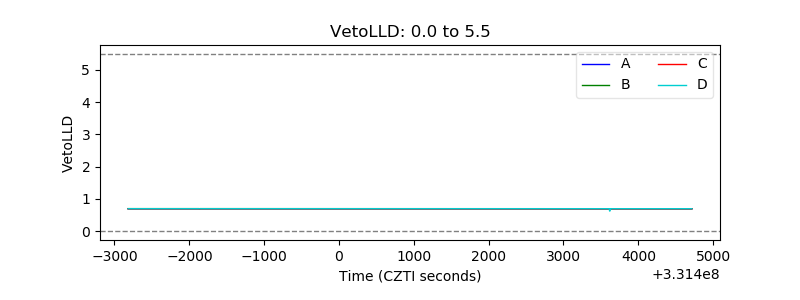 |
| Alpha Counter | 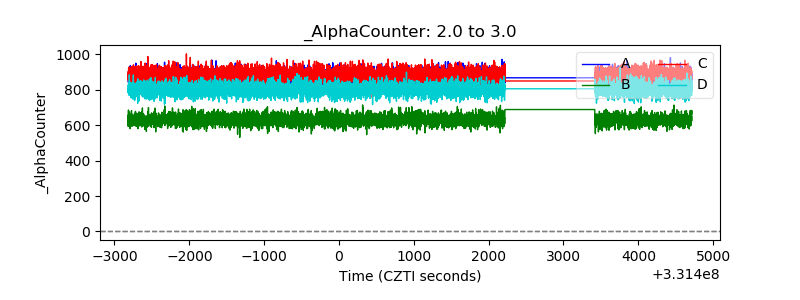 |
| _CPM_Rate | 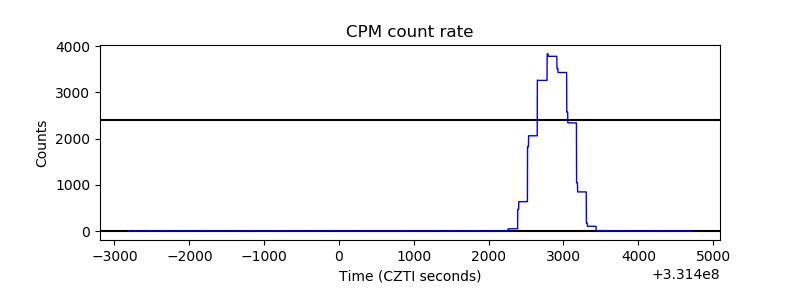 |
| CZT Counter | 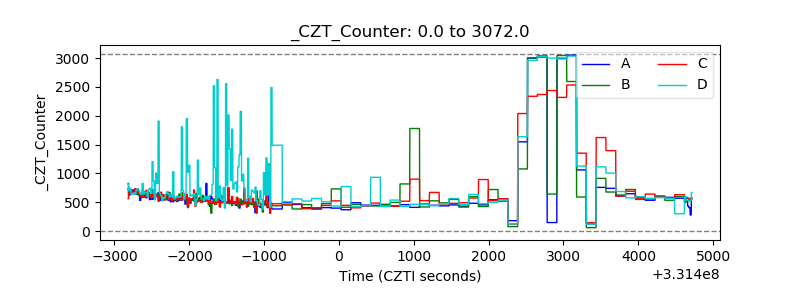 |
| +2.5 Volts monitor | 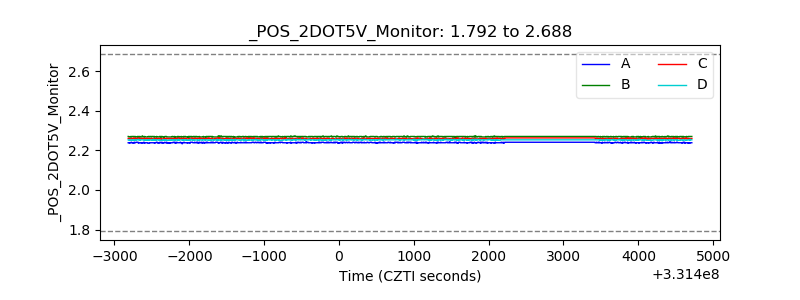 |
| +5 Volts monitor | 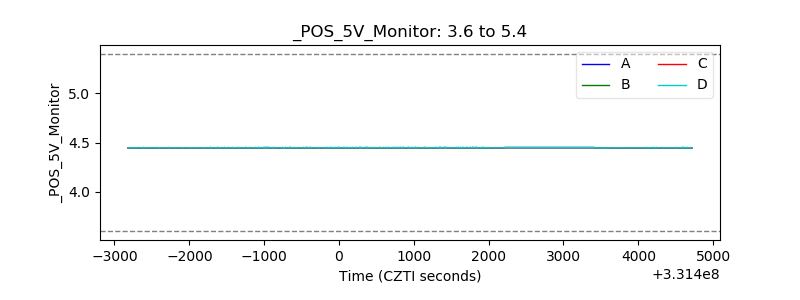 |
| _ROLL_ROT | 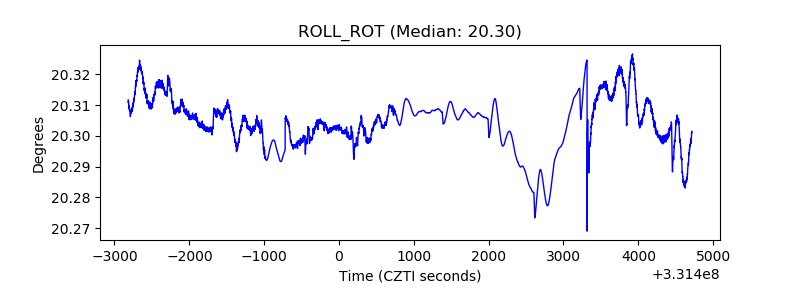 |
| _Roll_DEC | 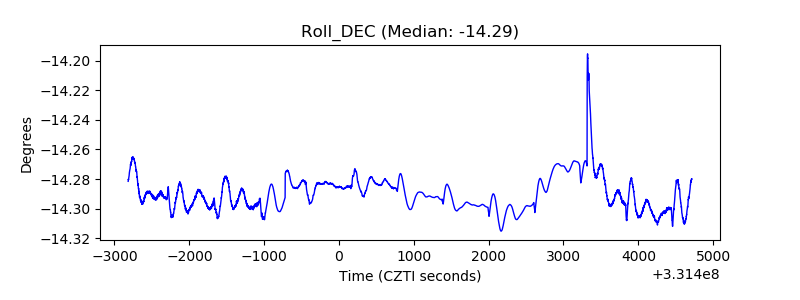 |
| _Roll_RA | 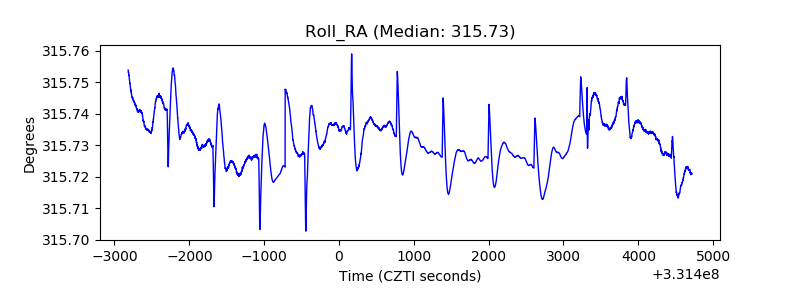 |
| Veto Counter | 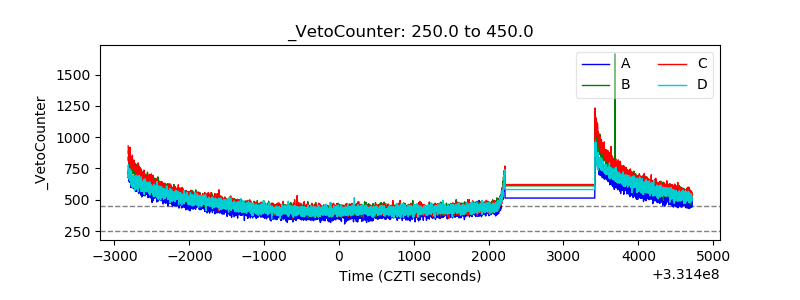 |