| Param | Original file | Final file |
|---|---|---|
| Filename | modeM0/AS1A09_033T01_9000003750_25749cztM0_level2.evt | modeM0/AS1A09_033T01_9000003750_25749cztM0_level2_quad_clean.evt |
| Size (bytes) | 517,504,320 | 107,668,800 |
| Size | 493.5 MB | 102.7 MB |
| Events in quadrant A | 3,581,966 | 706,951 |
| Events in quadrant B | 3,678,536 | 727,512 |
| Events in quadrant C | 3,816,949 | 693,443 |
| Events in quadrant D | 4,148,261 | 673,443 |
| Mode M0 | |||
|---|---|---|---|
| Quadrant | BADHDUFLAG | Total packets | Discarded packets |
| A | 0 | 14906 | 0 |
| B | 0 | 15114 | 0 |
| C | 0 | 15578 | 0 |
| D | 0 | 16500 | 0 |
| Mode M9 | |||
|---|---|---|---|
| Quadrant | BADHDUFLAG | Total packets | Discarded packets |
| A | 0 | 26 | 0 |
| B | 0 | 26 | 0 |
| C | 0 | 26 | 0 |
| D | 0 | 26 | 0 |
| Quadrant | Total seconds | Saturated seconds | Saturation percentage |
|---|---|---|---|
| A | 6596 | 72 | 1.091571% |
| B | 6597 | 92 | 1.394573% |
| C | 6597 | 154 | 2.334394% |
| D | 6597 | 196 | 2.971047% |
Noise dominated data is calculated using 1-second bins in cleaned event files. If a bin has >2000 counts, and if more than 50% of those come from <1% of pixels, then it is considered to be noise-dominated and hence unusable.
| Quadrant | # 1 sec bins | Bins with >0 counts | Bins with >2000 counts | High rate bins dominated by noise | Noise dominated (total time) | Noise dominated (detector-on time) | Marked lightcurve |
|---|---|---|---|---|---|---|---|
| A | 9116 | 6596 | 0 | 0 | 0.00% | 0.00% | 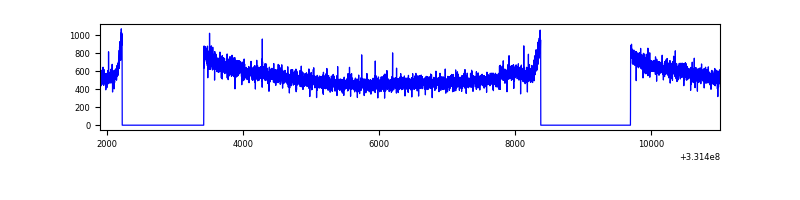 |
| B | 9117 | 6597 | 0 | 0 | 0.00% | 0.00% | 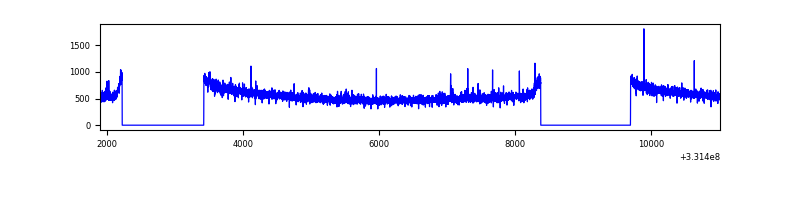 |
| C | 9117 | 6597 | 0 | 0 | 0.00% | 0.00% | 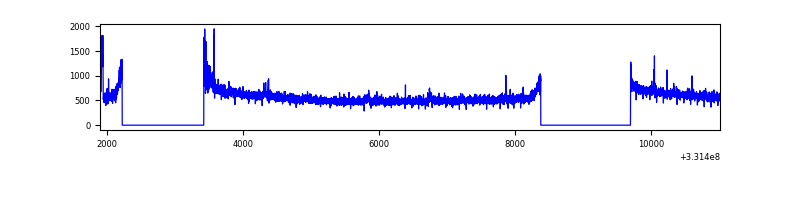 |
| D | 9117 | 6597 | 108 | 108 | 1.18% | 1.64% | 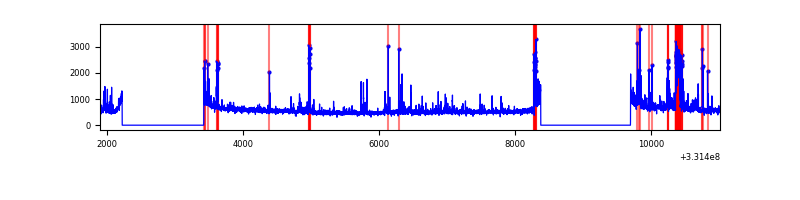 |
Top three noisy pixels from each quadrant. If the there are fewer than three noisy pixels in the level2.evt file, extra rows are filled as -1
| Pixel properties | Quadrant properties | ||||||
|---|---|---|---|---|---|---|---|
| Quadrant | DetID | PixID | Counts | Sigma | Mean | Median | Sigma |
| A | 6 | 16 | 26164 | 138.89 | 922 | 909 | 181.8 |
| A | 13 | 254 | 10716 | 53.93 | 922 | 909 | 181.8 |
| A | 3 | 137 | 7986 | 38.92 | 922 | 909 | 181.8 |
| B | 12 | 111 | 20268 | 112.86 | 924 | 907 | 171.5 |
| B | 0 | 219 | 19262 | 107.0 | 924 | 907 | 171.5 |
| B | 11 | 111 | 18383 | 101.87 | 924 | 907 | 171.5 |
| C | 3 | 233 | 162050 | 775.38 | 898 | 909 | 207.8 |
| C | 14 | 238 | 145045 | 693.56 | 898 | 909 | 207.8 |
| C | 13 | 61 | 6174 | 25.33 | 898 | 909 | 207.8 |
| D | 7 | 80 | 249549 | 1150.72 | 901 | 881 | 216.1 |
| D | 1 | 52 | 169378 | 779.73 | 901 | 881 | 216.1 |
| D | 12 | 233 | 105274 | 483.08 | 901 | 881 | 216.1 |
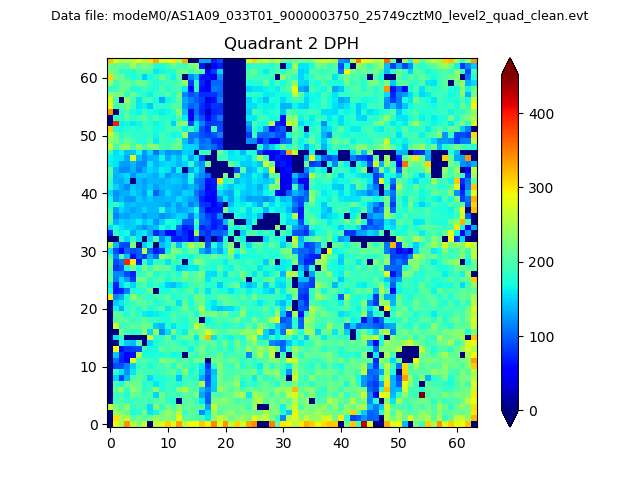
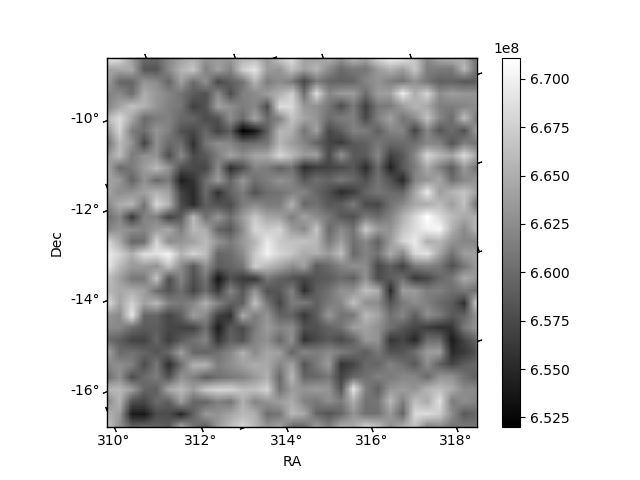
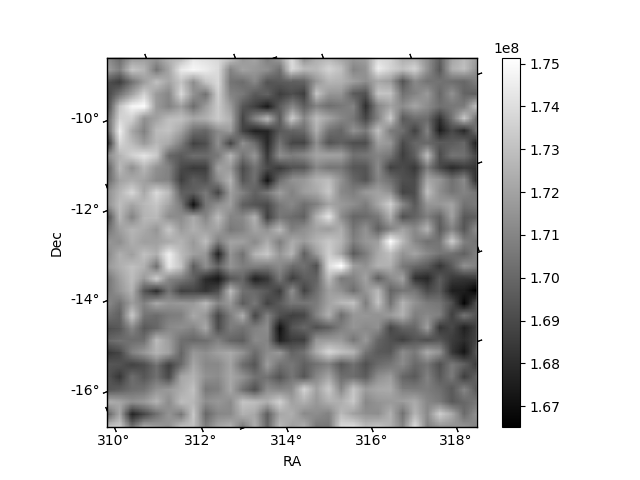
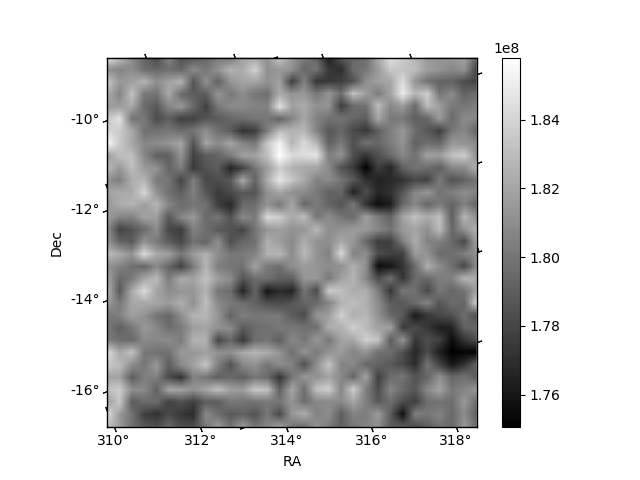
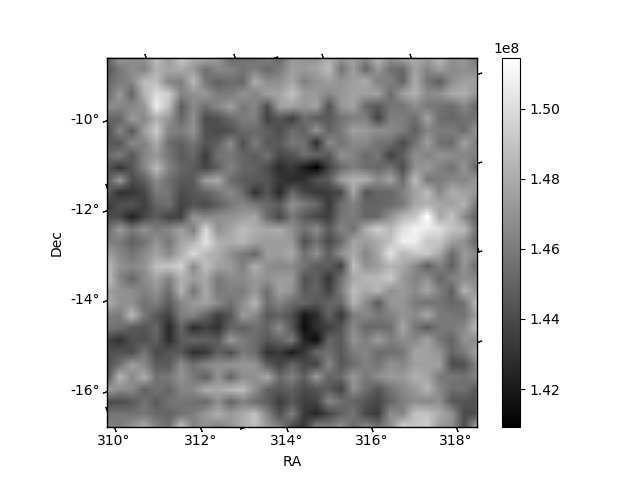
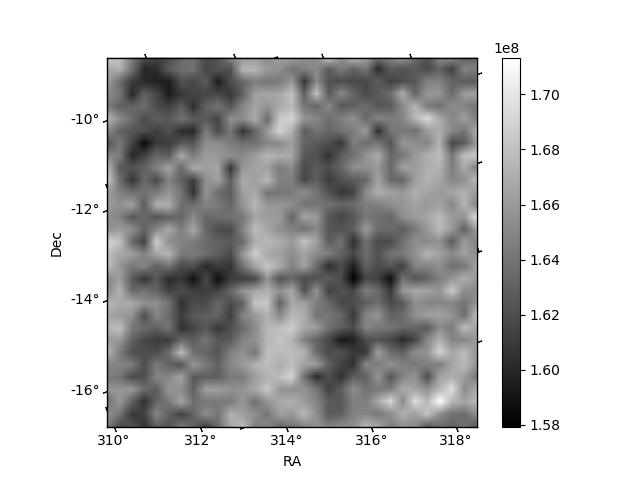
Histogram calculated using DETX and DETY for each event in the final _common_clean file
| Quadrant A | 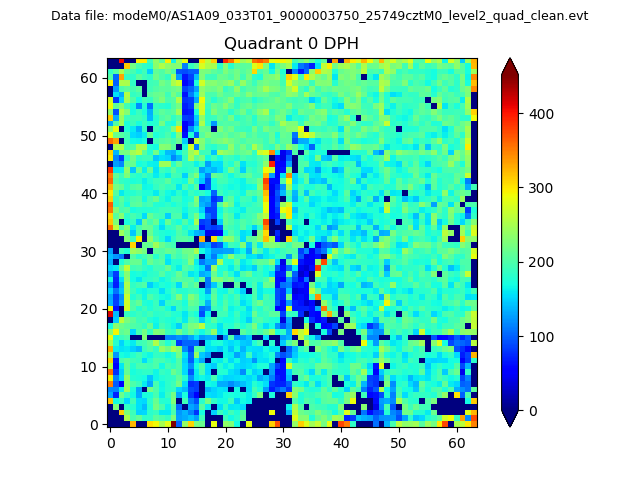 |
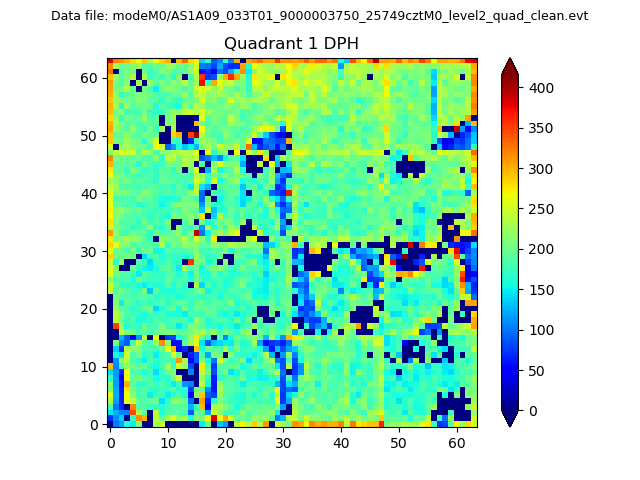 |
Quadrant B |
|---|---|---|---|
| Quadrant D | 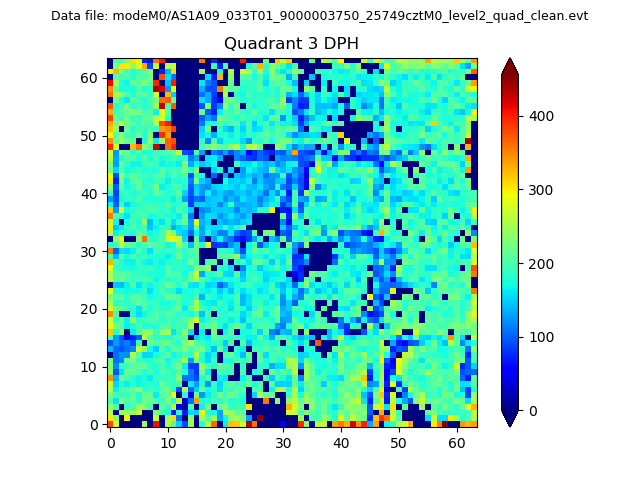 |
 |
Quadrant C |
| Plot type | Count rate plots | Images |
|---|---|---|
| Comparison with Poisson distribution Blue bars denote a histogram of data divided into 1 sec bins. Red curve is a Poisson curve with rate = median count rate of data. |
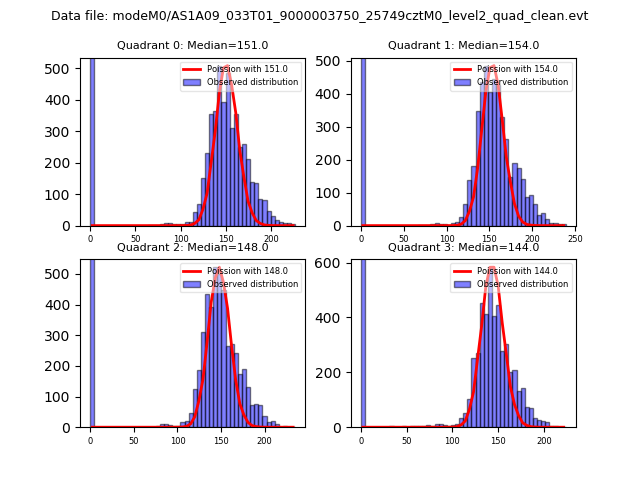 |
 |
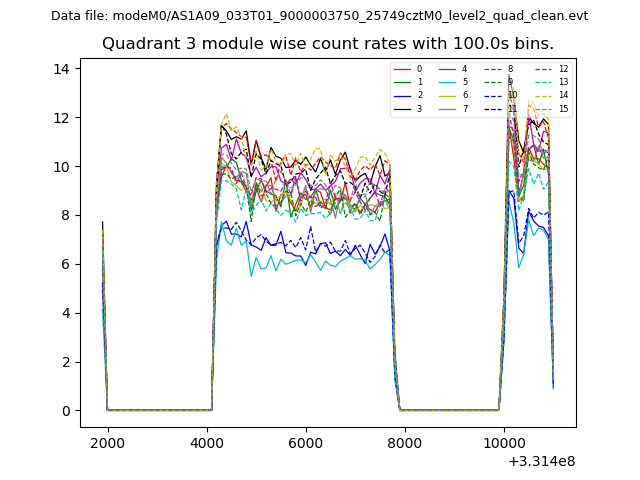
| Quadrant-wise count rates Data is divided into 100 sec bins |
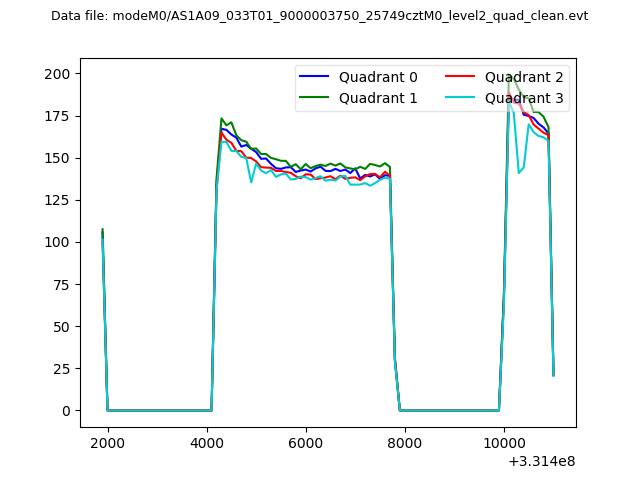 |
|
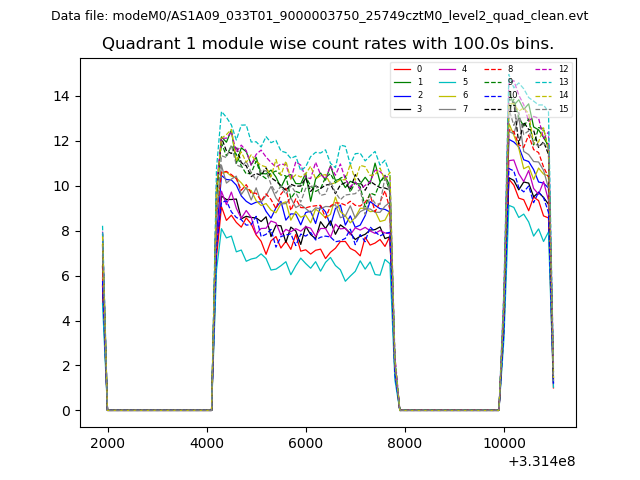
| Module-wise count rates for Quadrant A Data is divided into 100 sec bins |
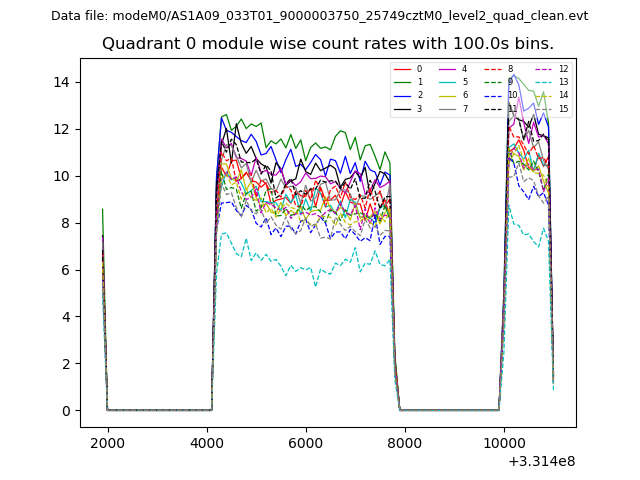 |
 |
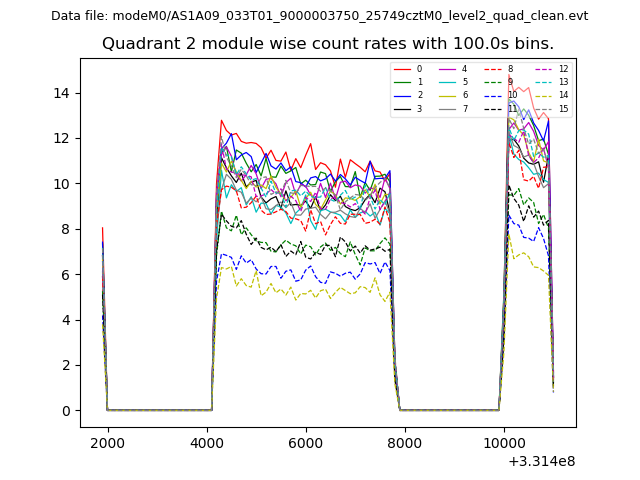
| Module-wise count rates for Quadrant B Data is divided into 100 sec bins |
 |
 |
| Module-wise count rates for Quadrant C Data is divided into 100 sec bins |
 |
 |
| Module-wise count rates for Quadrant D Data is divided into 100 sec bins |
 |
 |
| Parameter | Plot |
|---|---|
| CZT HV Monitor | 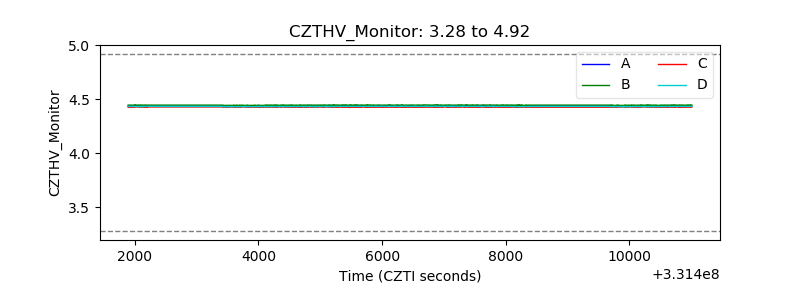 |
| D_VDD | 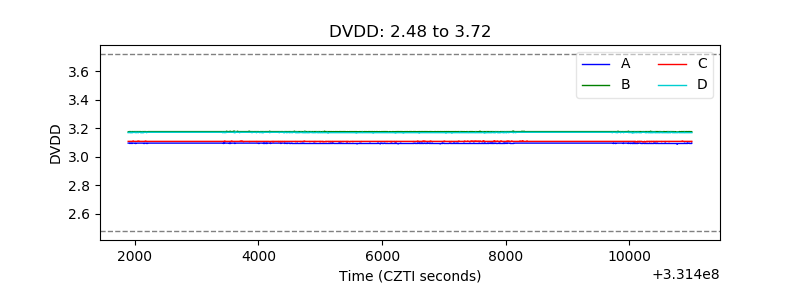 |
| Temperature 1 | 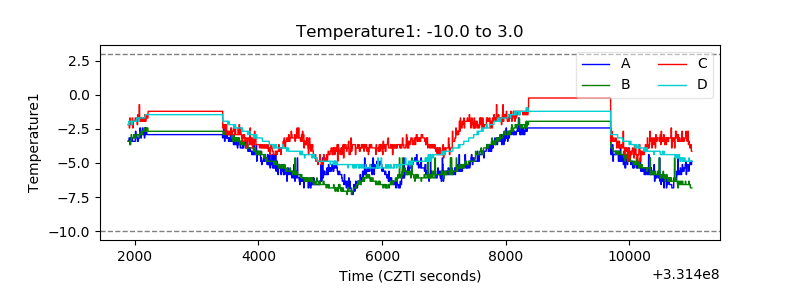 |
| Veto HV Monitor | 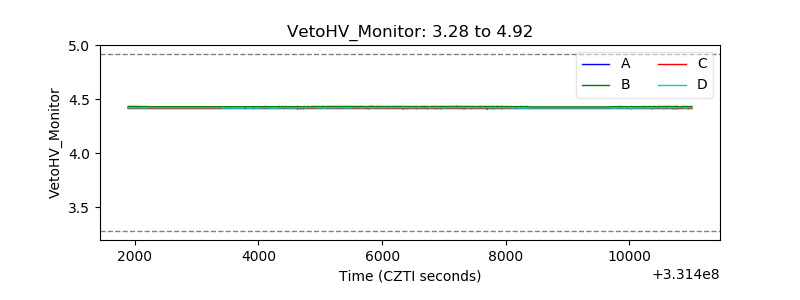 |
| Veto LLD | 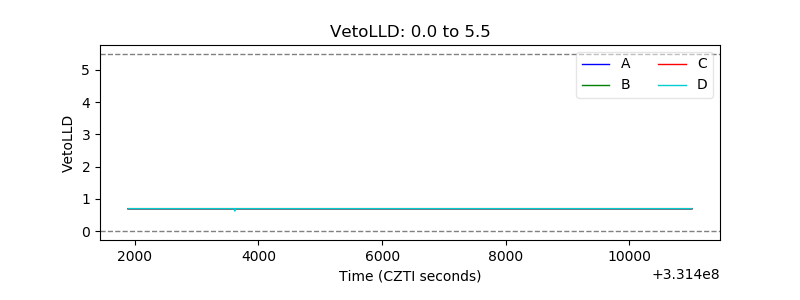 |
| Alpha Counter | 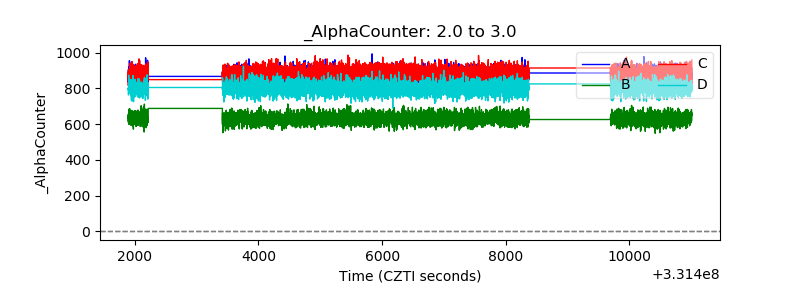 |
| _CPM_Rate | 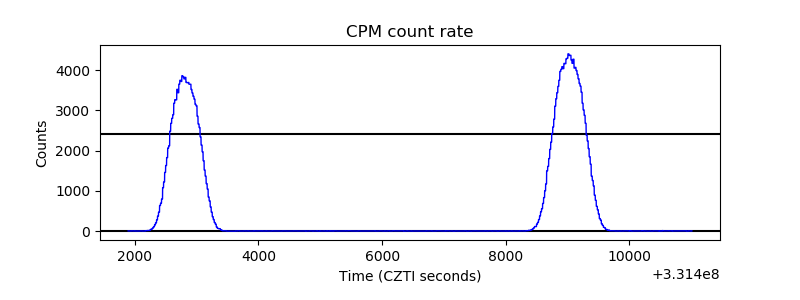 |
| CZT Counter | 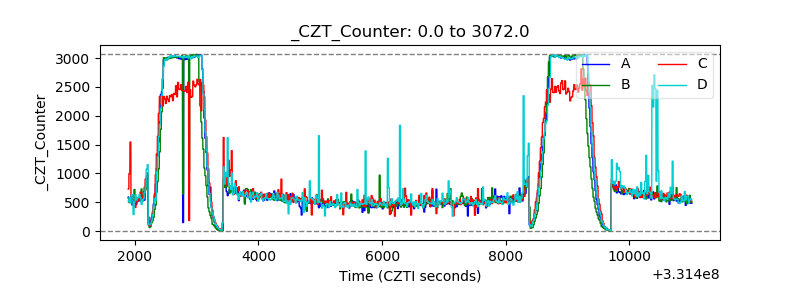 |
| +2.5 Volts monitor |  |
| +5 Volts monitor |  |
| _ROLL_ROT | 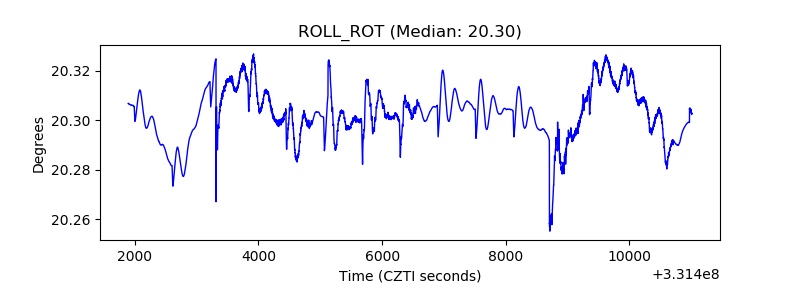 |
| _Roll_DEC | 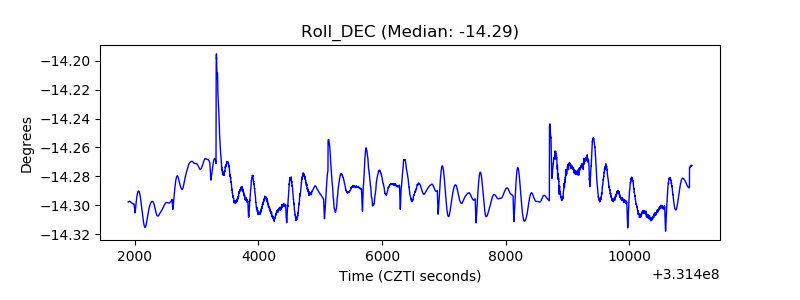 |
| _Roll_RA | 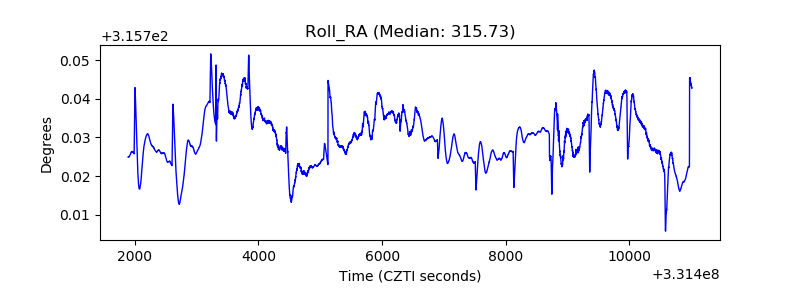 |
| Veto Counter | 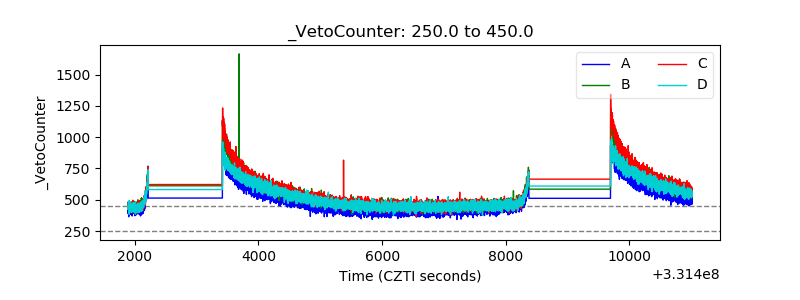 |