| Param | Original file | Final file |
|---|---|---|
| Filename | modeM0/AS1A09_033T01_9000003750_25753cztM0_level2.evt | modeM0/AS1A09_033T01_9000003750_25753cztM0_level2_quad_clean.evt |
| Size (bytes) | 1,105,375,680 | 233,879,040 |
| Size | 1.0 GB | 223.0 MB |
| Events in quadrant A | 7,553,927 | 1,509,067 |
| Events in quadrant B | 7,738,062 | 1,559,629 |
| Events in quadrant C | 8,020,003 | 1,498,806 |
| Events in quadrant D | 9,139,208 | 1,470,012 |
| Mode M0 | |||
|---|---|---|---|
| Quadrant | BADHDUFLAG | Total packets | Discarded packets |
| A | 0 | 31651 | 0 |
| B | 0 | 32235 | 0 |
| C | 0 | 33013 | 0 |
| D | 0 | 36815 | 0 |
| Mode M9 | |||
|---|---|---|---|
| Quadrant | BADHDUFLAG | Total packets | Discarded packets |
| A | 0 | 40 | 5 |
| B | 0 | 38 | 2 |
| C | 0 | 38 | 2 |
| D | 0 | 38 | 3 |
| Quadrant | Total seconds | Saturated seconds | Saturation percentage |
|---|---|---|---|
| A | 15065 | 55 | 0.365085% |
| B | 15077 | 118 | 0.782649% |
| C | 15105 | 185 | 1.224760% |
| D | 15071 | 193 | 1.280605% |
Noise dominated data is calculated using 1-second bins in cleaned event files. If a bin has >2000 counts, and if more than 50% of those come from <1% of pixels, then it is considered to be noise-dominated and hence unusable.
| Quadrant | # 1 sec bins | Bins with >0 counts | Bins with >2000 counts | High rate bins dominated by noise | Noise dominated (total time) | Noise dominated (detector-on time) | Marked lightcurve |
|---|---|---|---|---|---|---|---|
| A | 20382 | 15246 | 0 | 0 | 0.00% | 0.00% | 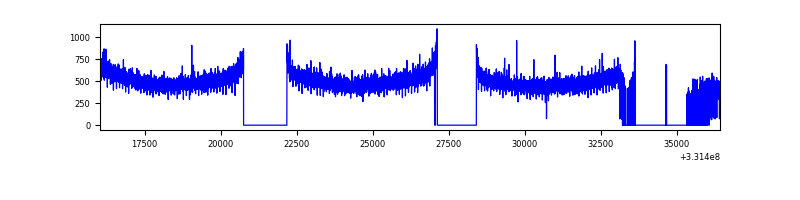 |
| B | 20382 | 15257 | 0 | 0 | 0.00% | 0.00% | 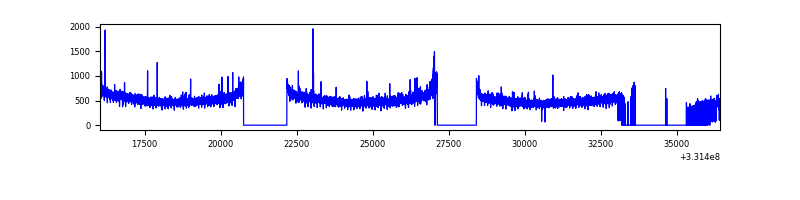 |
| C | 20382 | 15275 | 7 | 7 | 0.03% | 0.05% | 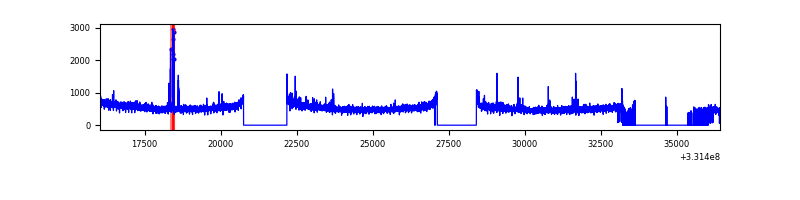 |
| D | 20382 | 15237 | 172 | 172 | 0.84% | 1.13% | 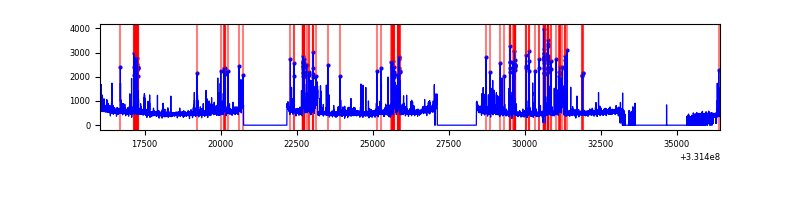 |
Top three noisy pixels from each quadrant. If the there are fewer than three noisy pixels in the level2.evt file, extra rows are filled as -1
| Pixel properties | Quadrant properties | ||||||
|---|---|---|---|---|---|---|---|
| Quadrant | DetID | PixID | Counts | Sigma | Mean | Median | Sigma |
| A | 13 | 254 | 20479 | 48.01 | 1961 | 1924 | 386.5 |
| A | 3 | 137 | 17157 | 39.41 | 1961 | 1924 | 386.5 |
| A | 0 | 226 | 16527 | 37.78 | 1961 | 1924 | 386.5 |
| B | 12 | 111 | 43315 | 113.85 | 1960 | 1914 | 363.6 |
| B | 11 | 111 | 39714 | 103.95 | 1960 | 1914 | 363.6 |
| B | 14 | 111 | 36317 | 94.61 | 1960 | 1914 | 363.6 |
| C | 14 | 238 | 308232 | 692.65 | 1920 | 1939 | 442.2 |
| C | 3 | 233 | 202847 | 454.34 | 1920 | 1939 | 442.2 |
| C | 2 | 16 | 14965 | 29.46 | 1920 | 1939 | 442.2 |
| D | 7 | 80 | 1072500 | 2323.45 | 1928 | 1890 | 460.8 |
| D | 13 | 104 | 274168 | 590.9 | 1928 | 1890 | 460.8 |
| D | 1 | 52 | 230450 | 496.02 | 1928 | 1890 | 460.8 |
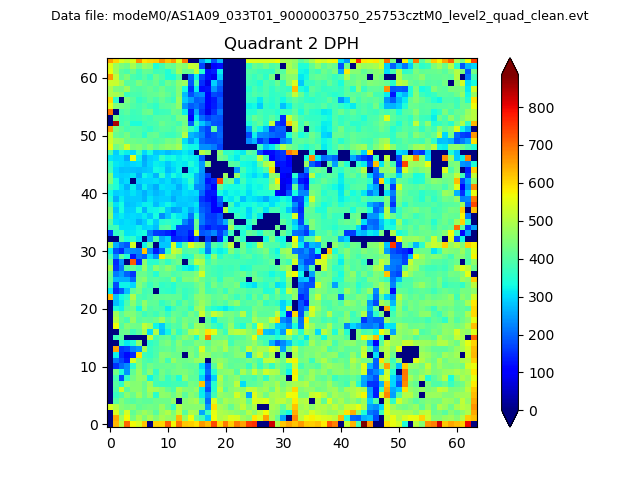
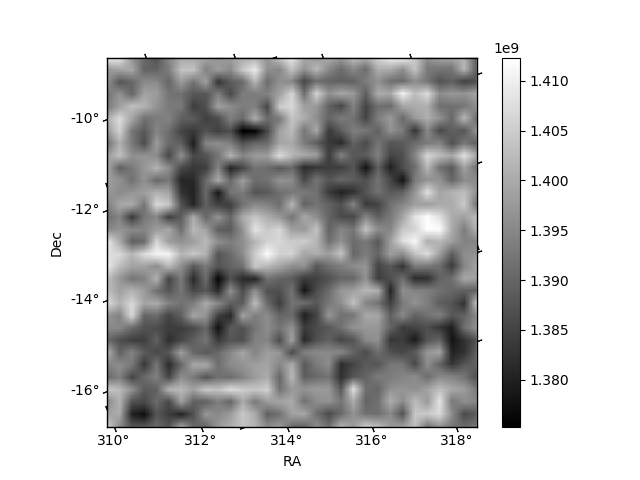
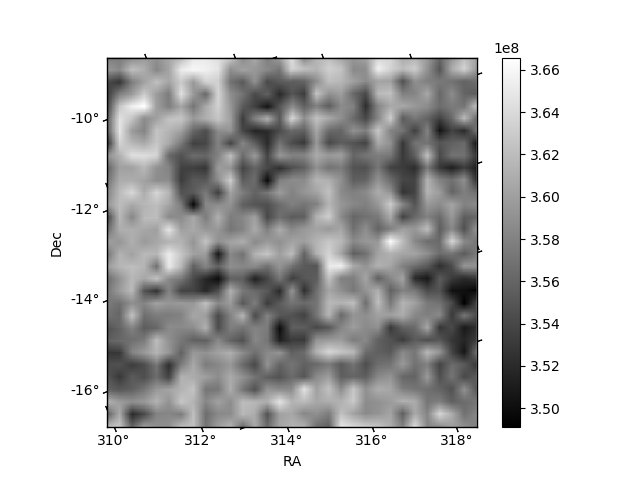
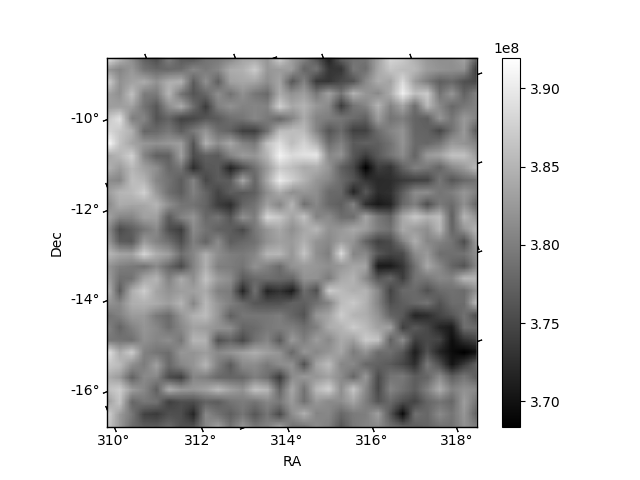
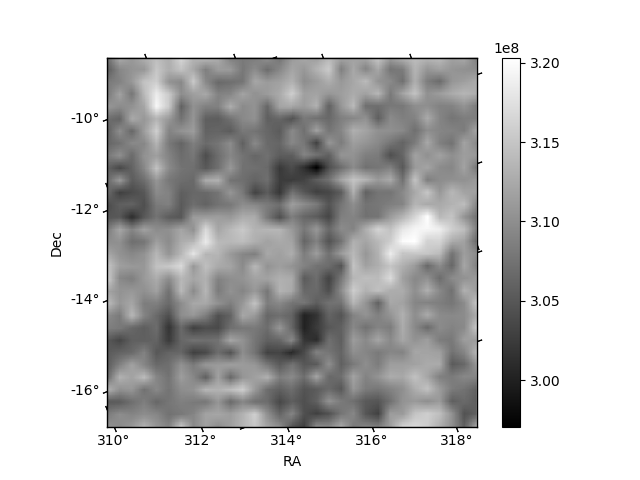
Histogram calculated using DETX and DETY for each event in the final _common_clean file
| Quadrant A | 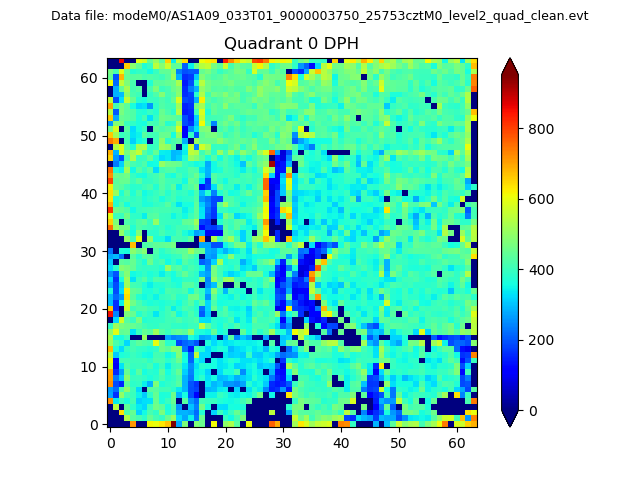 |
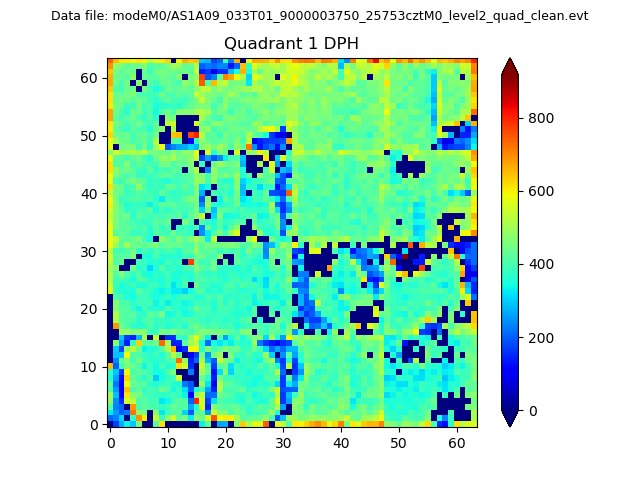 |
Quadrant B |
|---|---|---|---|
| Quadrant D | 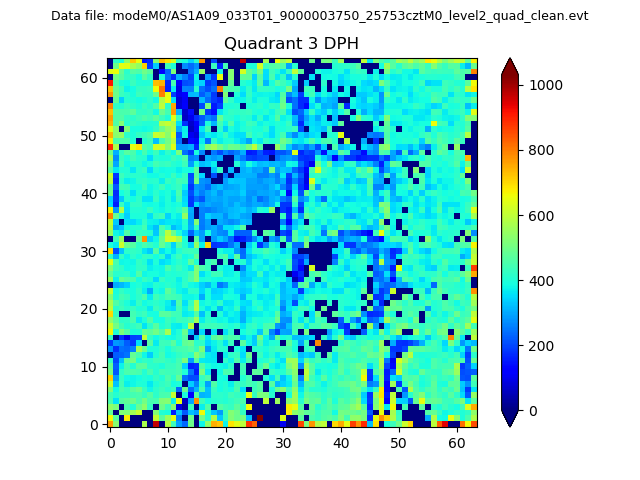 |
 |
Quadrant C |
| Plot type | Count rate plots | Images |
|---|---|---|
| Comparison with Poisson distribution Blue bars denote a histogram of data divided into 1 sec bins. Red curve is a Poisson curve with rate = median count rate of data. |
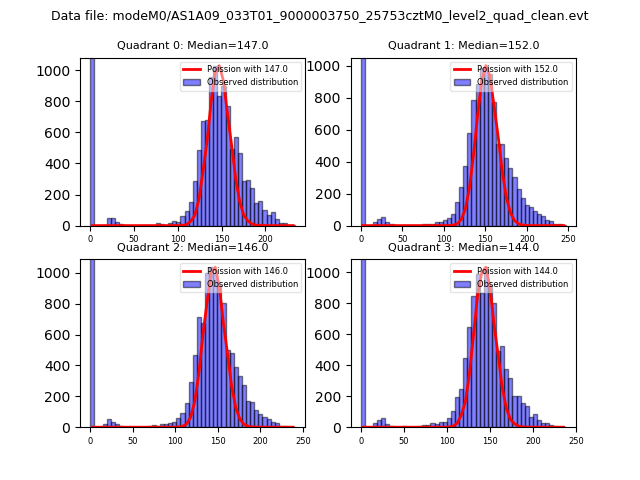 |
 |
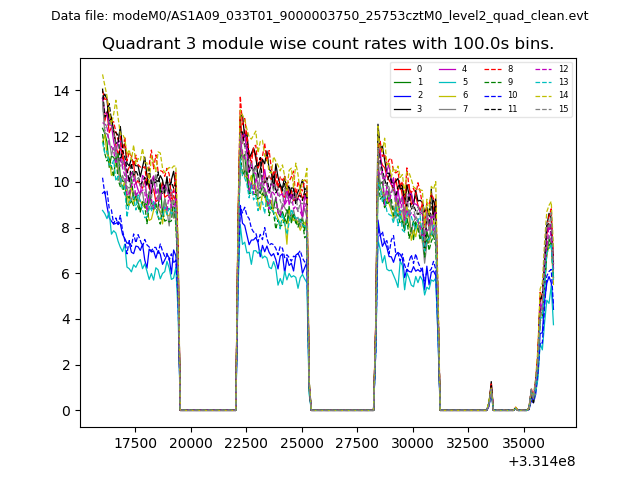
| Quadrant-wise count rates Data is divided into 100 sec bins |
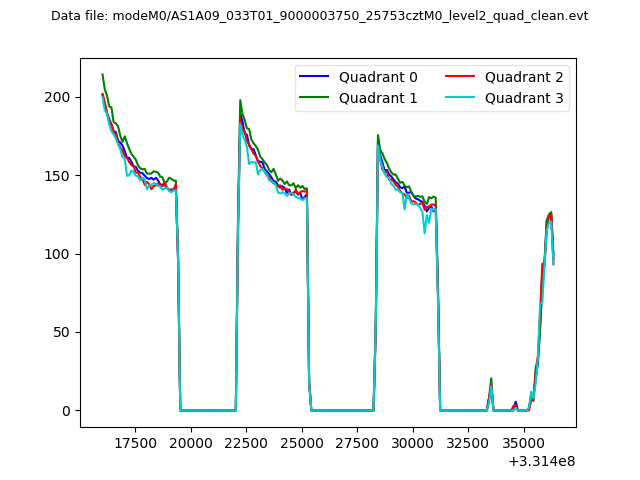 |
|
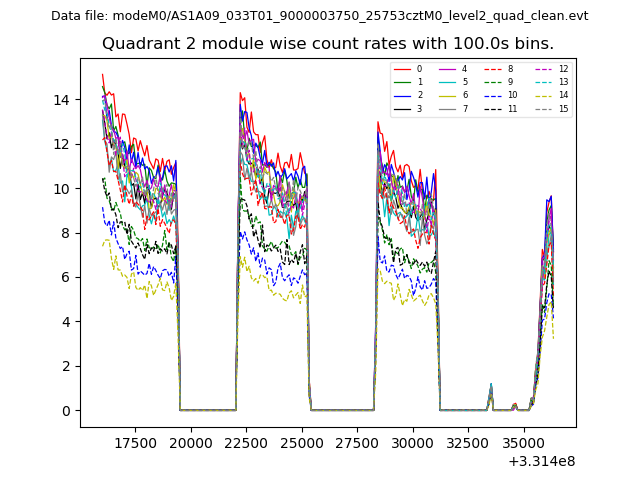
| Module-wise count rates for Quadrant A Data is divided into 100 sec bins |
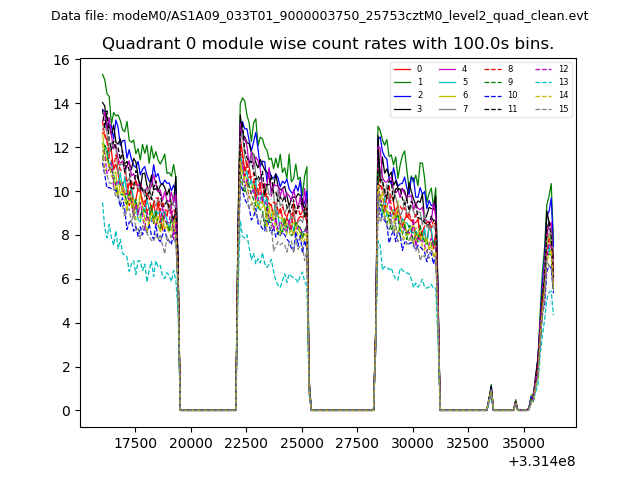 |
 |
| Module-wise count rates for Quadrant B Data is divided into 100 sec bins |
 |
 |
| Module-wise count rates for Quadrant C Data is divided into 100 sec bins |
 |
 |
| Module-wise count rates for Quadrant D Data is divided into 100 sec bins |
 |
 |
| Parameter | Plot |
|---|---|
| CZT HV Monitor | 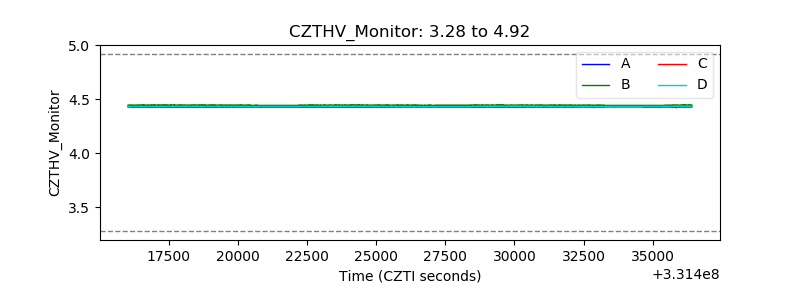 |
| D_VDD | 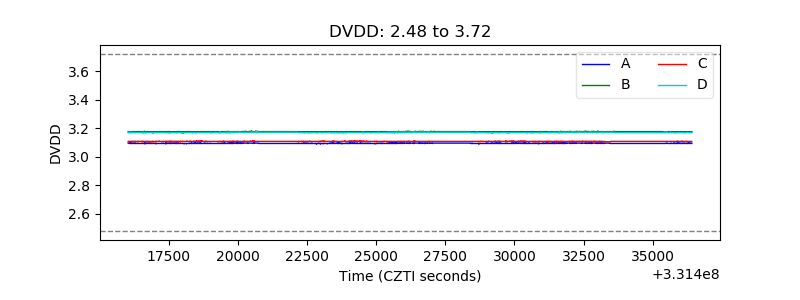 |
| Temperature 1 | 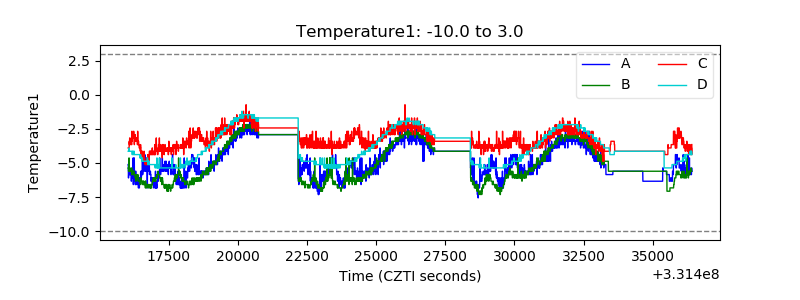 |
| Veto HV Monitor | 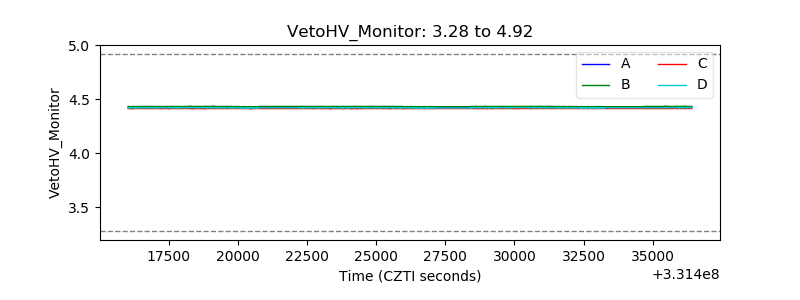 |
| Veto LLD | 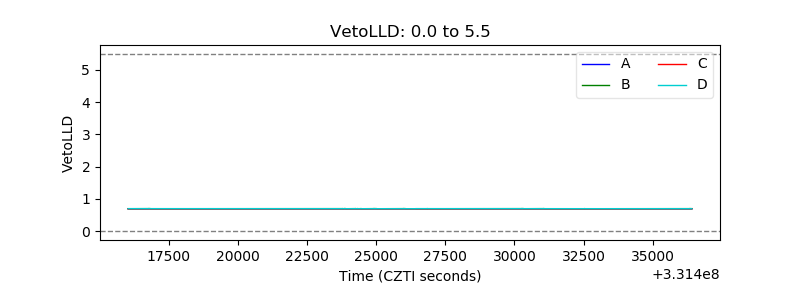 |
| Alpha Counter | 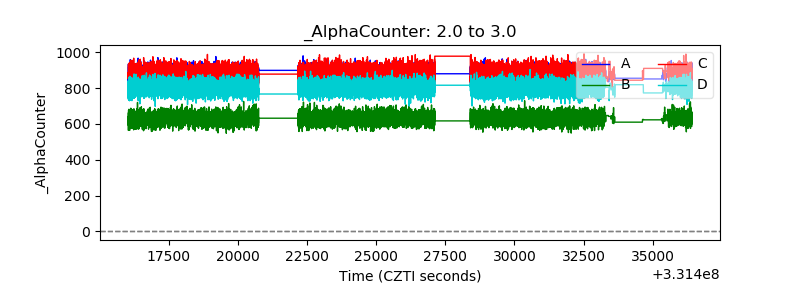 |
| _CPM_Rate | 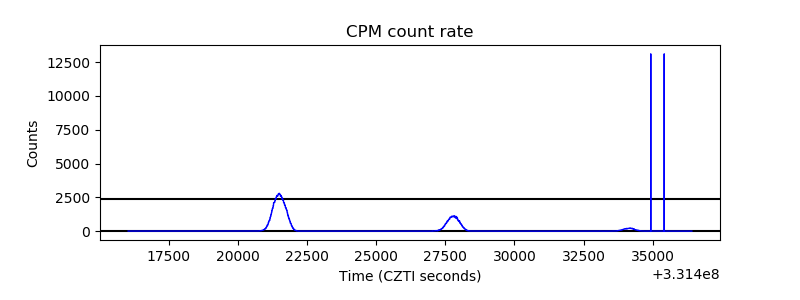 |
| CZT Counter | 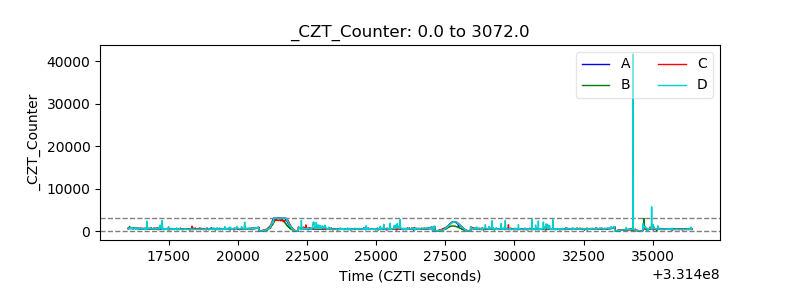 |
| +2.5 Volts monitor | 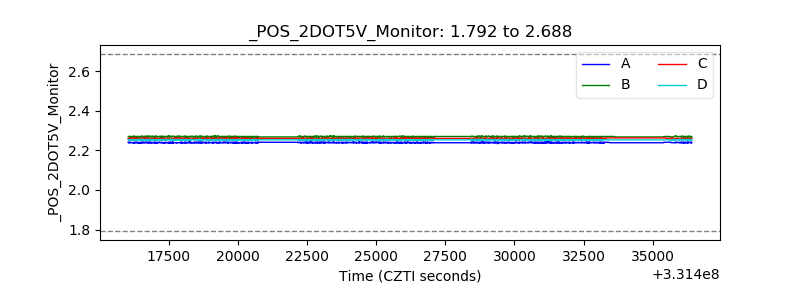 |
| +5 Volts monitor |  |
| _ROLL_ROT | 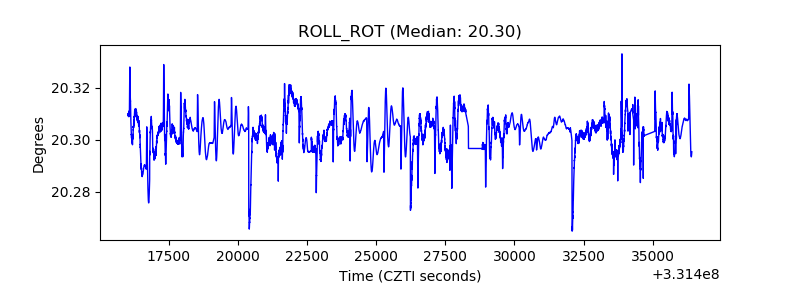 |
| _Roll_DEC |  |
| _Roll_RA | 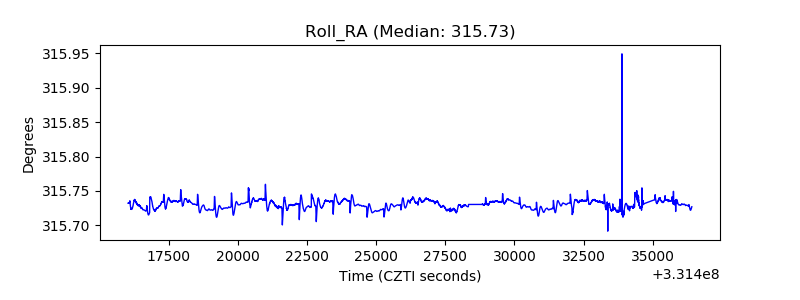 |
| Veto Counter |  |