| Param | Original file | Final file |
|---|---|---|
| Filename | modeM0/AS1A09_033T01_9000003750_25754cztM0_level2.evt | modeM0/AS1A09_033T01_9000003750_25754cztM0_level2_quad_clean.evt |
| Size (bytes) | 1,258,084,800 | 273,165,120 |
| Size | 1.2 GB | 260.5 MB |
| Events in quadrant A | 8,616,951 | 1,775,533 |
| Events in quadrant B | 8,822,212 | 1,831,208 |
| Events in quadrant C | 9,124,063 | 1,754,598 |
| Events in quadrant D | 10,374,458 | 1,725,416 |
| Mode M0 | |||
|---|---|---|---|
| Quadrant | BADHDUFLAG | Total packets | Discarded packets |
| A | 0 | 36265 | 0 |
| B | 0 | 36860 | 0 |
| C | 0 | 37644 | 0 |
| D | 0 | 41927 | 0 |
| Mode M9 | |||
|---|---|---|---|
| Quadrant | BADHDUFLAG | Total packets | Discarded packets |
| A | 0 | 38 | 0 |
| B | 0 | 38 | 0 |
| C | 0 | 38 | 0 |
| D | 0 | 38 | 0 |
| Quadrant | Total seconds | Saturated seconds | Saturation percentage |
|---|---|---|---|
| A | 17228 | 67 | 0.388902% |
| B | 17229 | 135 | 0.783563% |
| C | 17229 | 226 | 1.311742% |
| D | 17229 | 229 | 1.329154% |
Noise dominated data is calculated using 1-second bins in cleaned event files. If a bin has >2000 counts, and if more than 50% of those come from <1% of pixels, then it is considered to be noise-dominated and hence unusable.
| Quadrant | # 1 sec bins | Bins with >0 counts | Bins with >2000 counts | High rate bins dominated by noise | Noise dominated (total time) | Noise dominated (detector-on time) | Marked lightcurve |
|---|---|---|---|---|---|---|---|
| A | 20963 | 17232 | 0 | 0 | 0.00% | 0.00% | 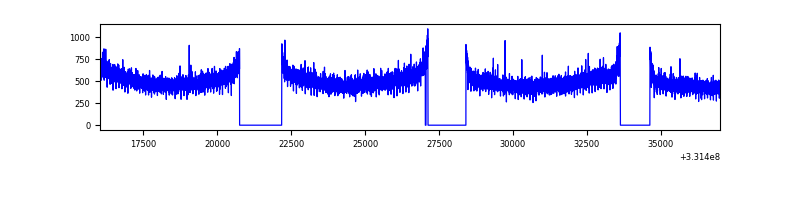 |
| B | 20964 | 17233 | 0 | 0 | 0.00% | 0.00% | 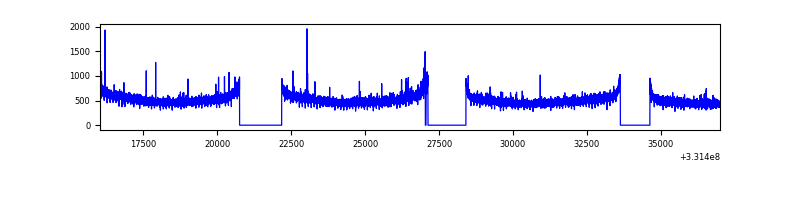 |
| C | 20964 | 17232 | 9 | 9 | 0.04% | 0.05% | 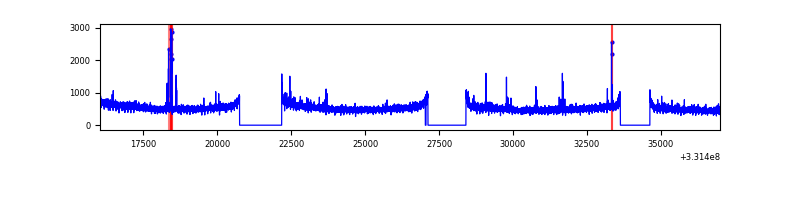 |
| D | 20964 | 17232 | 180 | 180 | 0.86% | 1.04% | 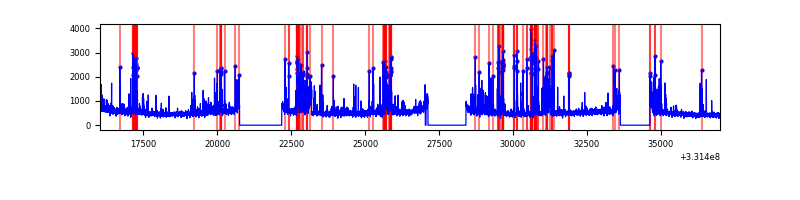 |
Top three noisy pixels from each quadrant. If the there are fewer than three noisy pixels in the level2.evt file, extra rows are filled as -1
| Pixel properties | Quadrant properties | ||||||
|---|---|---|---|---|---|---|---|
| Quadrant | DetID | PixID | Counts | Sigma | Mean | Median | Sigma |
| A | 13 | 254 | 23404 | 48.08 | 2236 | 2195 | 441.1 |
| A | 3 | 137 | 19542 | 39.33 | 2236 | 2195 | 441.1 |
| A | 0 | 226 | 18849 | 37.76 | 2236 | 2195 | 441.1 |
| B | 12 | 111 | 49918 | 114.81 | 2235 | 2184 | 415.8 |
| B | 11 | 111 | 45567 | 104.34 | 2235 | 2184 | 415.8 |
| B | 14 | 111 | 41919 | 95.57 | 2235 | 2184 | 415.8 |
| C | 14 | 238 | 349383 | 688.77 | 2186 | 2206 | 504.1 |
| C | 3 | 233 | 217326 | 426.78 | 2186 | 2206 | 504.1 |
| C | 14 | 225 | 22657 | 40.57 | 2186 | 2206 | 504.1 |
| D | 7 | 80 | 1122998 | 2120.56 | 2200 | 2153 | 528.6 |
| D | 13 | 104 | 315790 | 593.38 | 2200 | 2153 | 528.6 |
| D | 8 | 195 | 285231 | 535.56 | 2200 | 2153 | 528.6 |
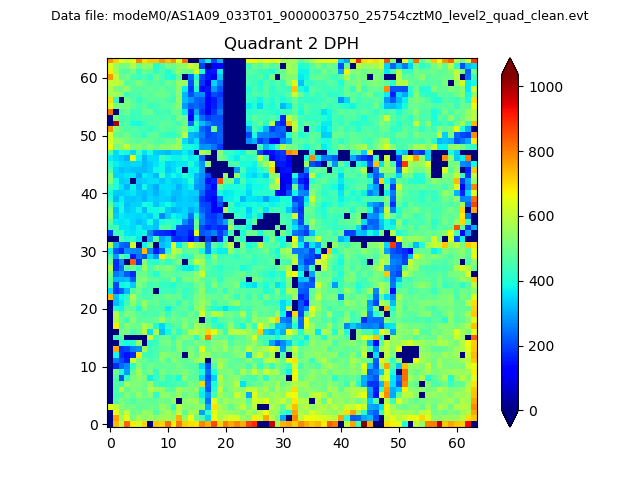
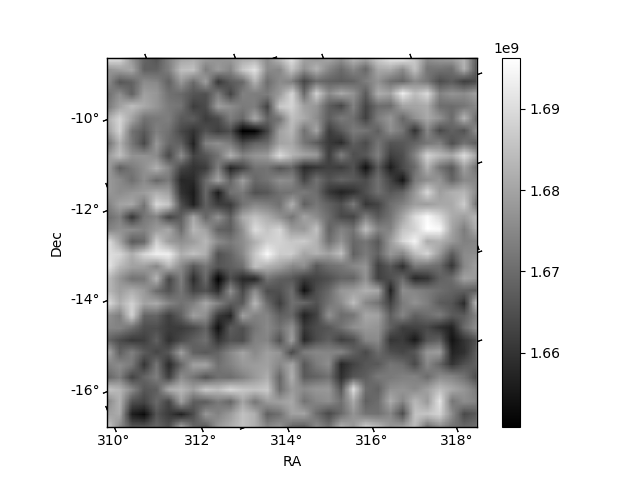
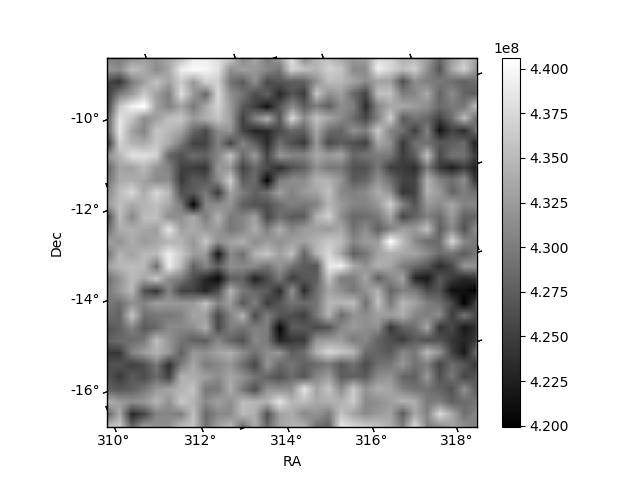
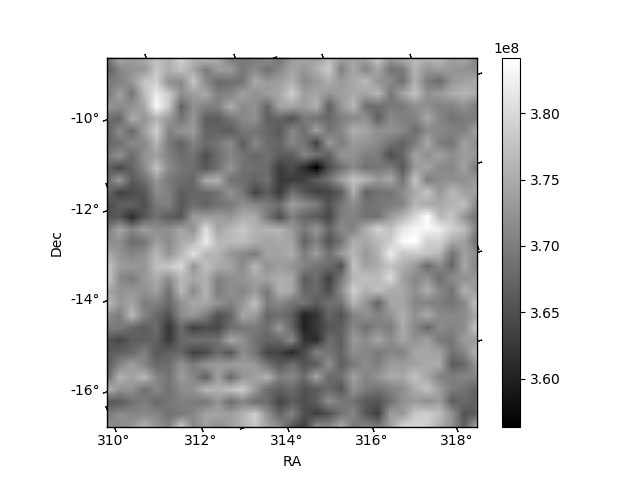
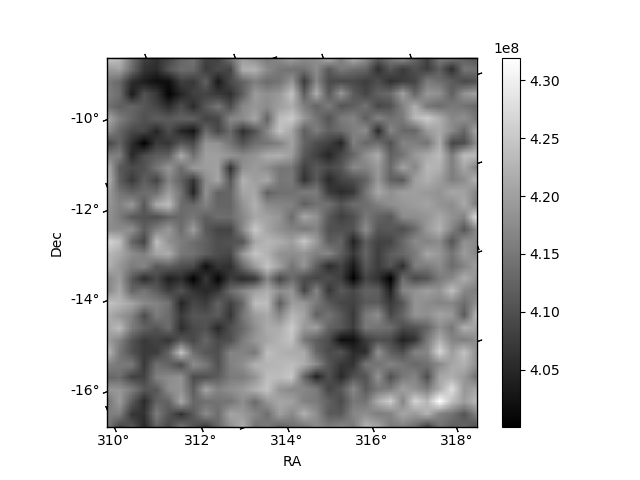
Histogram calculated using DETX and DETY for each event in the final _common_clean file
| Quadrant A | 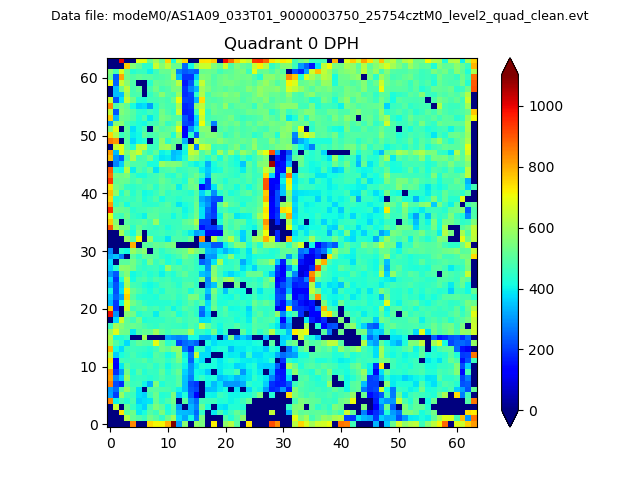 |
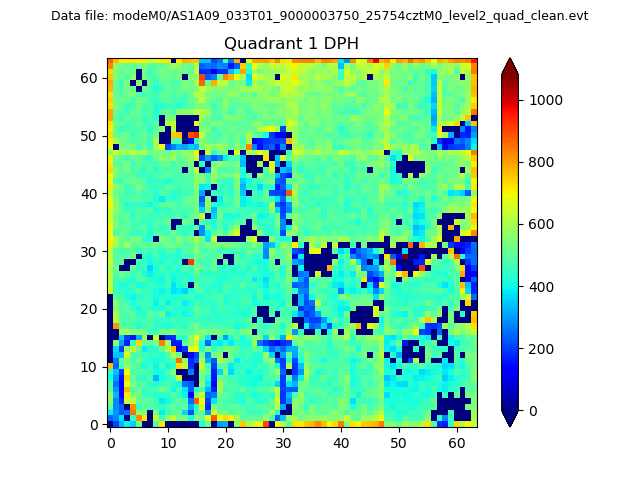 |
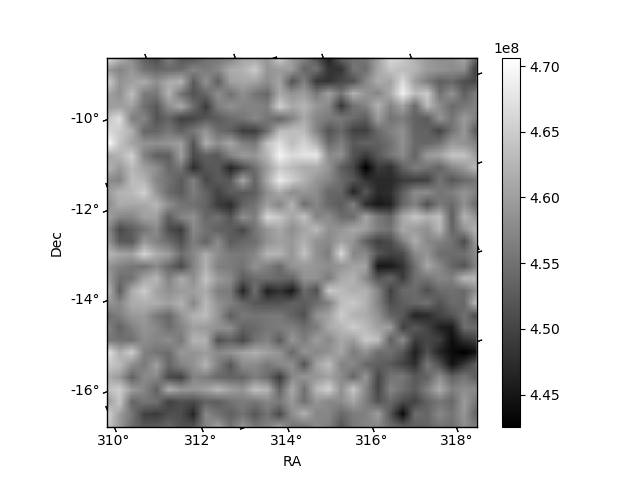
Quadrant B |
|---|---|---|---|
| Quadrant D | 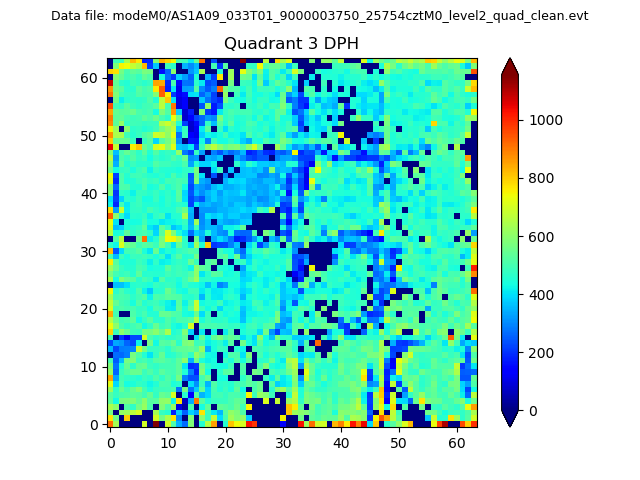 |
 |
Quadrant C |
| Plot type | Count rate plots | Images |
|---|---|---|
| Comparison with Poisson distribution Blue bars denote a histogram of data divided into 1 sec bins. Red curve is a Poisson curve with rate = median count rate of data. |
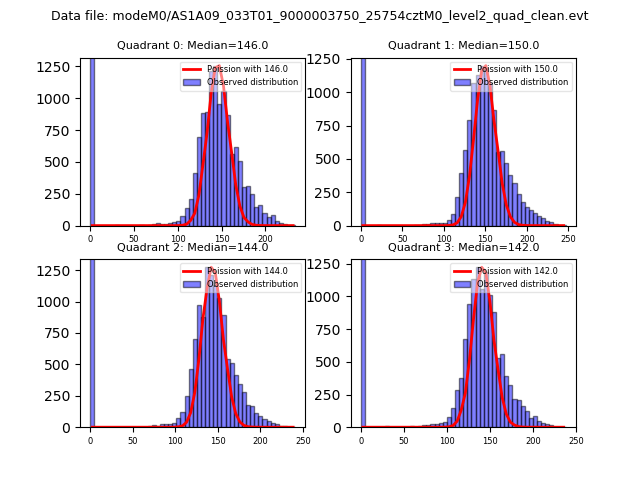 |
 |
| Quadrant-wise count rates Data is divided into 100 sec bins |
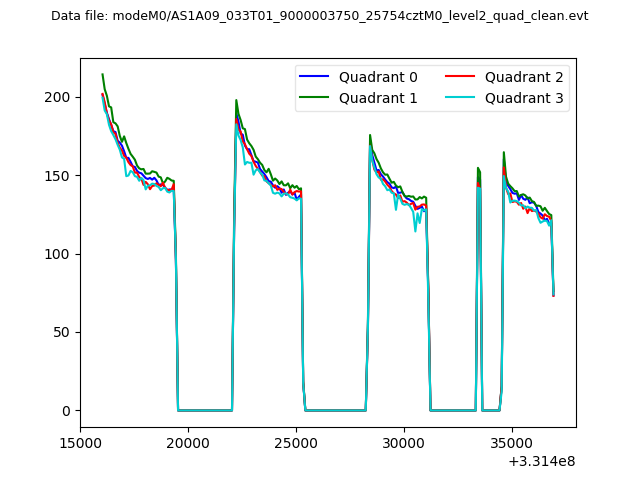 |
|
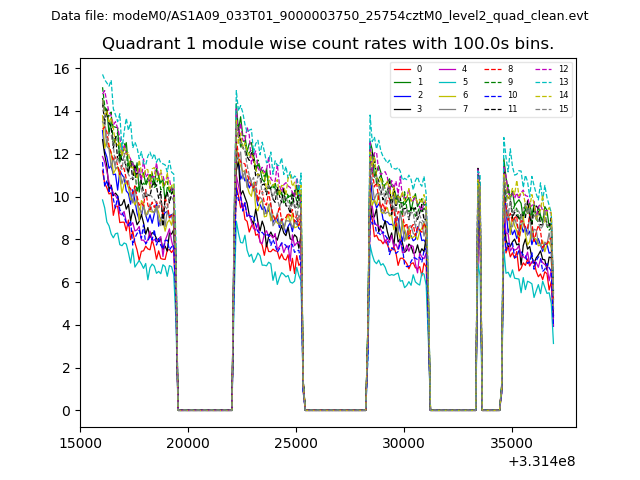
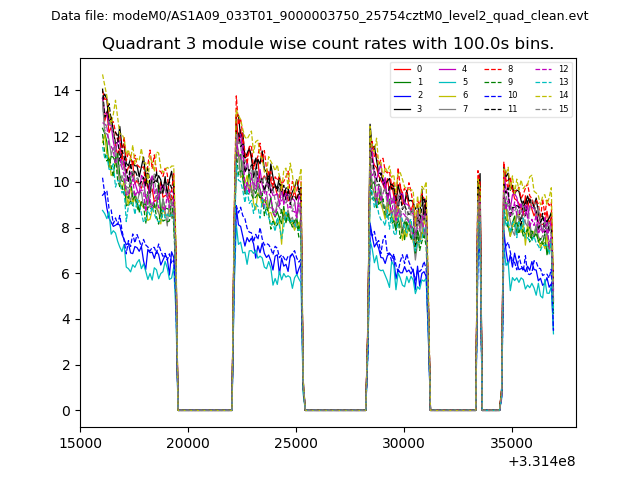
| Module-wise count rates for Quadrant A Data is divided into 100 sec bins |
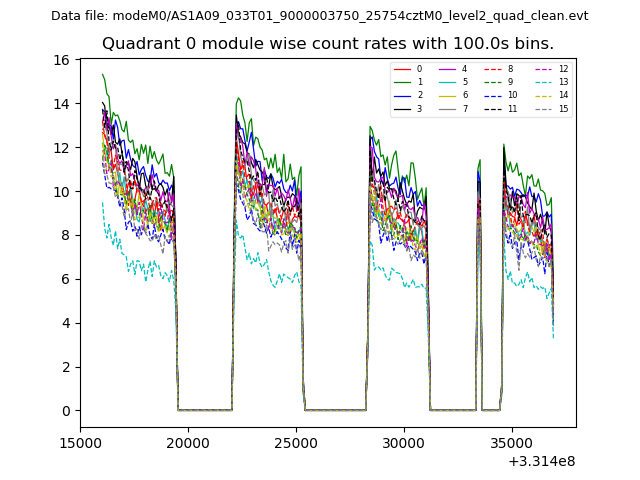 |
 |
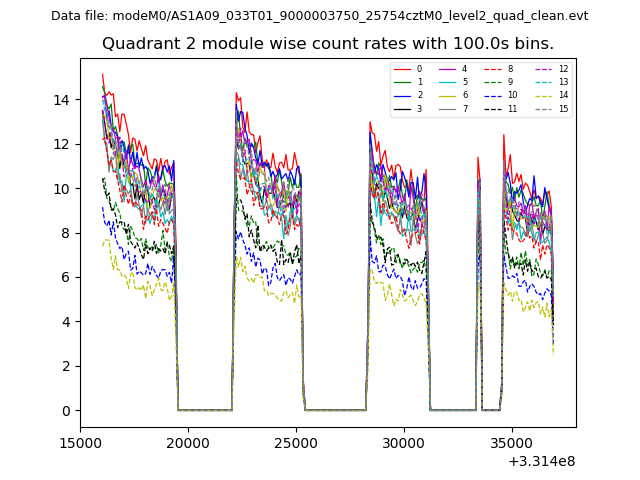
| Module-wise count rates for Quadrant B Data is divided into 100 sec bins |
 |
 |
| Module-wise count rates for Quadrant C Data is divided into 100 sec bins |
 |
 |
| Module-wise count rates for Quadrant D Data is divided into 100 sec bins |
 |
 |
| Parameter | Plot |
|---|---|
| CZT HV Monitor | 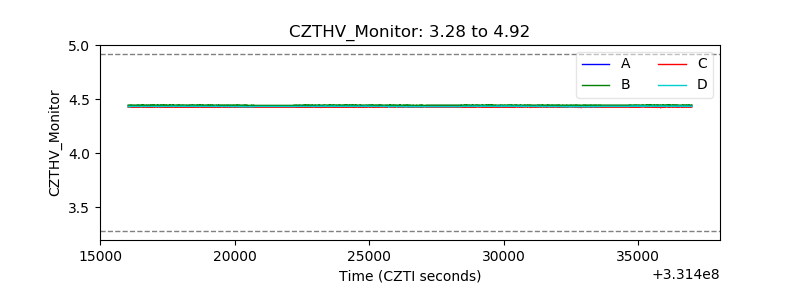 |
| D_VDD | 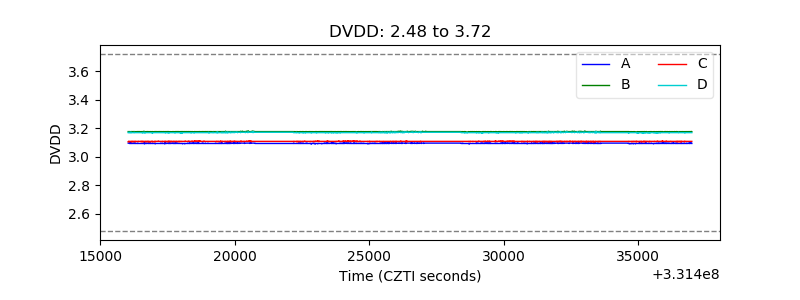 |
| Temperature 1 | 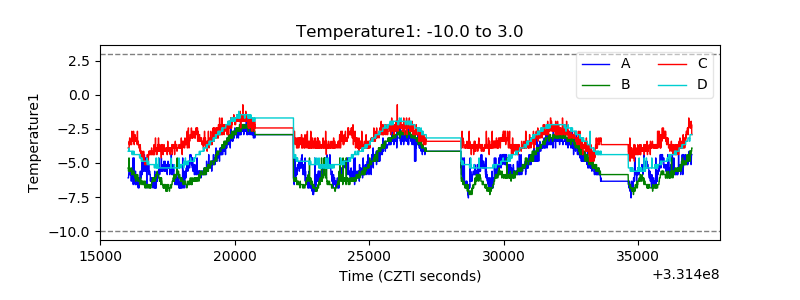 |
| Veto HV Monitor | 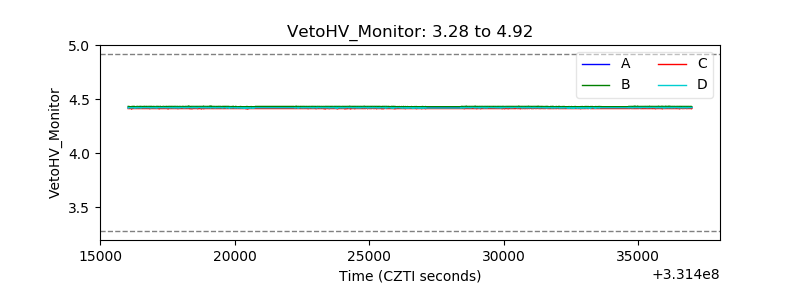 |
| Veto LLD | 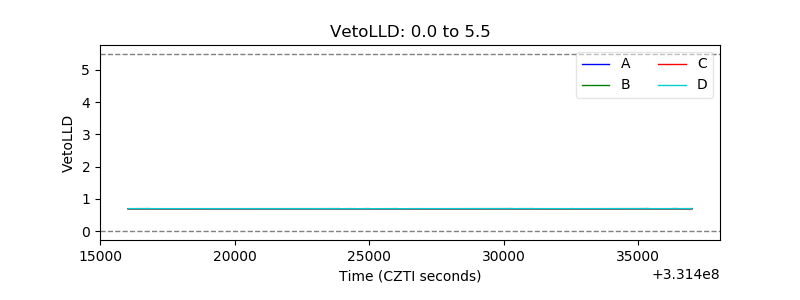 |
| Alpha Counter | 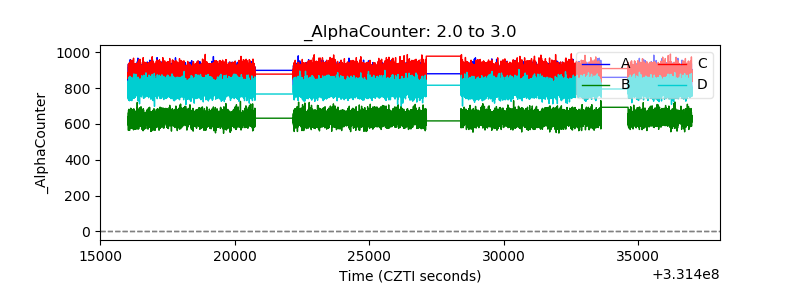 |
| _CPM_Rate | 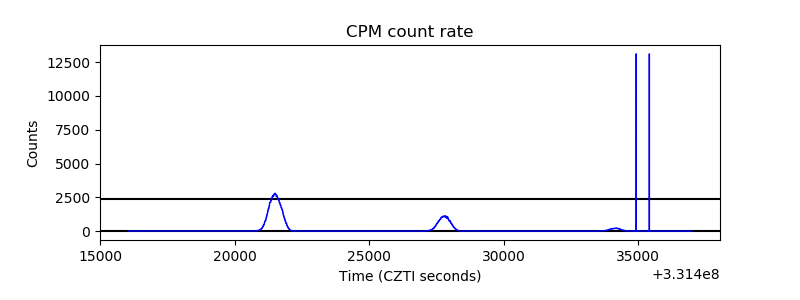 |
| CZT Counter | 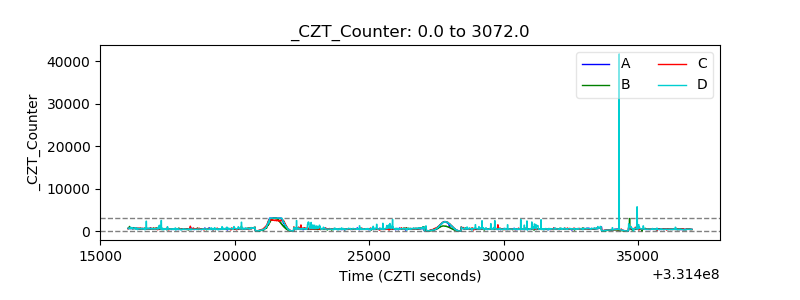 |
| +2.5 Volts monitor |  |
| +5 Volts monitor |  |
| _ROLL_ROT | 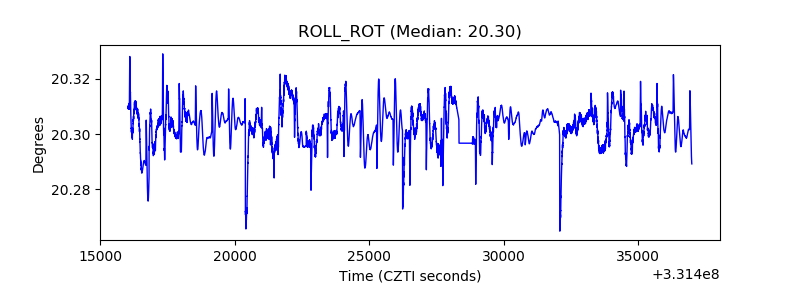 |
| _Roll_DEC | 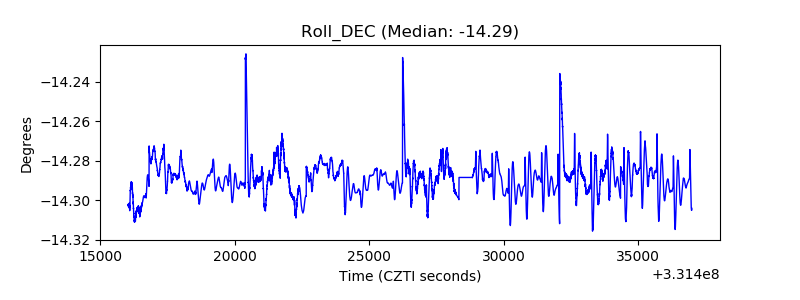 |
| _Roll_RA | 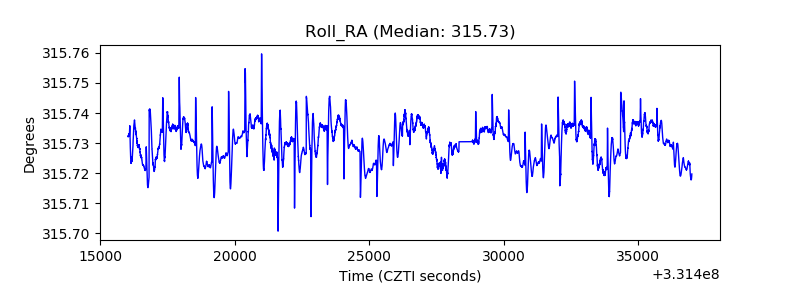 |
| Veto Counter |  |