| Param | Original file | Final file |
|---|---|---|
| Filename | modeM0/AS1A07_027T11_9000003752cztM0_level2.fits | modeM0/AS1A07_027T11_9000003752cztM0_level2_quad_clean.evt |
| Size (bytes) | 232,217,280 | 241,119,360 |
| Size | 221.5 MB | 229.9 MB |
| Events in quadrant A | 1,412,126 | 1,479,382 |
| Events in quadrant B | 1,357,460 | 1,487,962 |
| Events in quadrant C | 1,387,116 | 1,403,248 |
| Events in quadrant D | 1,209,820 | 1,266,109 |
| Mode M0 | |||
|---|---|---|---|
| Quadrant | BADHDUFLAG | Total packets | Discarded packets |
| A | 0 | 50343 | 0 |
| B | 0 | 50429 | 0 |
| C | 0 | 51106 | 0 |
| D | 0 | 60126 | 0 |
| Mode M9 | |||
|---|---|---|---|
| Quadrant | BADHDUFLAG | Total packets | Discarded packets |
| A | 0 | 12 | 0 |
| B | 0 | 12 | 0 |
| C | 0 | 12 | 0 |
| D | 0 | 12 | 0 |
| Mode SS | |||
|---|---|---|---|
| Quadrant | BADHDUFLAG | Total packets | Discarded packets |
| A | 0 | 490 | 0 |
| B | 0 | 490 | 0 |
| C | 0 | 490 | 0 |
| D | 0 | 490 | 0 |
| Quadrant | Total seconds | Saturated seconds | Saturation percentage |
|---|---|---|---|
| A | 24207 | 645 | 2.664519% |
| B | 24207 | 729 | 3.011526% |
| C | 24206 | 737 | 3.044700% |
| D | 24207 | 974 | 4.023630% |
Noise dominated data is calculated using 1-second bins in cleaned event files. If a bin has >2000 counts, and if more than 50% of those come from <1% of pixels, then it is considered to be noise-dominated and hence unusable.
| Quadrant | # 1 sec bins | Bins with >0 counts | Bins with >2000 counts | High rate bins dominated by noise | Noise dominated (total time) | Noise dominated (detector-on time) | Marked lightcurve |
|---|---|---|---|---|---|---|---|
| A | 25457 | 24204 | 0 | 0 | 0.00% | 0.00% |  |
| B | 25457 | 24201 | 0 | 0 | 0.00% | 0.00% |  |
| C | 25457 | 24201 | 0 | 0 | 0.00% | 0.00% |  |
| D | 25457 | 24195 | 0 | 0 | 0.00% | 0.00% |  |
Top three noisy pixels from each quadrant. If the there are fewer than three noisy pixels in the level2.evt file, extra rows are filled as -1
| Pixel properties | Quadrant properties | ||||||
|---|---|---|---|---|---|---|---|
| Quadrant | DetID | PixID | Counts | Sigma | Mean | Median | Sigma |
| A | 0 | 29 | 1341 | 10.79 | 367 | 344 | 92.4 |
| A | 7 | 110 | 1194 | 9.2 | 367 | 344 | 92.4 |
| A | 0 | 30 | 1064 | 7.79 | 367 | 344 | 92.4 |
| B | 2 | 9 | 1033 | 9.55 | 357 | 339 | 72.7 |
| B | 5 | 225 | 928 | 8.1 | 357 | 339 | 72.7 |
| B | 3 | 17 | 899 | 7.7 | 357 | 339 | 72.7 |
| C | 12 | 241 | 988 | 6.9 | 365 | 340 | 93.9 |
| C | 2 | 191 | 961 | 6.61 | 365 | 340 | 93.9 |
| C | 9 | 209 | 950 | 6.5 | 365 | 340 | 93.9 |
| D | 6 | 231 | 871 | 6.0 | 344 | 313 | 93.0 |
| D | 6 | 67 | 869 | 5.98 | 344 | 313 | 93.0 |
| D | 4 | 246 | 848 | 5.75 | 344 | 313 | 93.0 |
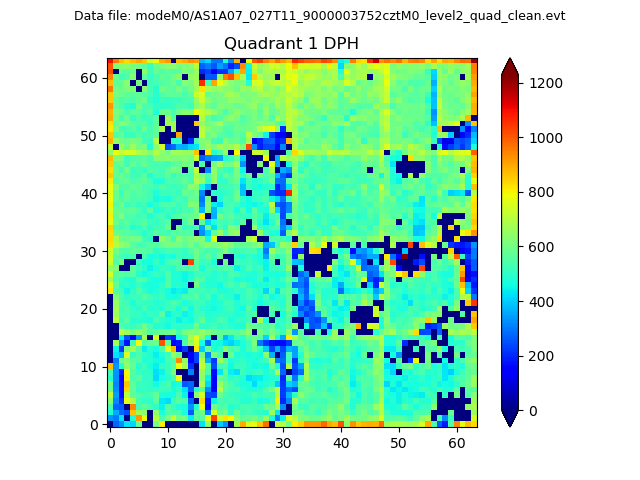
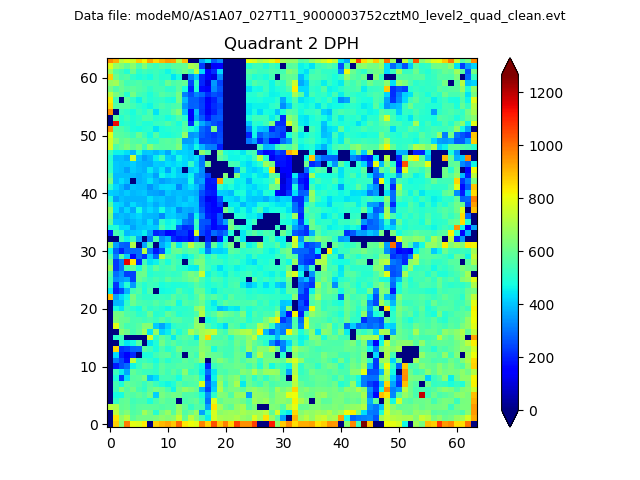
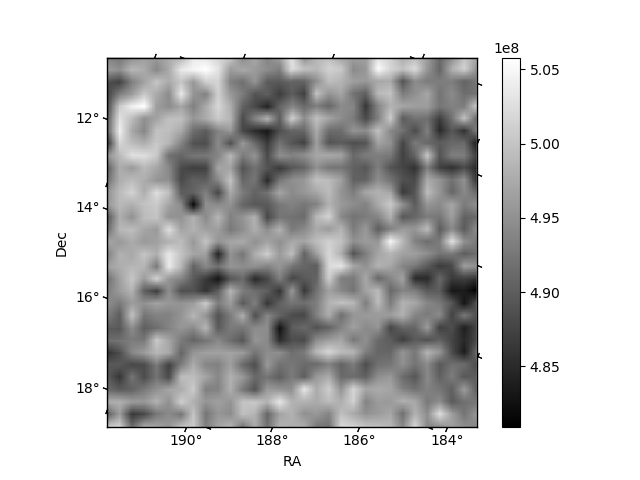
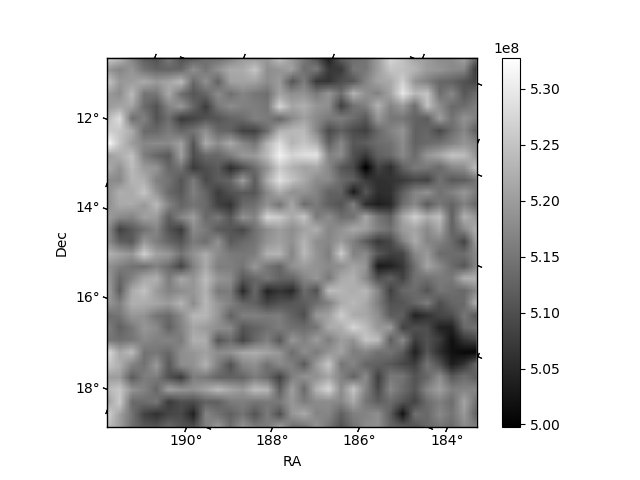
Histogram calculated using DETX and DETY for each event in the final _common_clean file
| Quadrant A |  |
 |
Quadrant B |
|---|---|---|---|
| Quadrant D | 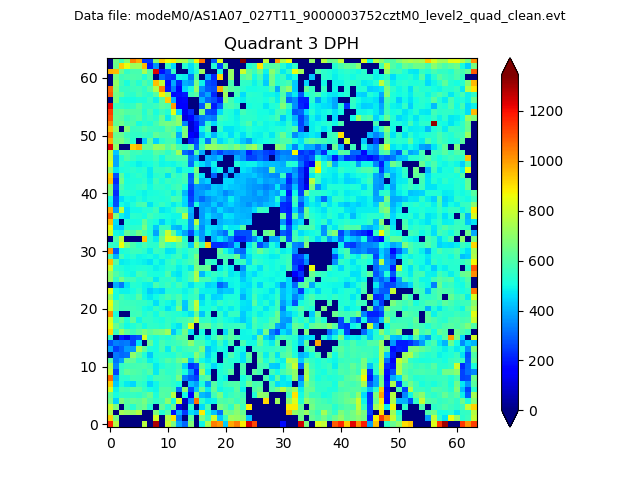 |
 |
Quadrant C |
| Plot type | Count rate plots | Images |
|---|---|---|
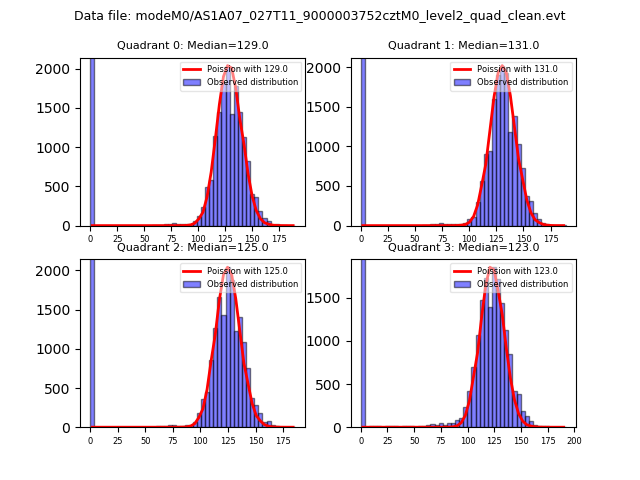
| Comparison with Poisson distribution Blue bars denote a histogram of data divided into 1 sec bins. Red curve is a Poisson curve with rate = median count rate of data. |
 |
 |
| Quadrant-wise count rates Data is divided into 100 sec bins |
 |
|
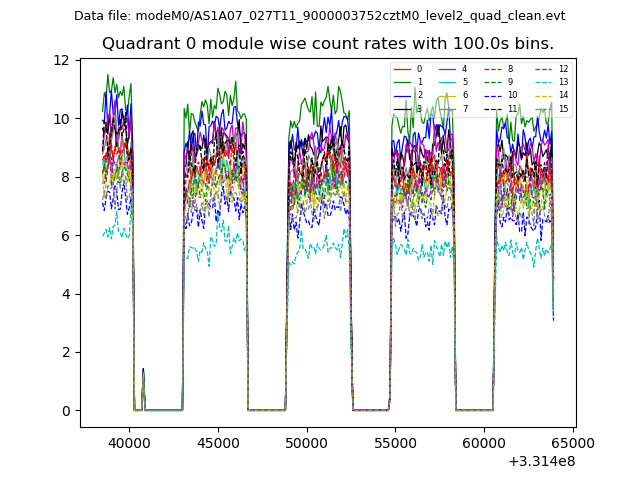
| Module-wise count rates for Quadrant A Data is divided into 100 sec bins |
 |
 |
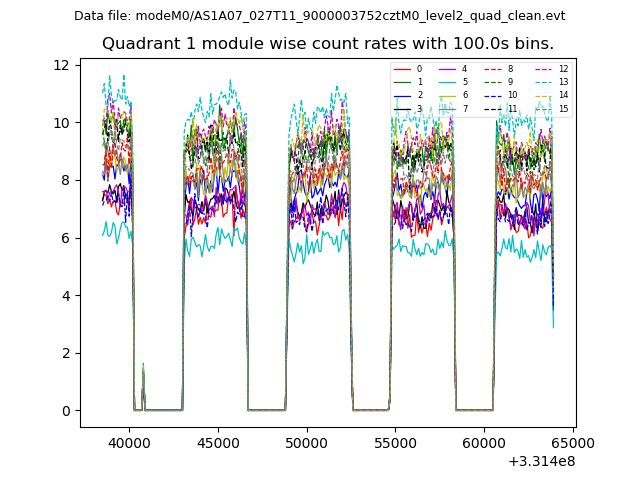
| Module-wise count rates for Quadrant B Data is divided into 100 sec bins |
 |
 |
| Module-wise count rates for Quadrant C Data is divided into 100 sec bins |
 |
 |
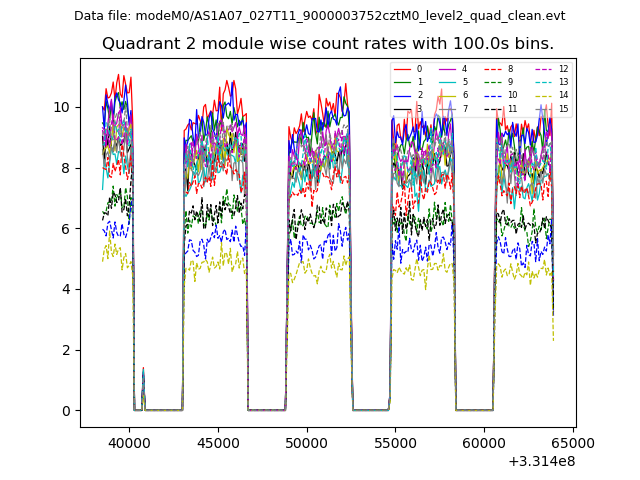
| Module-wise count rates for Quadrant D Data is divided into 100 sec bins |
 |
 |
| Parameter | Plot |
|---|---|
| CZT HV Monitor |  |
| D_VDD | 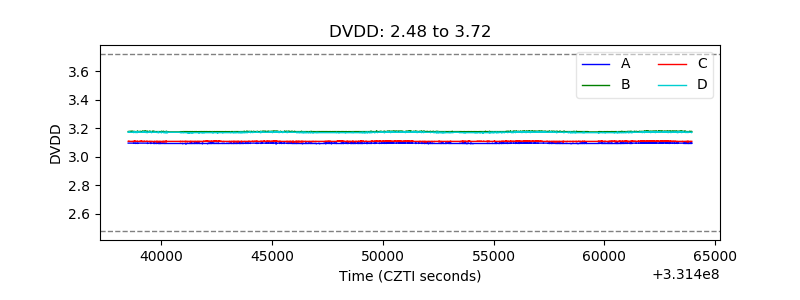 |
| Temperature 1 |  |
| Veto HV Monitor |  |
| Veto LLD | 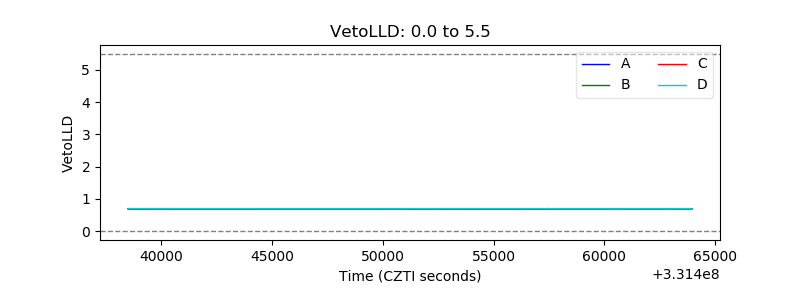 |
| Alpha Counter |  |
| _CPM_Rate |  |
| CZT Counter | 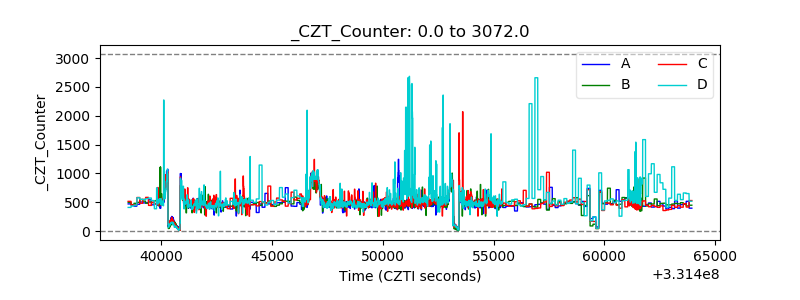 |
| +2.5 Volts monitor | 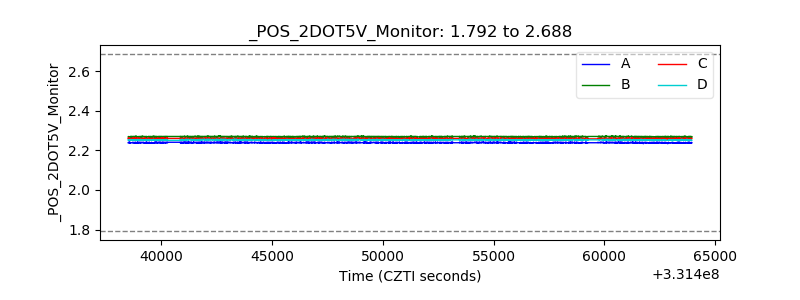 |
| +5 Volts monitor |  |
| _ROLL_ROT |  |
| _Roll_DEC | 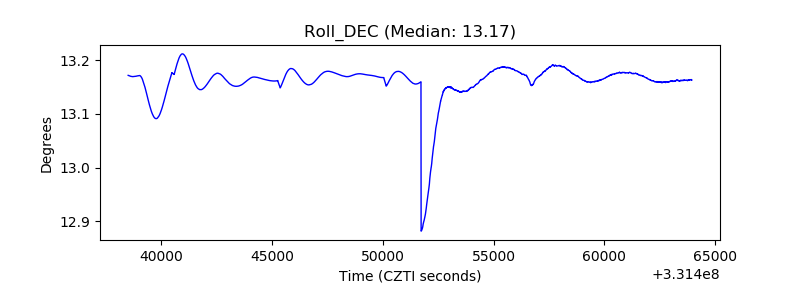 |
| _Roll_RA | 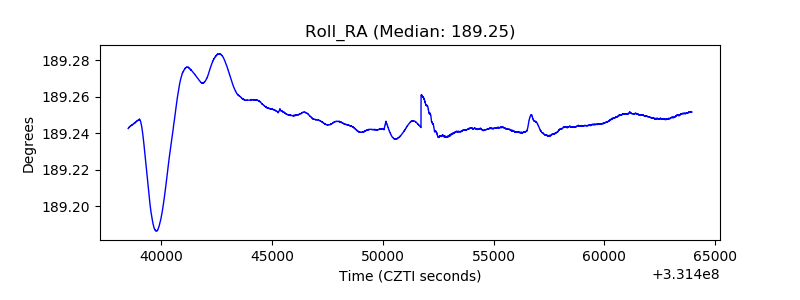 |
| Veto Counter |  |