| Param | Original file | Final file |
|---|---|---|
| Filename | modeM0/AS1A07_027T11_9000003752_25754cztM0_level2.evt | modeM0/AS1A07_027T11_9000003752_25754cztM0_level2_quad_clean.evt |
| Size (bytes) | 240,756,480 | 40,602,240 |
| Size | 229.6 MB | 38.7 MB |
| Events in quadrant A | 1,694,063 | 250,616 |
| Events in quadrant B | 1,752,749 | 253,930 |
| Events in quadrant C | 1,782,778 | 243,441 |
| Events in quadrant D | 1,830,570 | 241,645 |
| Mode M0 | |||
|---|---|---|---|
| Quadrant | BADHDUFLAG | Total packets | Discarded packets |
| A | 0 | 7107 | 0 |
| B | 0 | 7183 | 0 |
| C | 0 | 7270 | 0 |
| D | 0 | 7535 | 0 |
| Mode M9 | |||
|---|---|---|---|
| Quadrant | BADHDUFLAG | Total packets | Discarded packets |
| A | 0 | 5 | 0 |
| B | 0 | 5 | 0 |
| C | 0 | 5 | 0 |
| D | 0 | 5 | 0 |
| Quadrant | Total seconds | Saturated seconds | Saturation percentage |
|---|---|---|---|
| A | 3374 | 66 | 1.956135% |
| B | 3374 | 99 | 2.934203% |
| C | 3373 | 84 | 2.490365% |
| D | 3374 | 57 | 1.689389% |
Noise dominated data is calculated using 1-second bins in cleaned event files. If a bin has >2000 counts, and if more than 50% of those come from <1% of pixels, then it is considered to be noise-dominated and hence unusable.
| Quadrant | # 1 sec bins | Bins with >0 counts | Bins with >2000 counts | High rate bins dominated by noise | Noise dominated (total time) | Noise dominated (detector-on time) | Marked lightcurve |
|---|---|---|---|---|---|---|---|
| A | 3924 | 3374 | 0 | 0 | 0.00% | 0.00% | 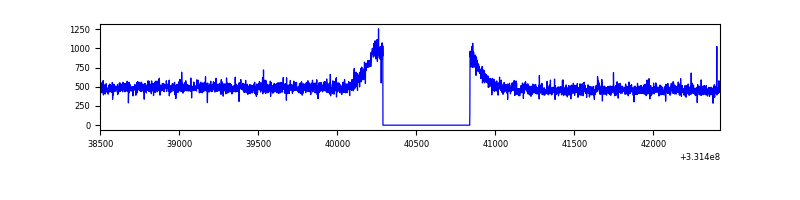 |
| B | 3924 | 3374 | 0 | 0 | 0.00% | 0.00% | 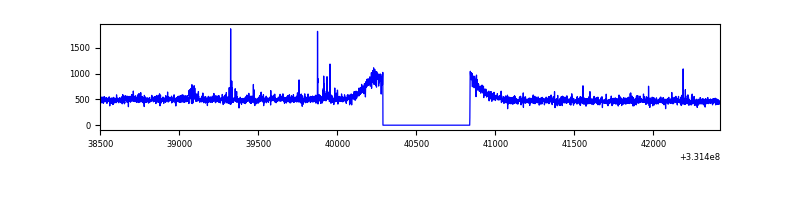 |
| C | 3924 | 3375 | 1 | 1 | 0.03% | 0.03% | 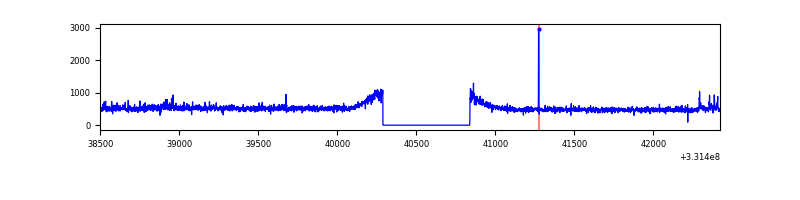 |
| D | 3924 | 3374 | 19 | 19 | 0.48% | 0.56% | 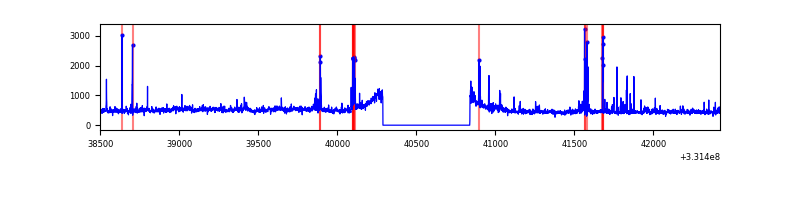 |
Top three noisy pixels from each quadrant. If the there are fewer than three noisy pixels in the level2.evt file, extra rows are filled as -1
| Pixel properties | Quadrant properties | ||||||
|---|---|---|---|---|---|---|---|
| Quadrant | DetID | PixID | Counts | Sigma | Mean | Median | Sigma |
| A | 6 | 16 | 6225 | 64.66 | 437 | 426 | 89.7 |
| A | 13 | 254 | 4669 | 47.31 | 437 | 426 | 89.7 |
| A | 3 | 137 | 4266 | 42.81 | 437 | 426 | 89.7 |
| B | 0 | 219 | 13447 | 148.55 | 437 | 425 | 87.7 |
| B | 0 | 245 | 11899 | 130.89 | 437 | 425 | 87.7 |
| B | 0 | 190 | 10851 | 118.94 | 437 | 425 | 87.7 |
| C | 3 | 233 | 66065 | 637.83 | 423 | 426 | 102.9 |
| C | 14 | 238 | 64354 | 621.2 | 423 | 426 | 102.9 |
| C | 14 | 225 | 4871 | 43.19 | 423 | 426 | 102.9 |
| D | 1 | 52 | 66656 | 642.85 | 425 | 415 | 103.0 |
| D | 8 | 195 | 62849 | 605.91 | 425 | 415 | 103.0 |
| D | 13 | 104 | 53075 | 511.05 | 425 | 415 | 103.0 |
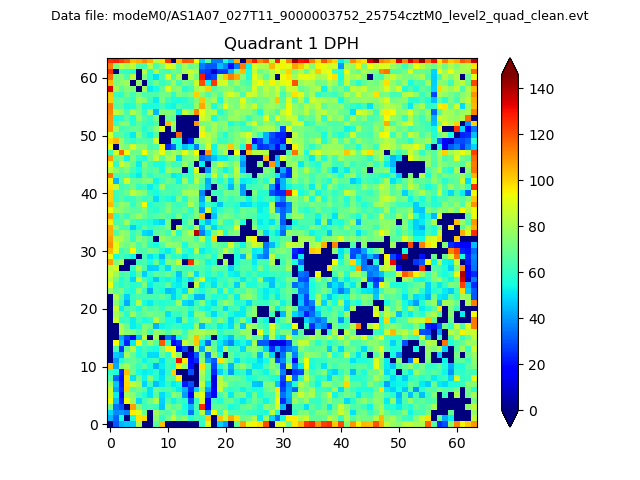
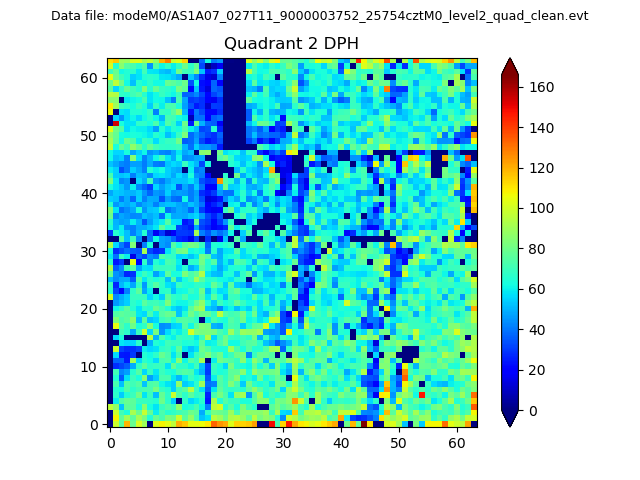
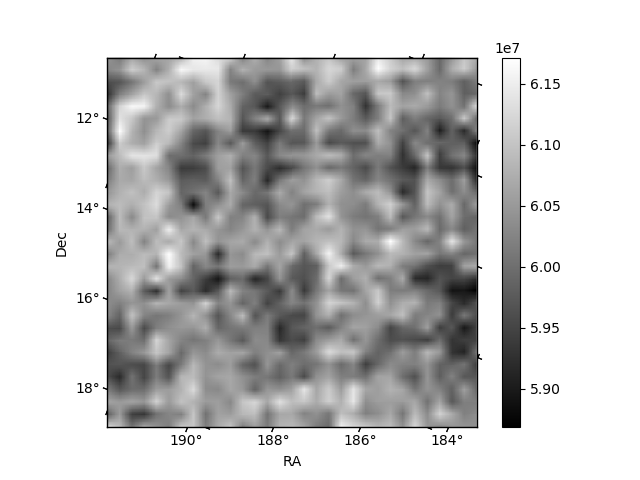
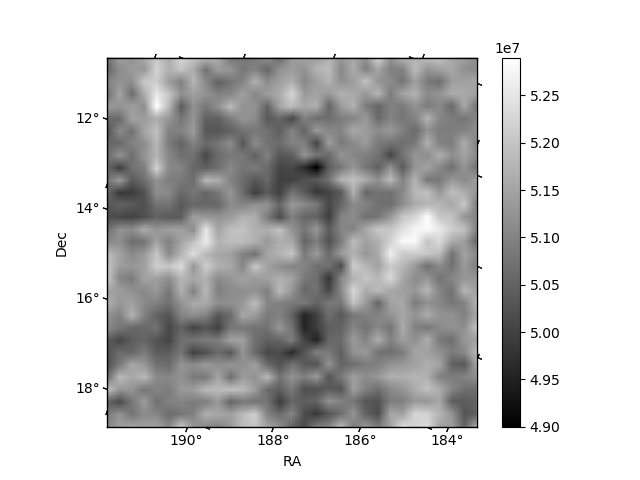
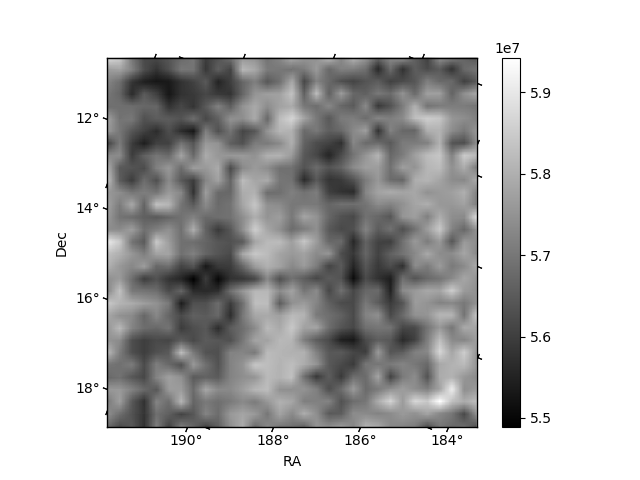
Histogram calculated using DETX and DETY for each event in the final _common_clean file
| Quadrant A |  |
 |
Quadrant B |
|---|---|---|---|
| Quadrant D | 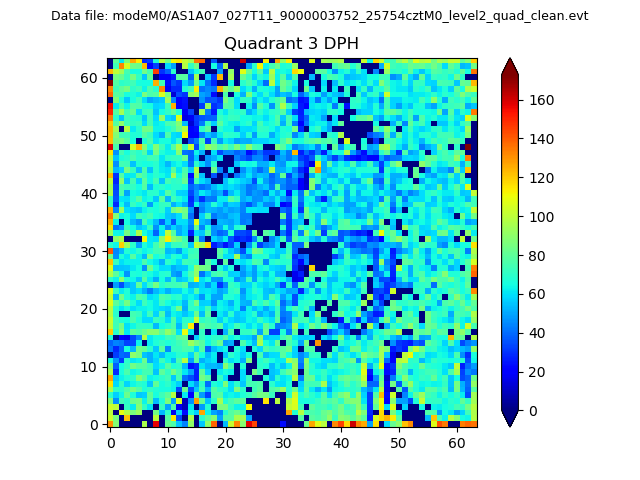 |
 |
Quadrant C |
| Plot type | Count rate plots | Images |
|---|---|---|
| Comparison with Poisson distribution Blue bars denote a histogram of data divided into 1 sec bins. Red curve is a Poisson curve with rate = median count rate of data. |
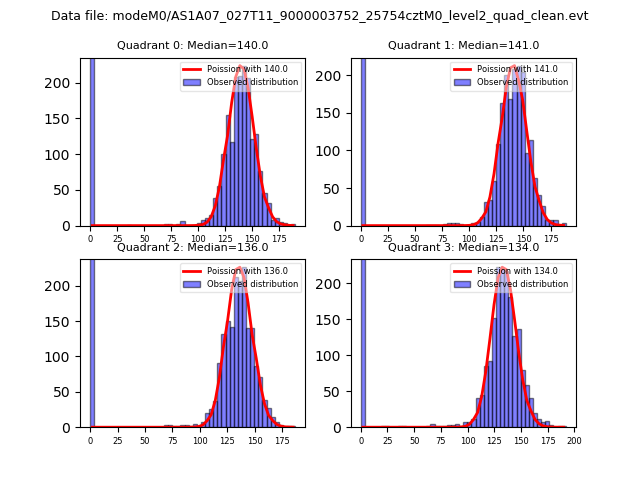 |
 |
| Quadrant-wise count rates Data is divided into 100 sec bins |
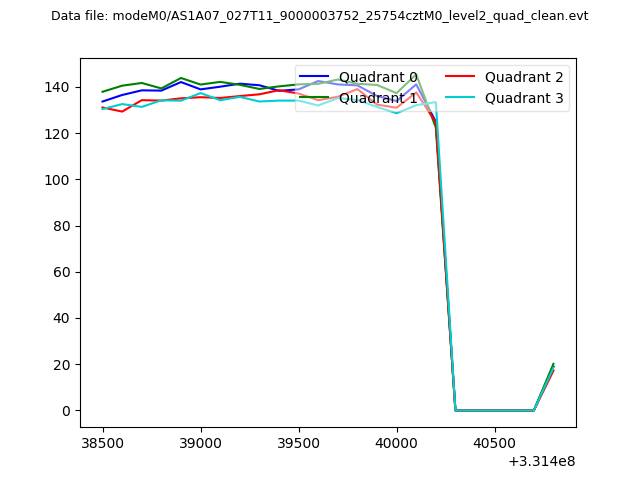 |
|
| Module-wise count rates for Quadrant A Data is divided into 100 sec bins |
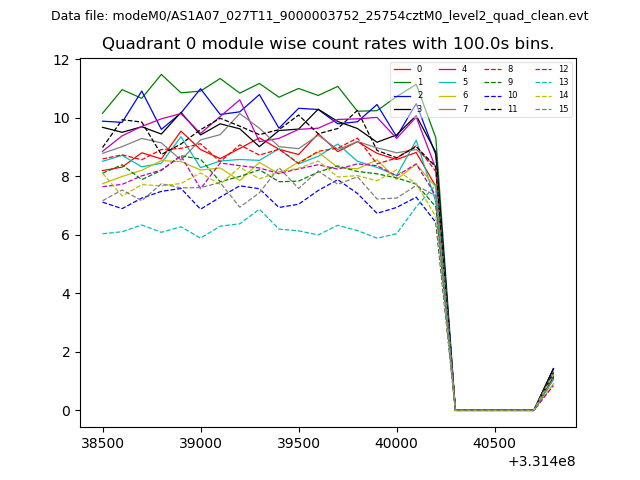 |
 |
| Module-wise count rates for Quadrant B Data is divided into 100 sec bins |
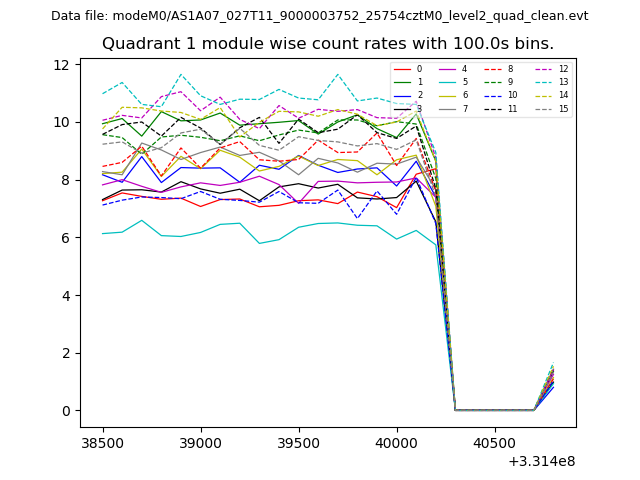 |
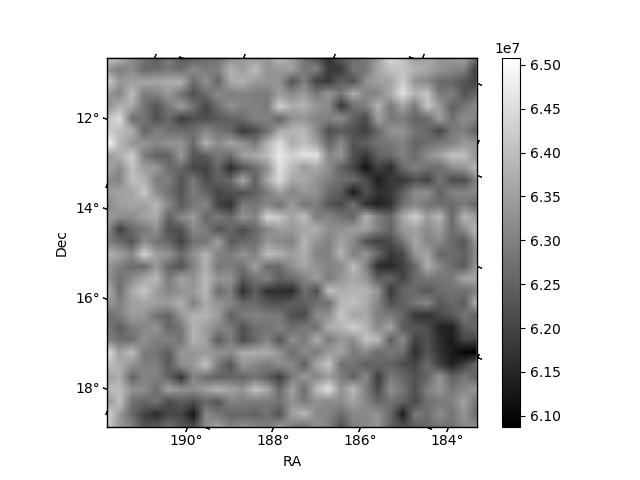 |
| Module-wise count rates for Quadrant C Data is divided into 100 sec bins |
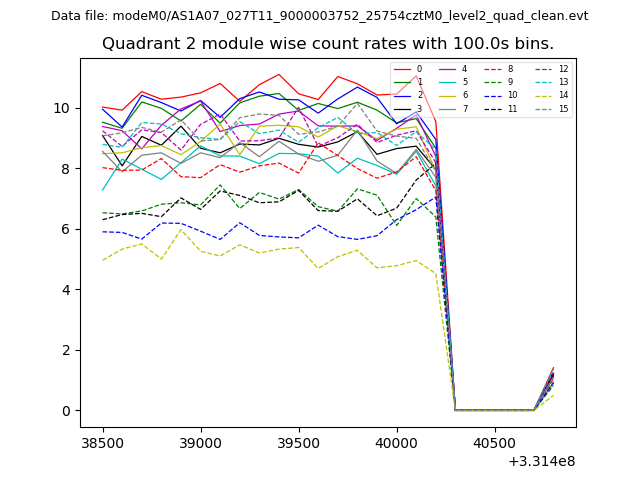 |
 |
| Module-wise count rates for Quadrant D Data is divided into 100 sec bins |
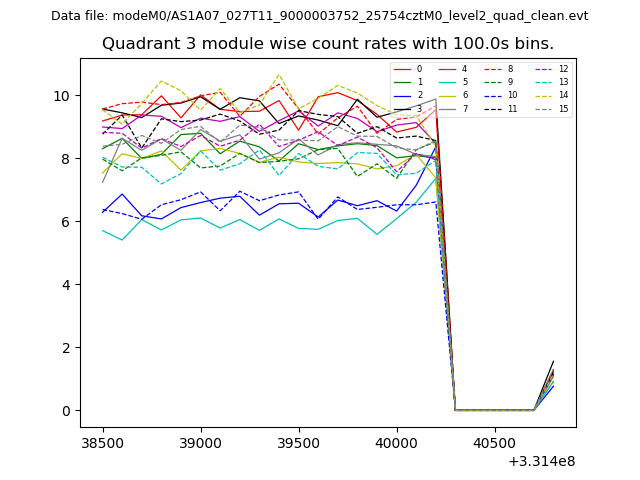 |
 |
| Parameter | Plot |
|---|---|
| CZT HV Monitor | 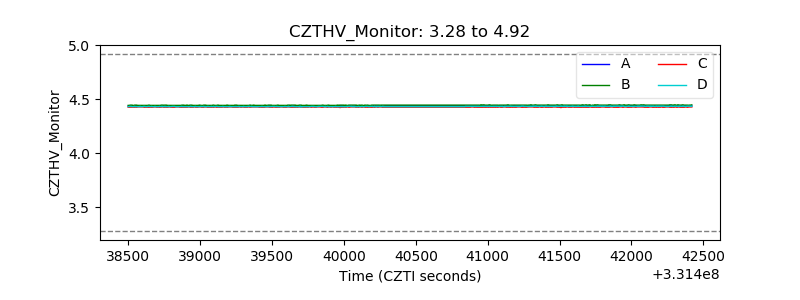 |
| D_VDD | 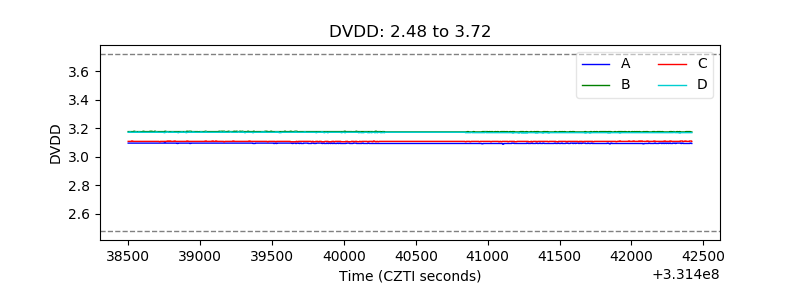 |
| Temperature 1 | 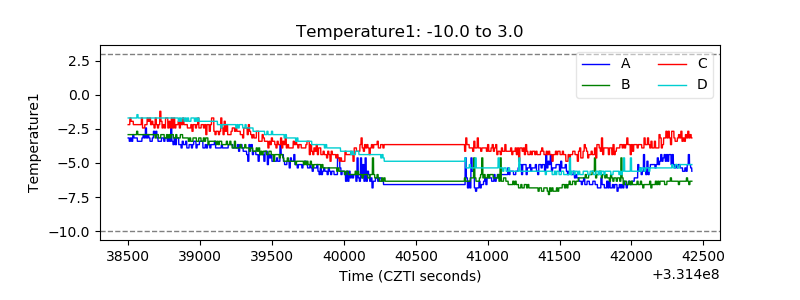 |
| Veto HV Monitor | 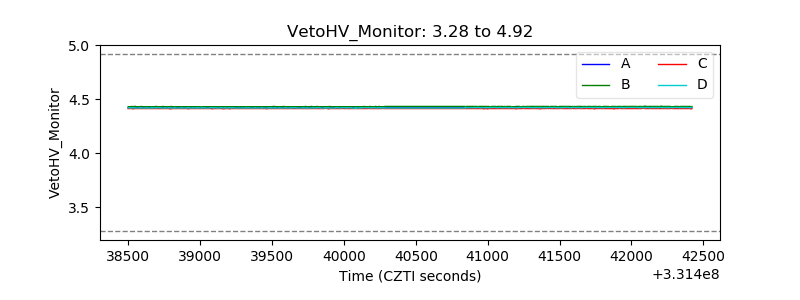 |
| Veto LLD | 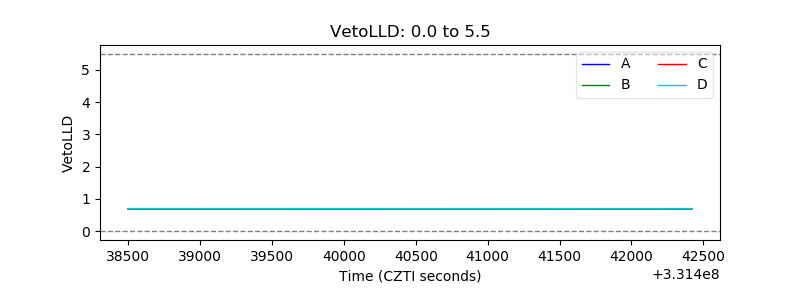 |
| Alpha Counter | 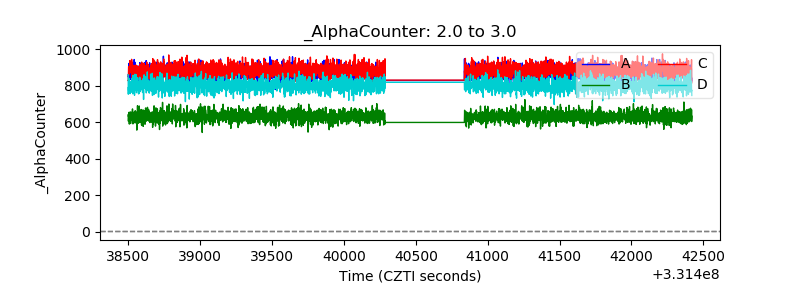 |
| _CPM_Rate | 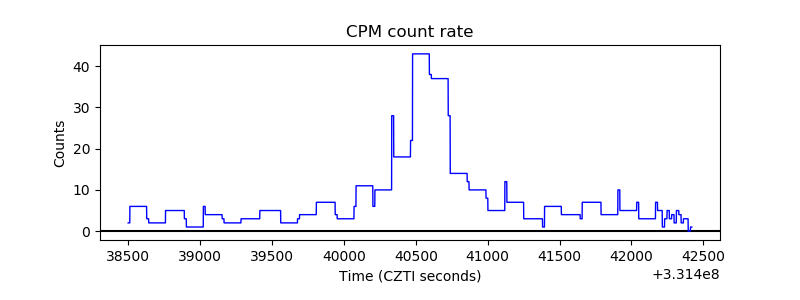 |
| CZT Counter | 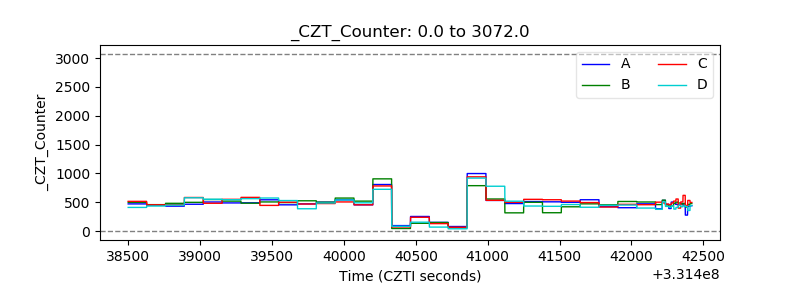 |
| +2.5 Volts monitor | 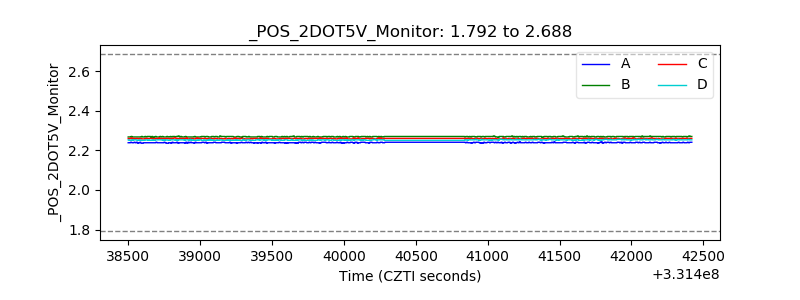 |
| +5 Volts monitor | 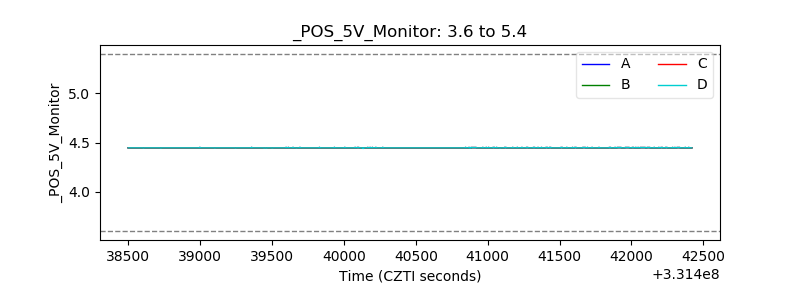 |
| _ROLL_ROT | 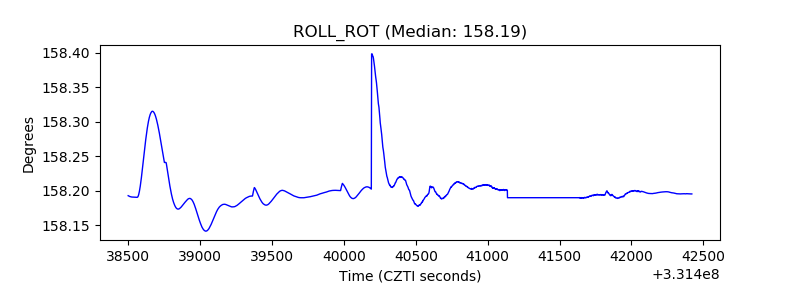 |
| _Roll_DEC | 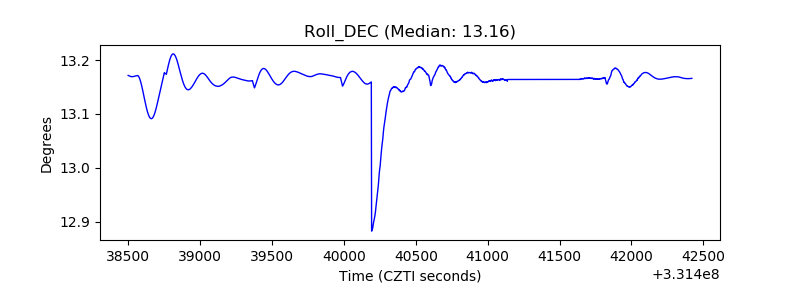 |
| _Roll_RA |  |
| Veto Counter | 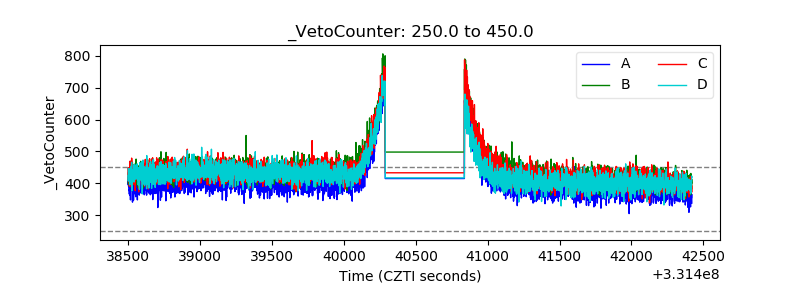 |