| Param | Original file | Final file |
|---|---|---|
| Filename | modeM0/AS1A07_027T11_9000003752_25755cztM0_level2.evt | modeM0/AS1A07_027T11_9000003752_25755cztM0_level2_quad_clean.evt |
| Size (bytes) | 561,378,240 | 79,842,240 |
| Size | 535.4 MB | 76.1 MB |
| Events in quadrant A | 3,910,327 | 474,204 |
| Events in quadrant B | 3,992,213 | 481,381 |
| Events in quadrant C | 4,166,870 | 459,933 |
| Events in quadrant D | 4,397,048 | 454,475 |
| Mode M0 | |||
|---|---|---|---|
| Quadrant | BADHDUFLAG | Total packets | Discarded packets |
| A | 0 | 16595 | 0 |
| B | 0 | 16615 | 0 |
| C | 0 | 17145 | 0 |
| D | 0 | 17939 | 0 |
| Mode M9 | |||
|---|---|---|---|
| Quadrant | BADHDUFLAG | Total packets | Discarded packets |
| A | 0 | 4 | 0 |
| B | 0 | 5 | 0 |
| C | 0 | 5 | 0 |
| D | 0 | 5 | 0 |
| Quadrant | Total seconds | Saturated seconds | Saturation percentage |
|---|---|---|---|
| A | 7875 | 361 | 4.584127% |
| B | 7875 | 390 | 4.952381% |
| C | 7874 | 381 | 4.838710% |
| D | 7874 | 321 | 4.076708% |
Noise dominated data is calculated using 1-second bins in cleaned event files. If a bin has >2000 counts, and if more than 50% of those come from <1% of pixels, then it is considered to be noise-dominated and hence unusable.
| Quadrant | # 1 sec bins | Bins with >0 counts | Bins with >2000 counts | High rate bins dominated by noise | Noise dominated (total time) | Noise dominated (detector-on time) | Marked lightcurve |
|---|---|---|---|---|---|---|---|
| A | 7875 | 7875 | 1 | 1 | 0.01% | 0.01% | 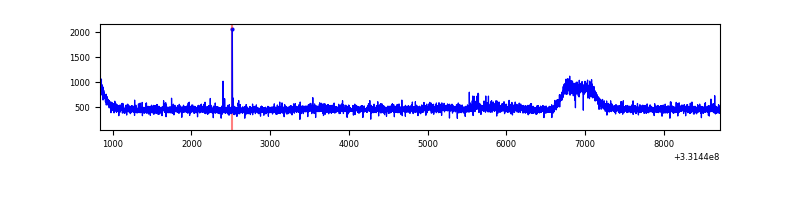 |
| B | 7875 | 7875 | 1 | 1 | 0.01% | 0.01% | 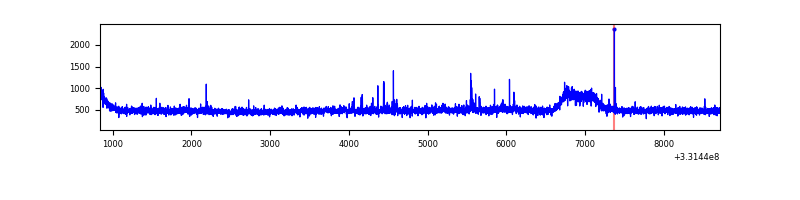 |
| C | 7874 | 7874 | 1 | 1 | 0.01% | 0.01% | 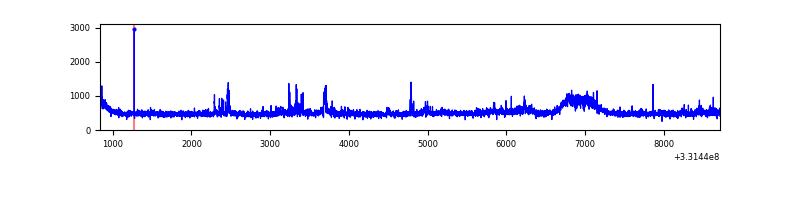 |
| D | 7874 | 7874 | 33 | 33 | 0.42% | 0.42% | 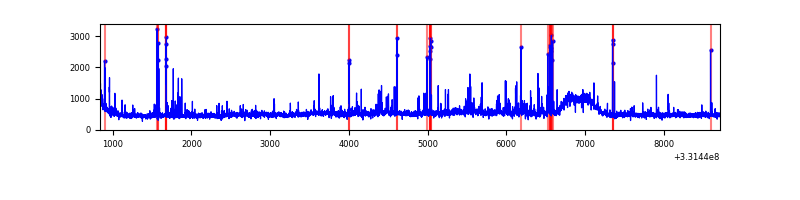 |
Top three noisy pixels from each quadrant. If the there are fewer than three noisy pixels in the level2.evt file, extra rows are filled as -1
| Pixel properties | Quadrant properties | ||||||
|---|---|---|---|---|---|---|---|
| Quadrant | DetID | PixID | Counts | Sigma | Mean | Median | Sigma |
| A | 6 | 16 | 43116 | 206.16 | 1003 | 979 | 204.4 |
| A | 13 | 254 | 10252 | 45.37 | 1003 | 979 | 204.4 |
| A | 3 | 137 | 9971 | 44.0 | 1003 | 979 | 204.4 |
| B | 0 | 245 | 34717 | 171.62 | 997 | 970 | 196.6 |
| B | 0 | 219 | 32513 | 160.41 | 997 | 970 | 196.6 |
| B | 12 | 111 | 24686 | 120.61 | 997 | 970 | 196.6 |
| C | 3 | 233 | 236299 | 1030.93 | 965 | 973 | 228.3 |
| C | 14 | 238 | 150650 | 655.71 | 965 | 973 | 228.3 |
| C | 14 | 225 | 22301 | 93.43 | 965 | 973 | 228.3 |
| D | 8 | 195 | 281206 | 1197.64 | 978 | 953 | 234.0 |
| D | 13 | 104 | 112722 | 477.64 | 978 | 953 | 234.0 |
| D | 1 | 52 | 106279 | 450.1 | 978 | 953 | 234.0 |
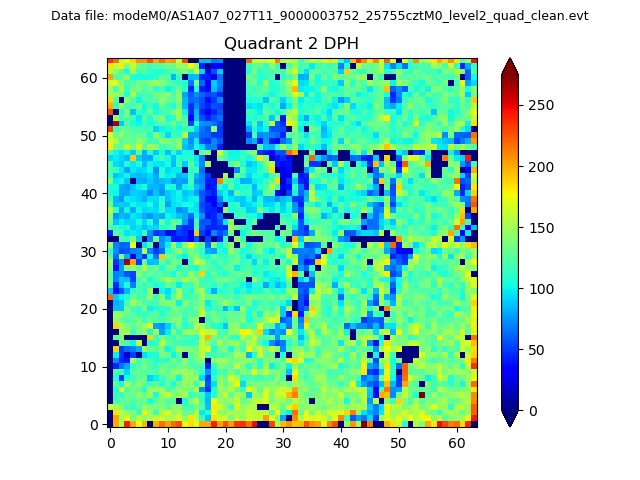
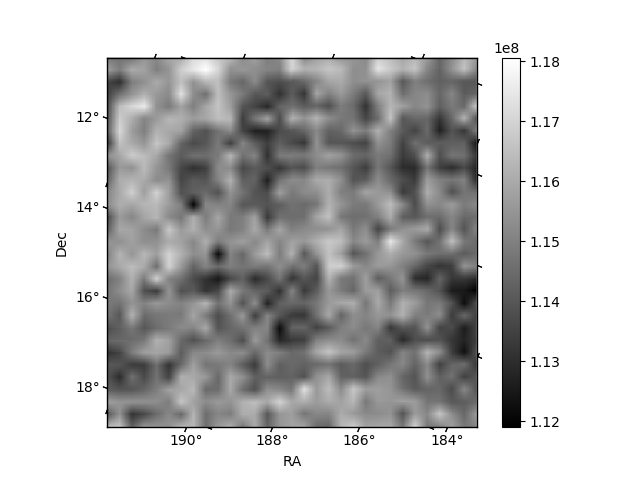
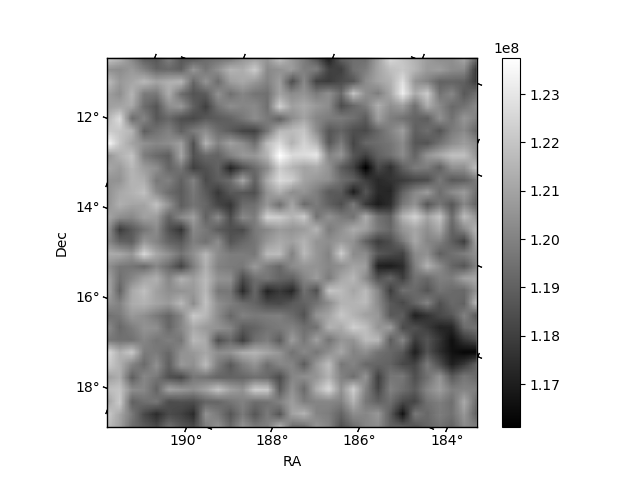
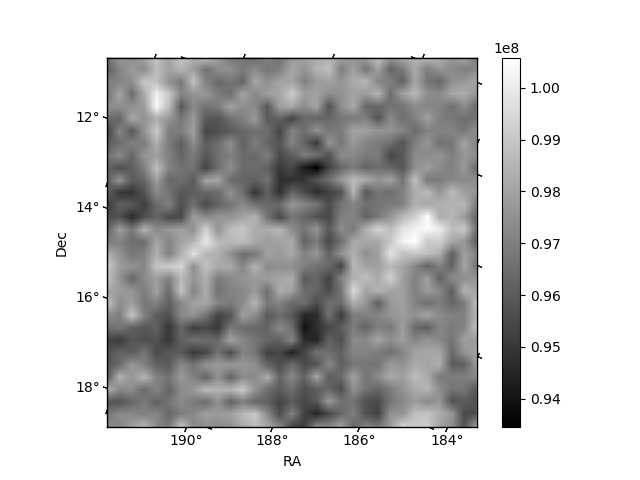
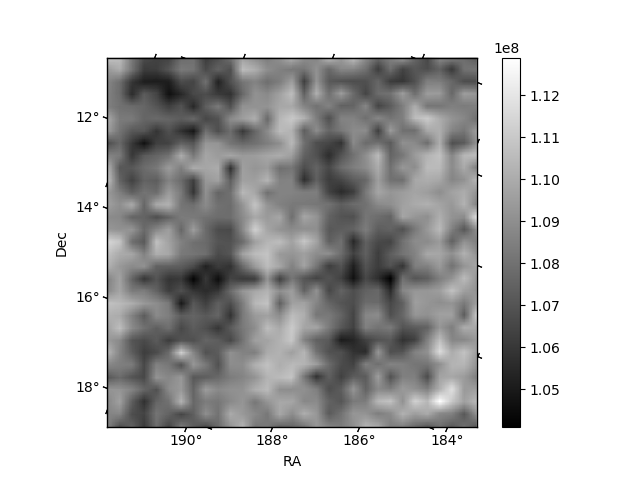
Histogram calculated using DETX and DETY for each event in the final _common_clean file
| Quadrant A | 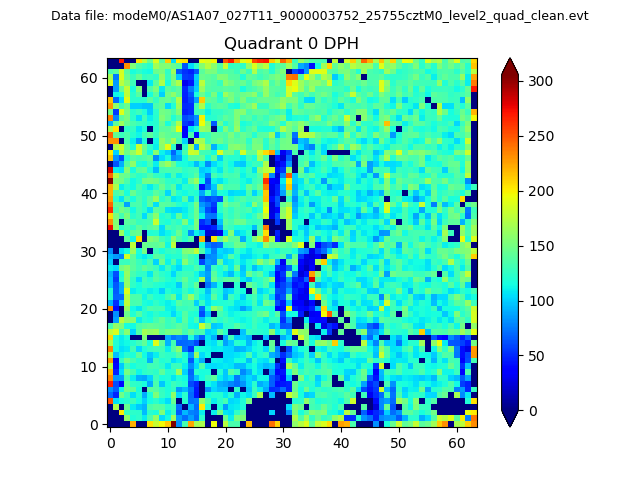 |
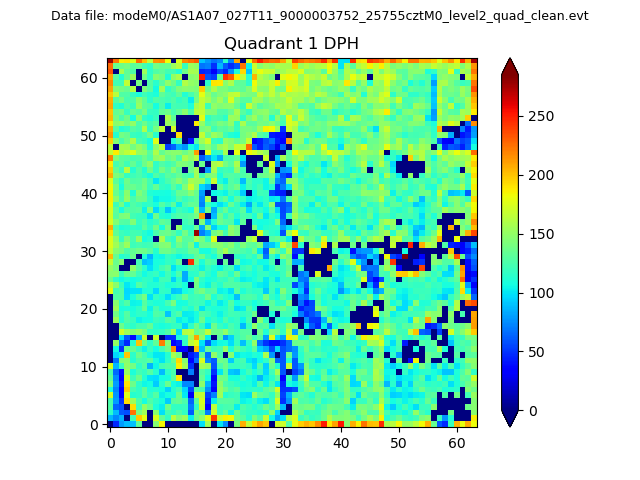 |
Quadrant B |
|---|---|---|---|
| Quadrant D | 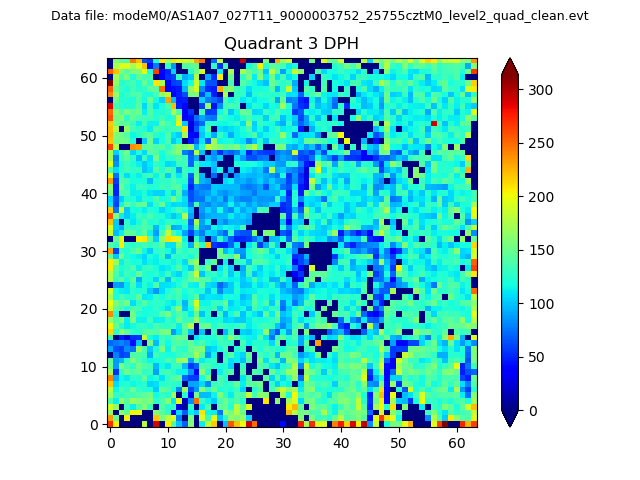 |
 |
Quadrant C |
| Plot type | Count rate plots | Images |
|---|---|---|
| Comparison with Poisson distribution Blue bars denote a histogram of data divided into 1 sec bins. Red curve is a Poisson curve with rate = median count rate of data. |
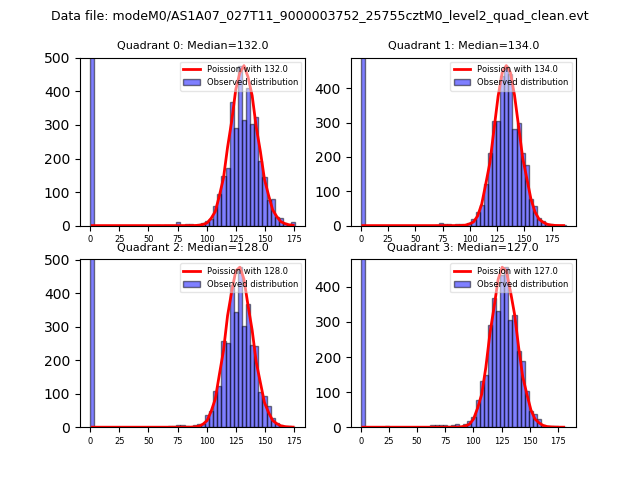 |
 |
| Quadrant-wise count rates Data is divided into 100 sec bins |
 |
|
| Module-wise count rates for Quadrant A Data is divided into 100 sec bins |
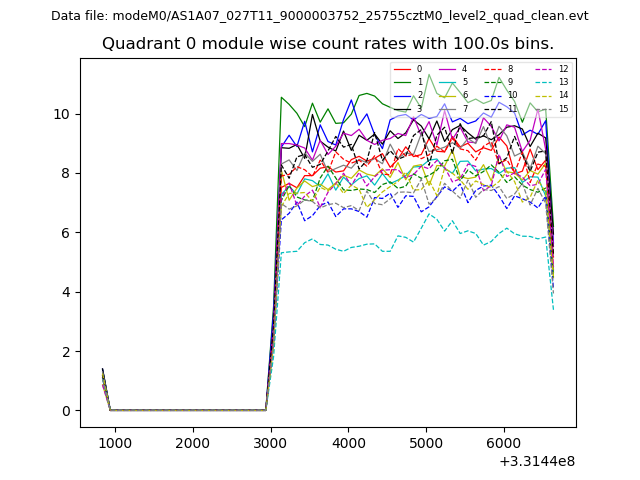 |
 |
| Module-wise count rates for Quadrant B Data is divided into 100 sec bins |
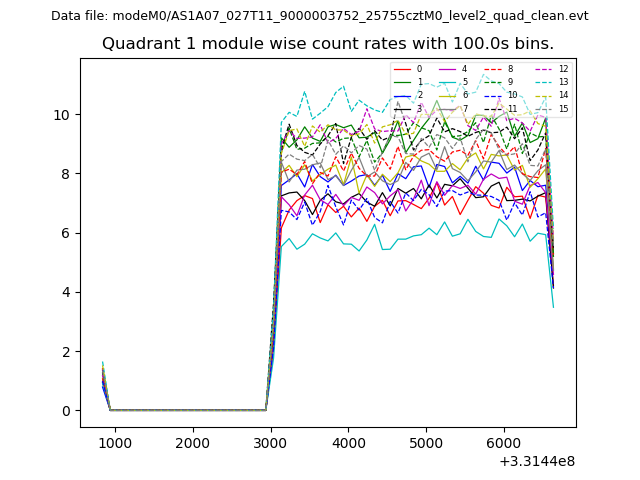 |
 |
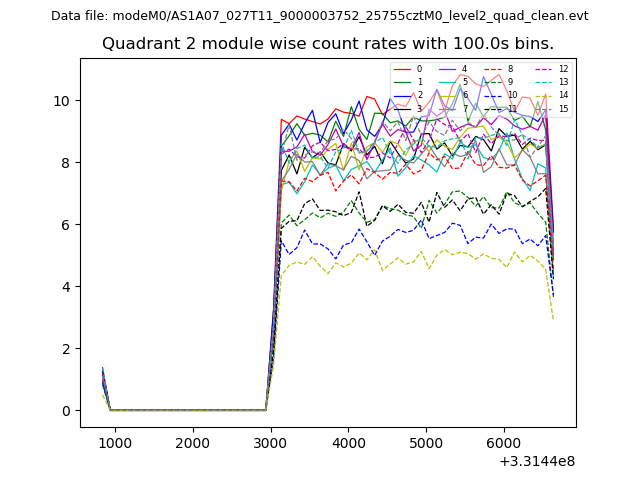
| Module-wise count rates for Quadrant C Data is divided into 100 sec bins |
 |
 |
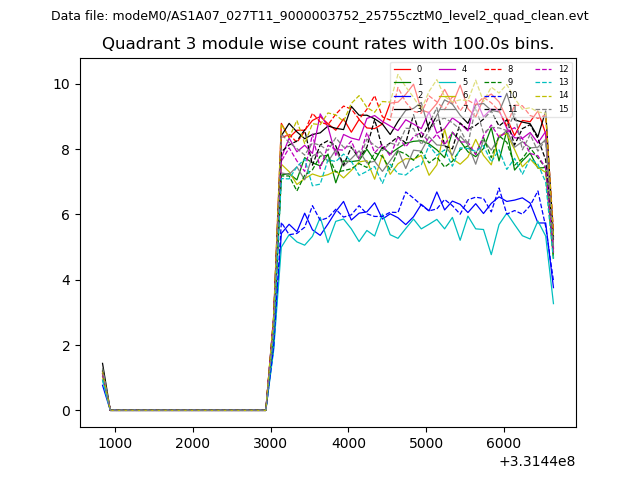
| Module-wise count rates for Quadrant D Data is divided into 100 sec bins |
 |
 |
| Parameter | Plot |
|---|---|
| CZT HV Monitor | 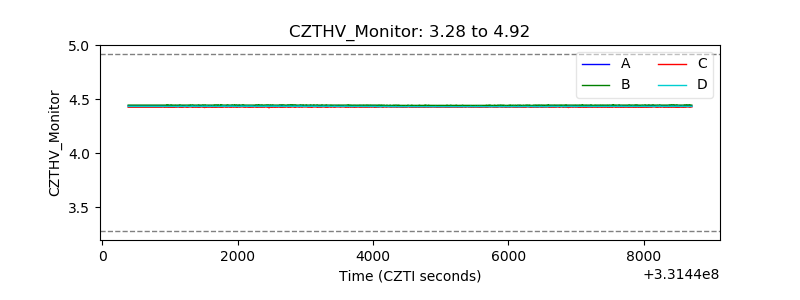 |
| D_VDD | 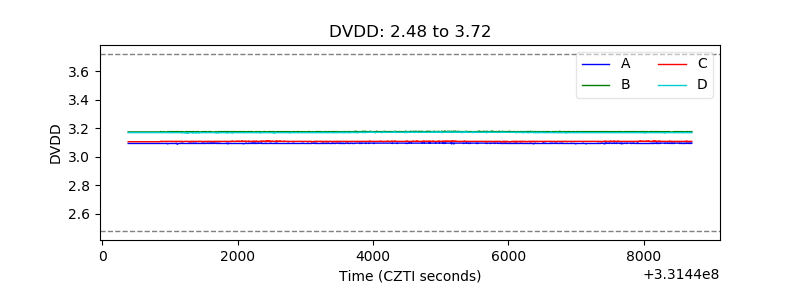 |
| Temperature 1 | 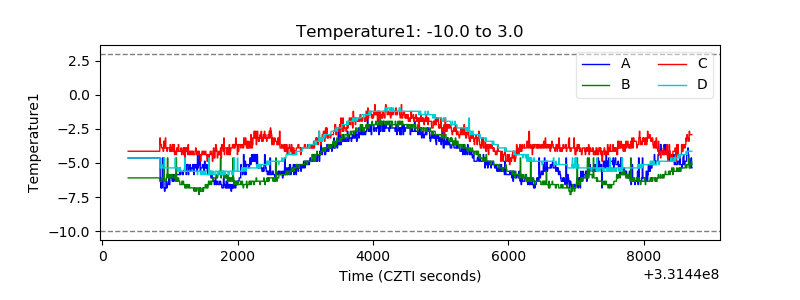 |
| Veto HV Monitor | 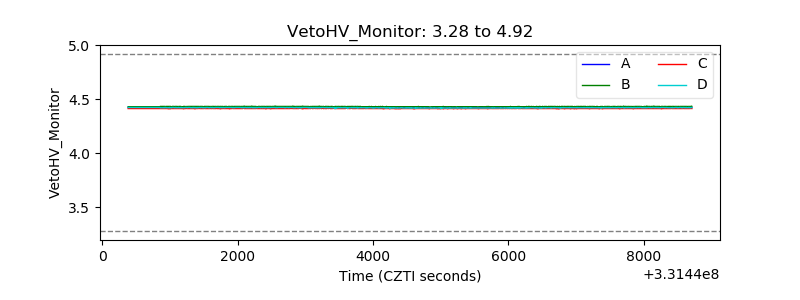 |
| Veto LLD | 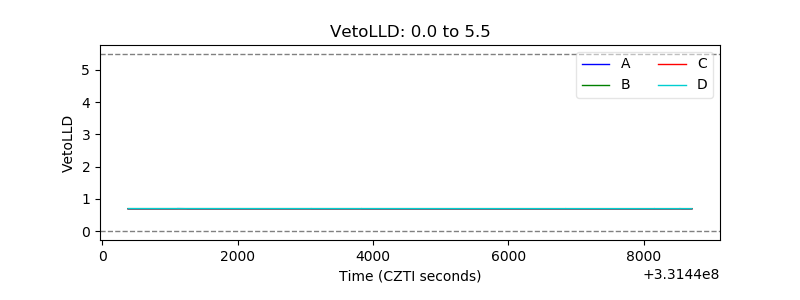 |
| Alpha Counter | 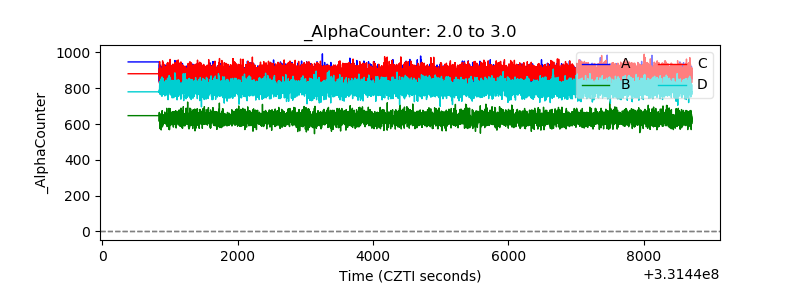 |
| _CPM_Rate | 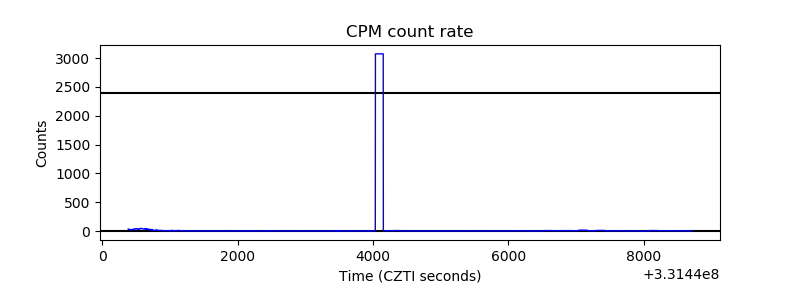 |
| CZT Counter | 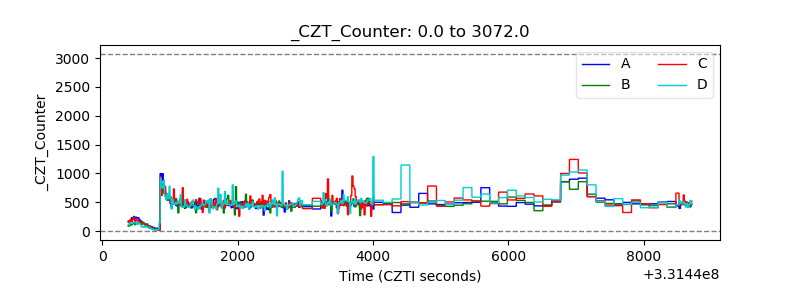 |
| +2.5 Volts monitor |  |
| +5 Volts monitor |  |
| _ROLL_ROT | 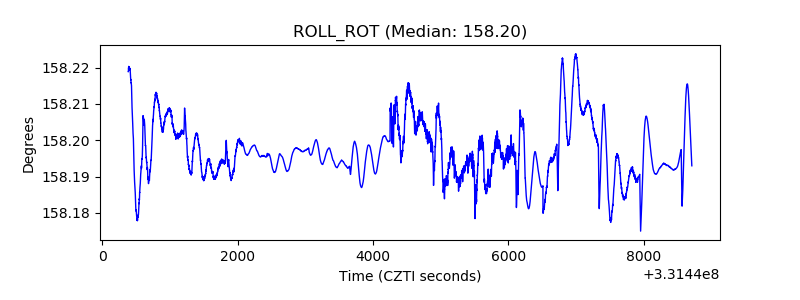 |
| _Roll_DEC | 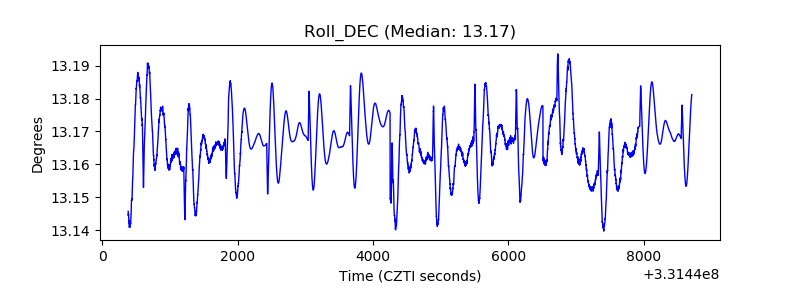 |
| _Roll_RA | 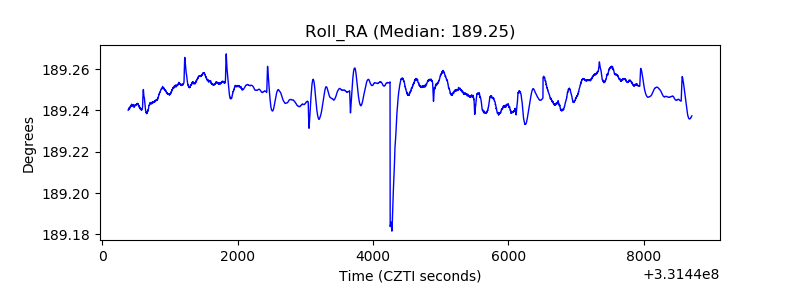 |
| Veto Counter | 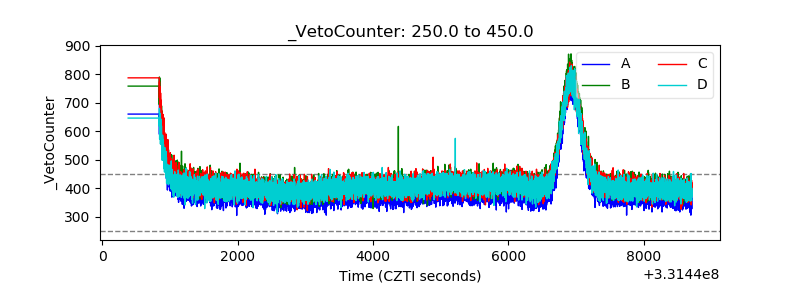 |