| Param | Original file | Final file |
|---|---|---|
| Filename | modeM0/AS1A07_027T11_9000003752_25756cztM0_level2.evt | modeM0/AS1A07_027T11_9000003752_25756cztM0_level2_quad_clean.evt |
| Size (bytes) | 566,928,000 | 81,498,240 |
| Size | 540.7 MB | 77.7 MB |
| Events in quadrant A | 3,895,859 | 489,432 |
| Events in quadrant B | 3,910,056 | 498,932 |
| Events in quadrant C | 4,057,968 | 474,500 |
| Events in quadrant D | 4,774,136 | 460,688 |
| Mode M0 | |||
|---|---|---|---|
| Quadrant | BADHDUFLAG | Total packets | Discarded packets |
| A | 0 | 16475 | 0 |
| B | 0 | 16347 | 0 |
| C | 0 | 16723 | 0 |
| D | 0 | 19002 | 0 |
| Mode M9 | |||
|---|---|---|---|
| Quadrant | BADHDUFLAG | Total packets | Discarded packets |
| A | 0 | 2 | 0 |
| B | 0 | 2 | 0 |
| C | 0 | 2 | 0 |
| D | 0 | 2 | 0 |
| Quadrant | Total seconds | Saturated seconds | Saturation percentage |
|---|---|---|---|
| A | 7821 | 321 | 4.104334% |
| B | 7821 | 355 | 4.539062% |
| C | 7821 | 373 | 4.769211% |
| D | 7821 | 445 | 5.689809% |
Noise dominated data is calculated using 1-second bins in cleaned event files. If a bin has >2000 counts, and if more than 50% of those come from <1% of pixels, then it is considered to be noise-dominated and hence unusable.
| Quadrant | # 1 sec bins | Bins with >0 counts | Bins with >2000 counts | High rate bins dominated by noise | Noise dominated (total time) | Noise dominated (detector-on time) | Marked lightcurve |
|---|---|---|---|---|---|---|---|
| A | 8086 | 7821 | 0 | 0 | 0.00% | 0.00% | 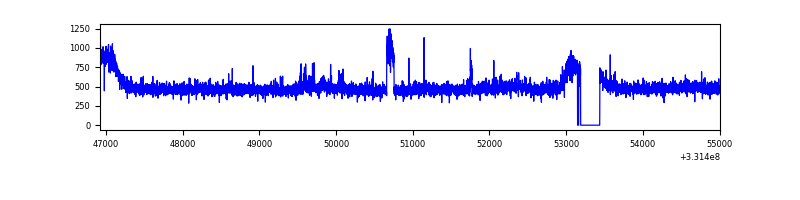 |
| B | 8086 | 7821 | 1 | 1 | 0.01% | 0.01% | 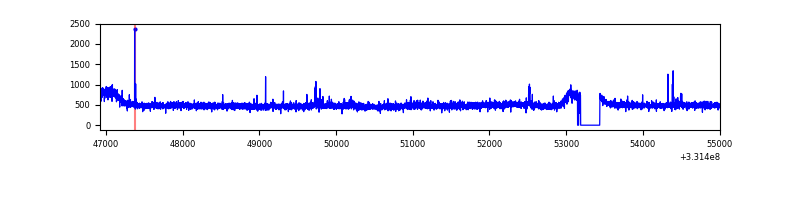 |
| C | 8086 | 7821 | 11 | 11 | 0.14% | 0.14% | 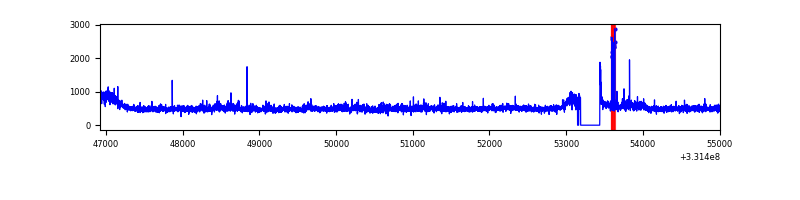 |
| D | 8086 | 7821 | 152 | 152 | 1.88% | 1.94% | 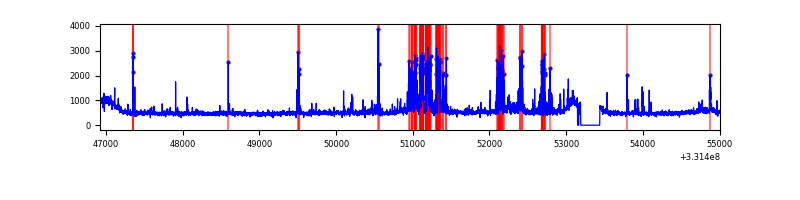 |
Top three noisy pixels from each quadrant. If the there are fewer than three noisy pixels in the level2.evt file, extra rows are filled as -1
| Pixel properties | Quadrant properties | ||||||
|---|---|---|---|---|---|---|---|
| Quadrant | DetID | PixID | Counts | Sigma | Mean | Median | Sigma |
| A | 11 | 29 | 53053 | 259.3 | 984 | 962 | 200.9 |
| A | 6 | 16 | 51725 | 252.69 | 984 | 962 | 200.9 |
| A | 13 | 254 | 10641 | 48.18 | 984 | 962 | 200.9 |
| B | 0 | 219 | 29794 | 150.43 | 976 | 950 | 191.7 |
| B | 12 | 111 | 23734 | 118.83 | 976 | 950 | 191.7 |
| B | 0 | 245 | 23120 | 115.63 | 976 | 950 | 191.7 |
| C | 3 | 233 | 221036 | 988.08 | 943 | 948 | 222.7 |
| C | 14 | 238 | 147505 | 657.97 | 943 | 948 | 222.7 |
| C | 14 | 225 | 10884 | 44.61 | 943 | 948 | 222.7 |
| D | 12 | 1 | 475645 | 2092.43 | 949 | 925 | 226.9 |
| D | 8 | 195 | 320379 | 1408.06 | 949 | 925 | 226.9 |
| D | 13 | 104 | 189308 | 830.34 | 949 | 925 | 226.9 |
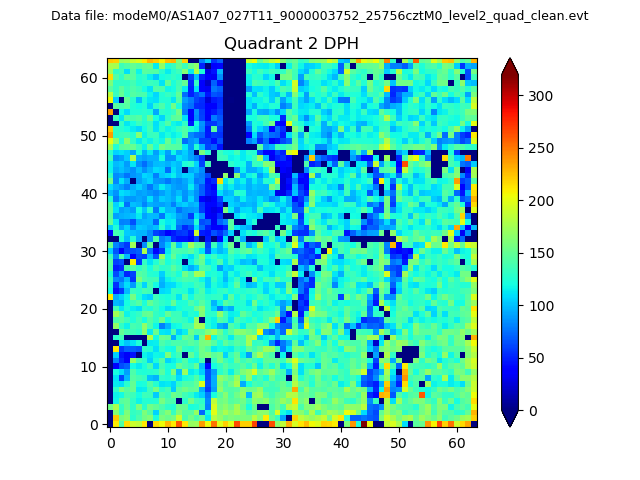
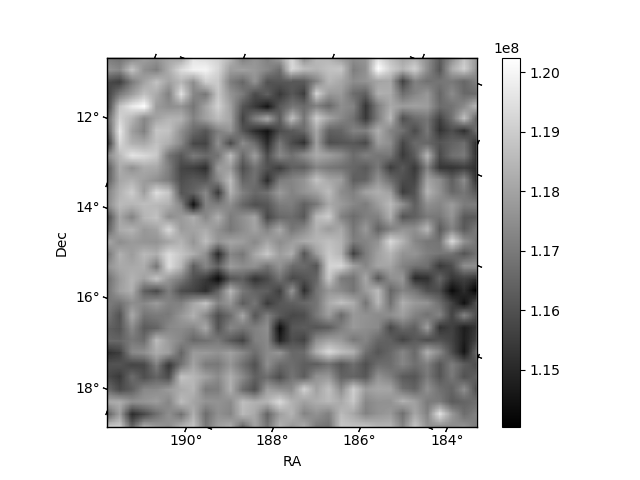
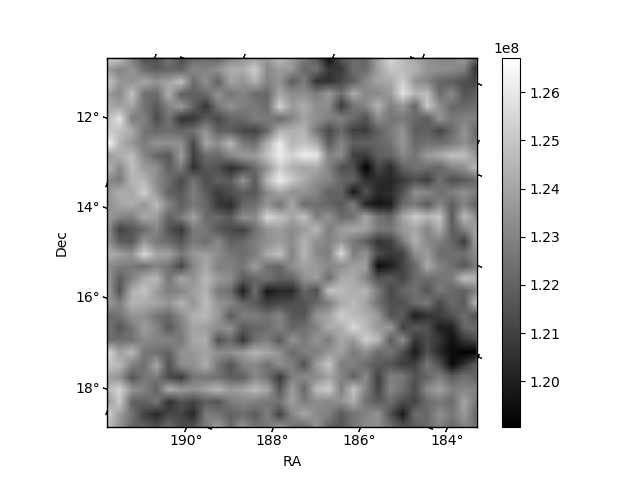
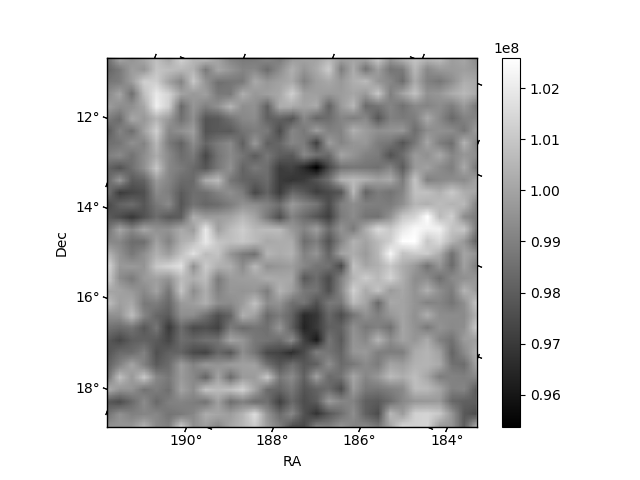
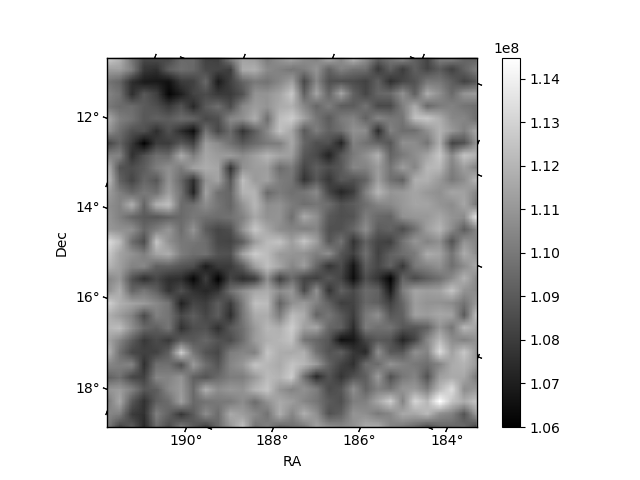
Histogram calculated using DETX and DETY for each event in the final _common_clean file
| Quadrant A |  |
 |
Quadrant B |
|---|---|---|---|
| Quadrant D | 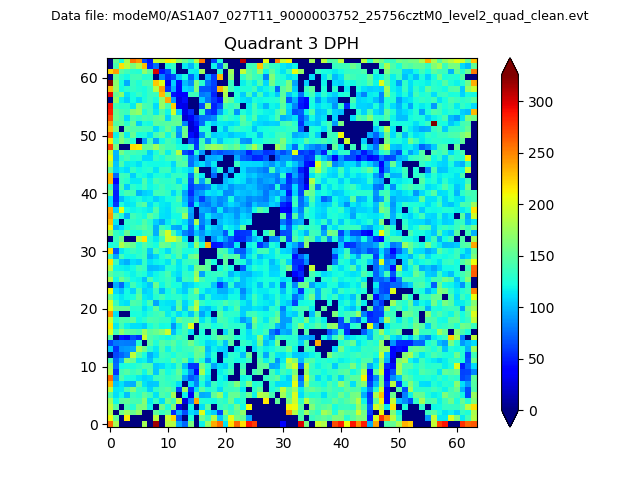 |
 |
Quadrant C |
| Plot type | Count rate plots | Images |
|---|---|---|
| Comparison with Poisson distribution Blue bars denote a histogram of data divided into 1 sec bins. Red curve is a Poisson curve with rate = median count rate of data. |
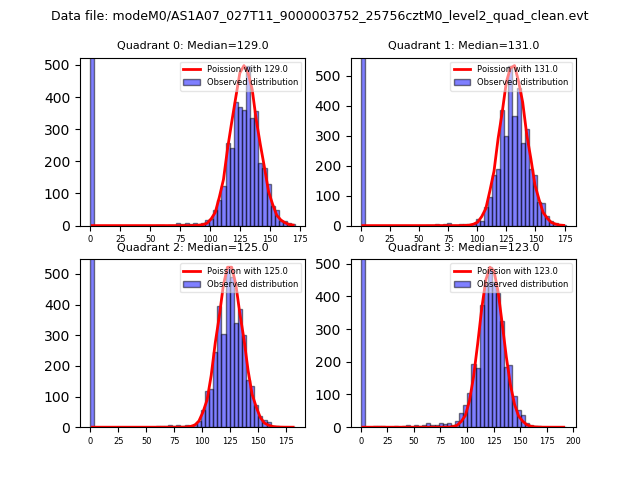 |
 |
| Quadrant-wise count rates Data is divided into 100 sec bins |
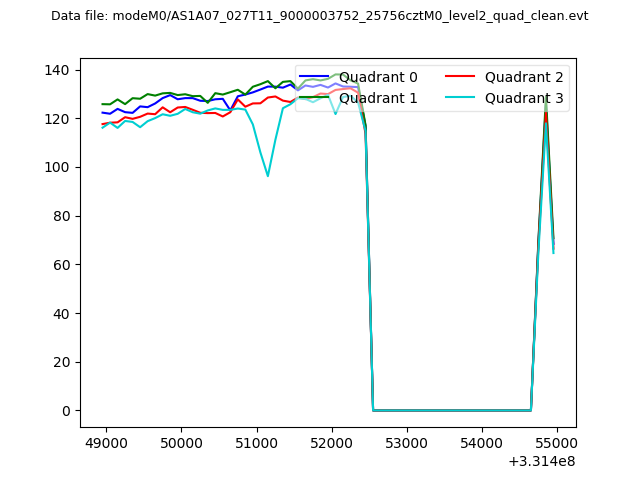 |
|
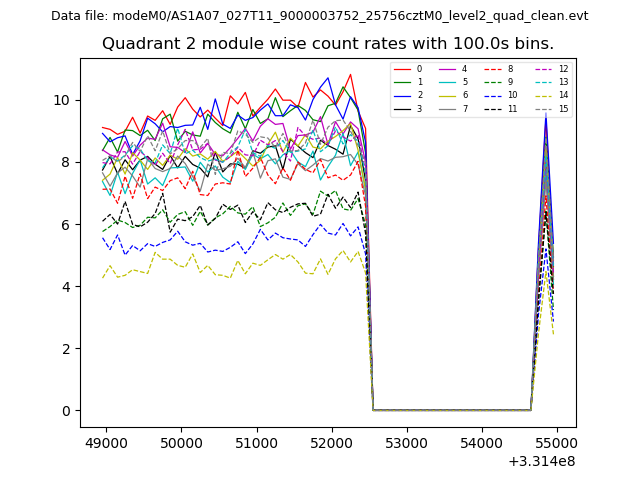
| Module-wise count rates for Quadrant A Data is divided into 100 sec bins |
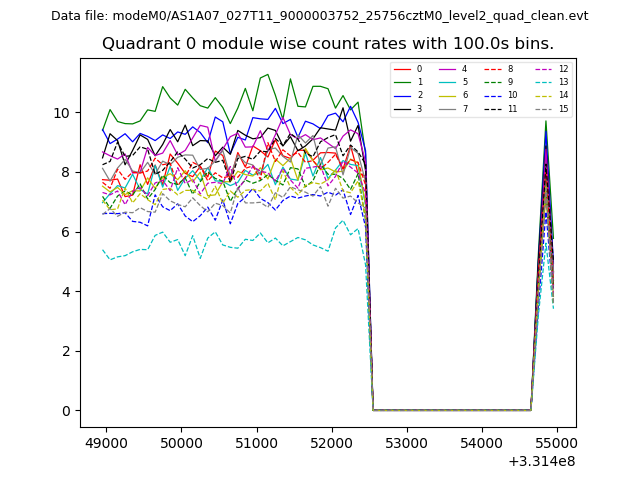 |
 |
| Module-wise count rates for Quadrant B Data is divided into 100 sec bins |
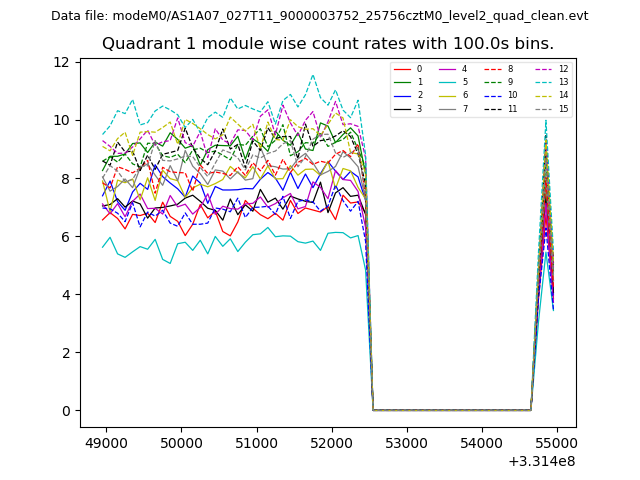 |
 |
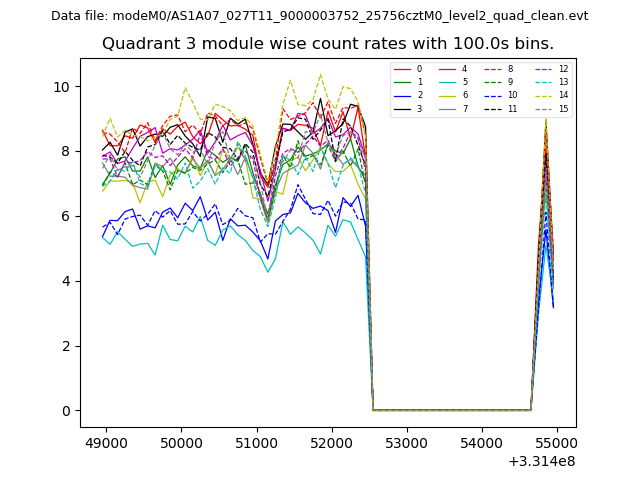
| Module-wise count rates for Quadrant C Data is divided into 100 sec bins |
 |
 |
| Module-wise count rates for Quadrant D Data is divided into 100 sec bins |
 |
 |
| Parameter | Plot |
|---|---|
| CZT HV Monitor | 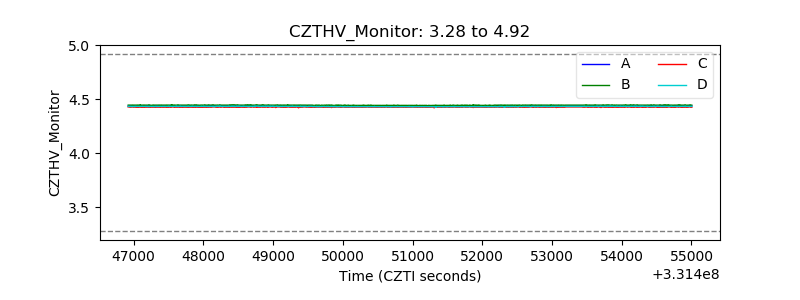 |
| D_VDD | 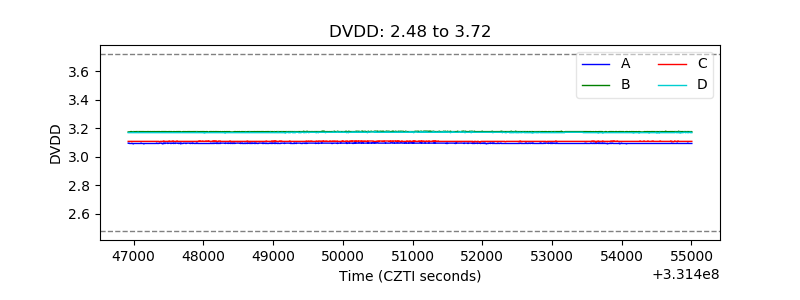 |
| Temperature 1 | 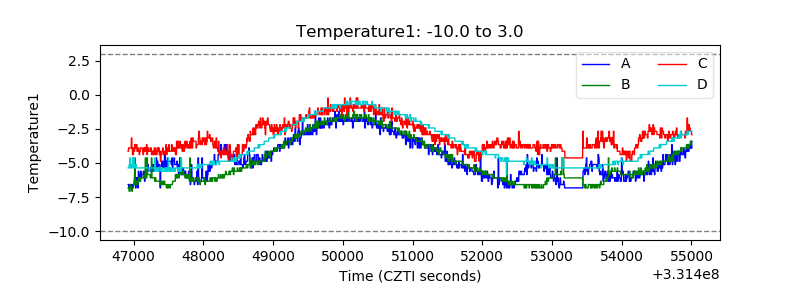 |
| Veto HV Monitor |  |
| Veto LLD | 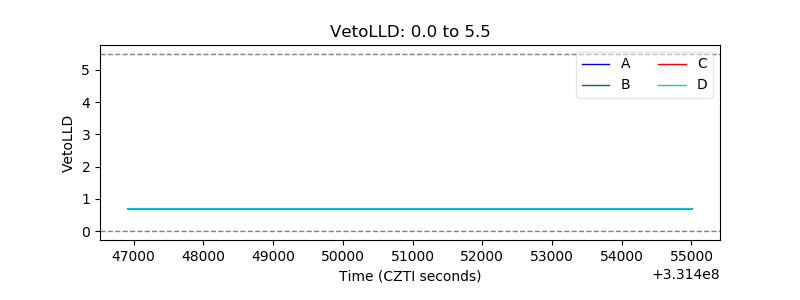 |
| Alpha Counter | 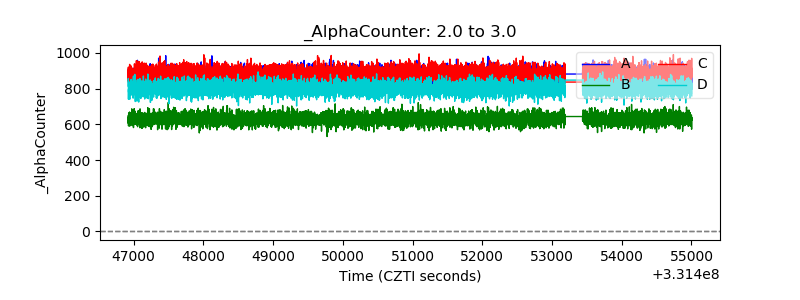 |
| _CPM_Rate | 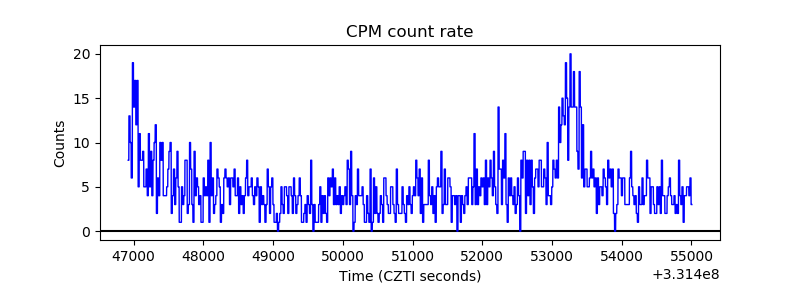 |
| CZT Counter | 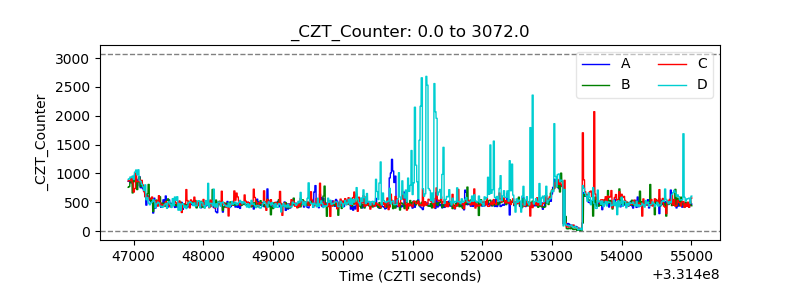 |
| +2.5 Volts monitor |  |
| +5 Volts monitor |  |
| _ROLL_ROT | 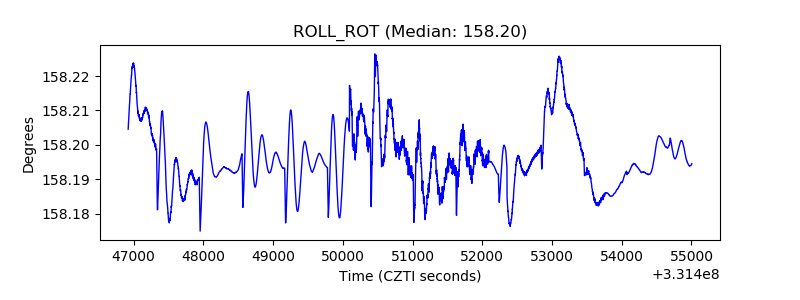 |
| _Roll_DEC | 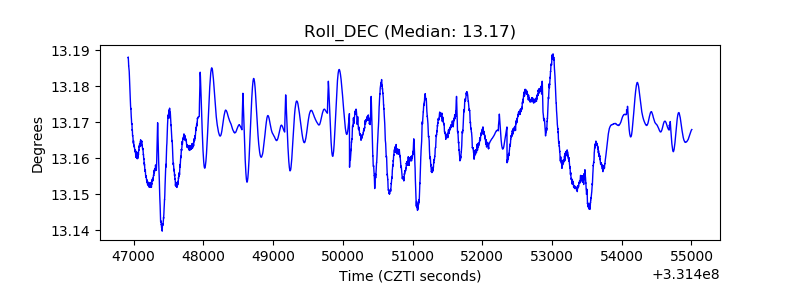 |
| _Roll_RA | 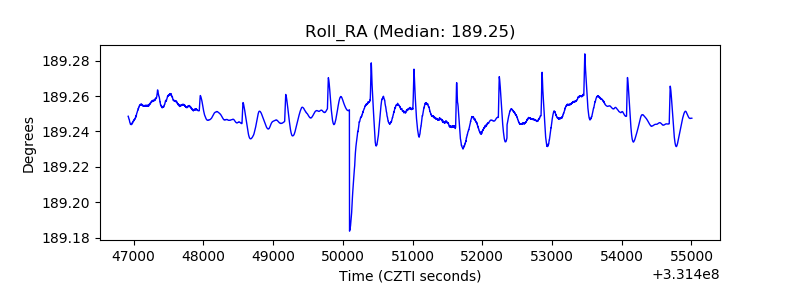 |
| Veto Counter | 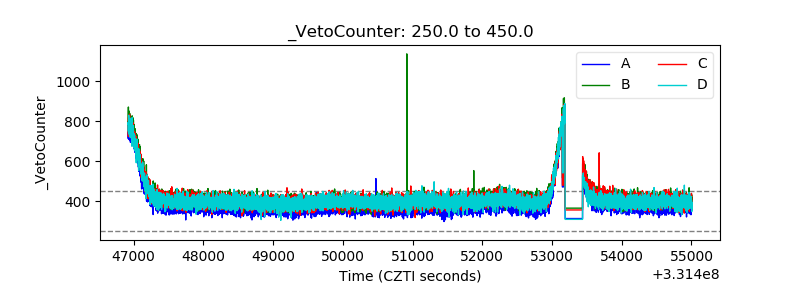 |