| Param | Original file | Final file |
|---|---|---|
| Filename | modeM0/AS1A07_027T11_9000003752_25759cztM0_level2.evt | modeM0/AS1A07_027T11_9000003752_25759cztM0_level2_quad_clean.evt |
| Size (bytes) | 727,914,240 | 135,645,120 |
| Size | 694.2 MB | 129.4 MB |
| Events in quadrant A | 4,754,483 | 870,084 |
| Events in quadrant B | 4,876,045 | 882,527 |
| Events in quadrant C | 4,861,796 | 841,595 |
| Events in quadrant D | 6,869,956 | 815,789 |
| Mode M0 | |||
|---|---|---|---|
| Quadrant | BADHDUFLAG | Total packets | Discarded packets |
| A | 0 | 20557 | 0 |
| B | 0 | 20724 | 0 |
| C | 0 | 20810 | 0 |
| D | 0 | 26607 | 0 |
| Mode M9 | |||
|---|---|---|---|
| Quadrant | BADHDUFLAG | Total packets | Discarded packets |
| A | 0 | 5 | 0 |
| B | 0 | 5 | 0 |
| C | 0 | 5 | 0 |
| D | 0 | 5 | 0 |
| Quadrant | Total seconds | Saturated seconds | Saturation percentage |
|---|---|---|---|
| A | 10080 | 92 | 0.912698% |
| B | 10081 | 111 | 1.101081% |
| C | 10081 | 151 | 1.497867% |
| D | 10081 | 314 | 3.114770% |
Noise dominated data is calculated using 1-second bins in cleaned event files. If a bin has >2000 counts, and if more than 50% of those come from <1% of pixels, then it is considered to be noise-dominated and hence unusable.
| Quadrant | # 1 sec bins | Bins with >0 counts | Bins with >2000 counts | High rate bins dominated by noise | Noise dominated (total time) | Noise dominated (detector-on time) | Marked lightcurve |
|---|---|---|---|---|---|---|---|
| A | 10515 | 10080 | 0 | 0 | 0.00% | 0.00% | 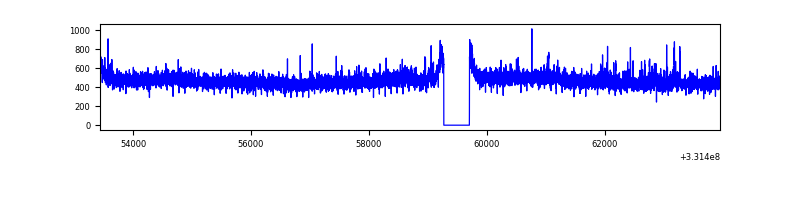 |
| B | 10516 | 10081 | 2 | 2 | 0.02% | 0.02% | 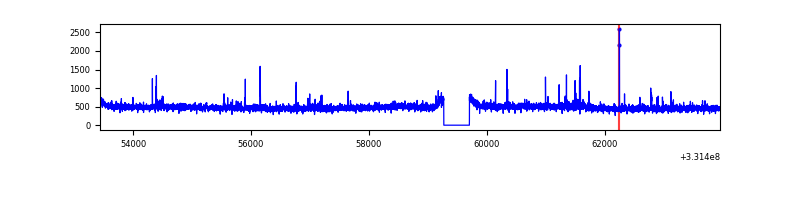 |
| C | 10516 | 10081 | 12 | 12 | 0.11% | 0.12% | 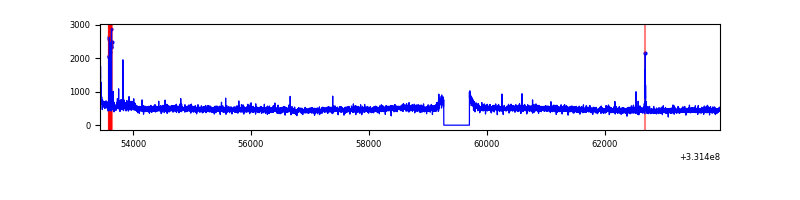 |
| D | 10516 | 10081 | 243 | 243 | 2.31% | 2.41% | 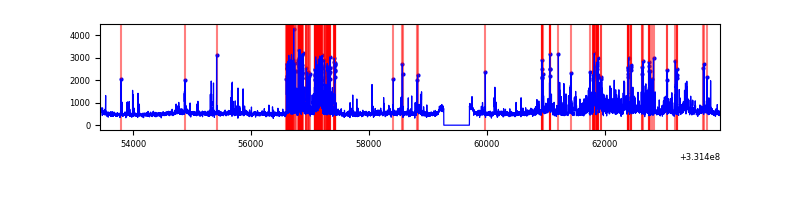 |
Top three noisy pixels from each quadrant. If the there are fewer than three noisy pixels in the level2.evt file, extra rows are filled as -1
| Pixel properties | Quadrant properties | ||||||
|---|---|---|---|---|---|---|---|
| Quadrant | DetID | PixID | Counts | Sigma | Mean | Median | Sigma |
| A | 6 | 16 | 82664 | 333.57 | 1211 | 1183 | 244.3 |
| A | 13 | 254 | 16102 | 61.07 | 1211 | 1183 | 244.3 |
| A | 3 | 137 | 11247 | 41.2 | 1211 | 1183 | 244.3 |
| B | 0 | 219 | 39979 | 167.82 | 1204 | 1174 | 231.2 |
| B | 0 | 190 | 38928 | 163.28 | 1204 | 1174 | 231.2 |
| B | 12 | 111 | 28190 | 116.84 | 1204 | 1174 | 231.2 |
| C | 14 | 238 | 184857 | 673.38 | 1160 | 1167 | 272.8 |
| C | 3 | 233 | 153738 | 559.31 | 1160 | 1167 | 272.8 |
| C | 13 | 61 | 8084 | 25.36 | 1160 | 1167 | 272.8 |
| D | 1 | 52 | 721969 | 2581.15 | 1164 | 1137 | 279.3 |
| D | 8 | 195 | 581930 | 2079.7 | 1164 | 1137 | 279.3 |
| D | 7 | 80 | 562723 | 2010.92 | 1164 | 1137 | 279.3 |
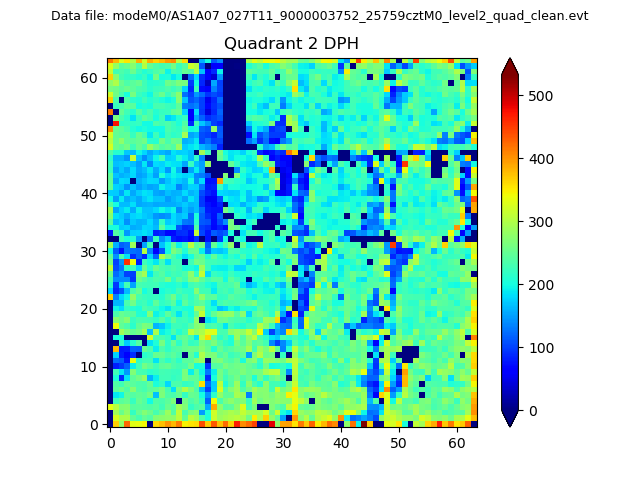
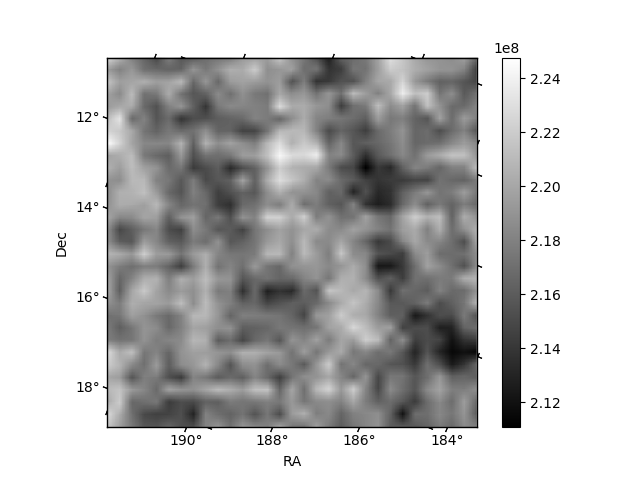
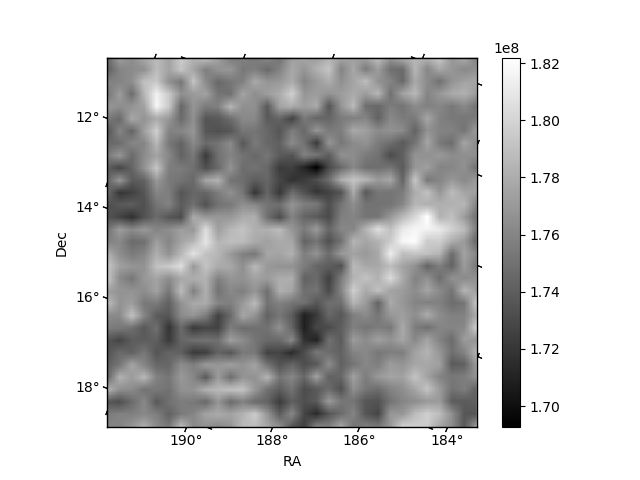
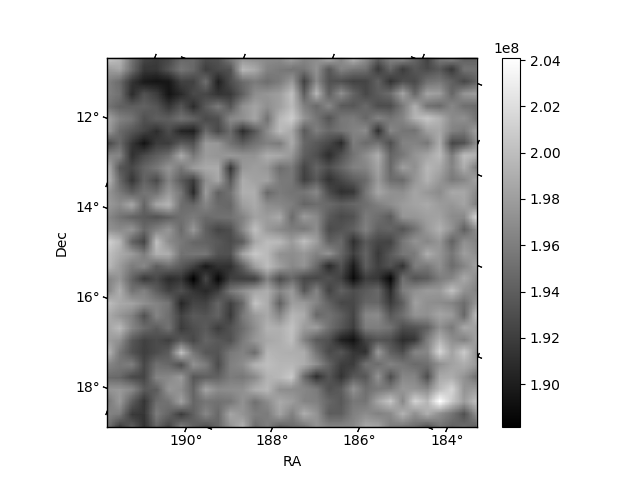
Histogram calculated using DETX and DETY for each event in the final _common_clean file
| Quadrant A | 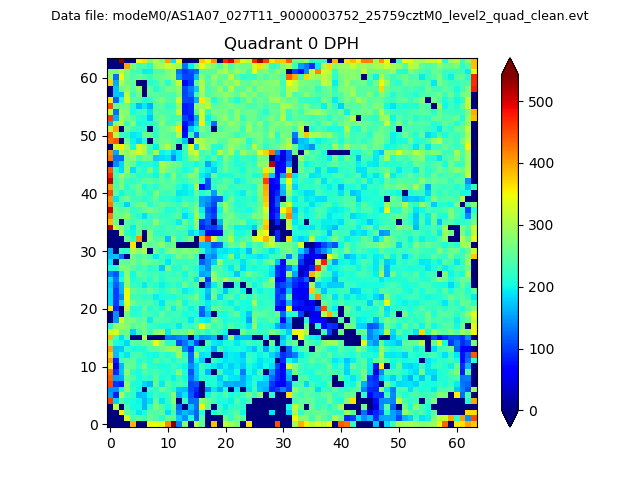 |
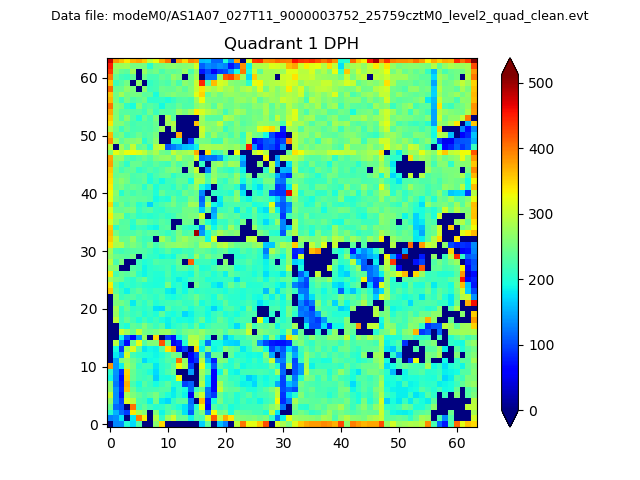 |
Quadrant B |
|---|---|---|---|
| Quadrant D | 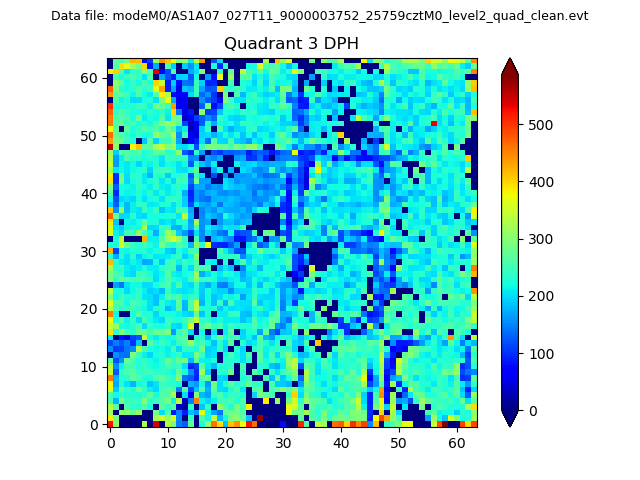 |
 |
Quadrant C |
| Plot type | Count rate plots | Images |
|---|---|---|
| Comparison with Poisson distribution Blue bars denote a histogram of data divided into 1 sec bins. Red curve is a Poisson curve with rate = median count rate of data. |
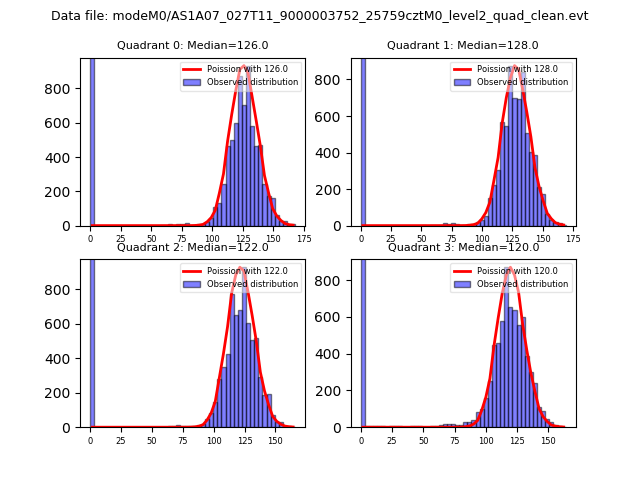 |
 |
| Quadrant-wise count rates Data is divided into 100 sec bins |
 |
|
| Module-wise count rates for Quadrant A Data is divided into 100 sec bins |
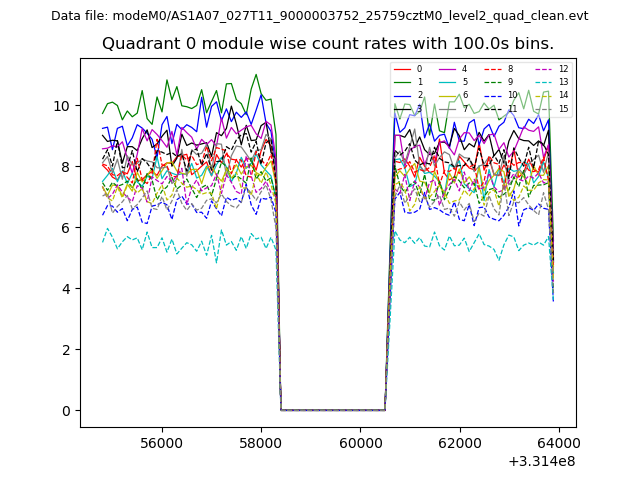 |
 |
| Module-wise count rates for Quadrant B Data is divided into 100 sec bins |
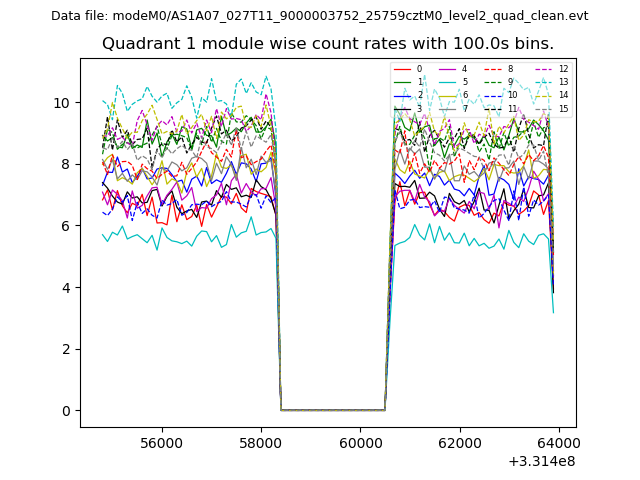 |
 |
| Module-wise count rates for Quadrant C Data is divided into 100 sec bins |
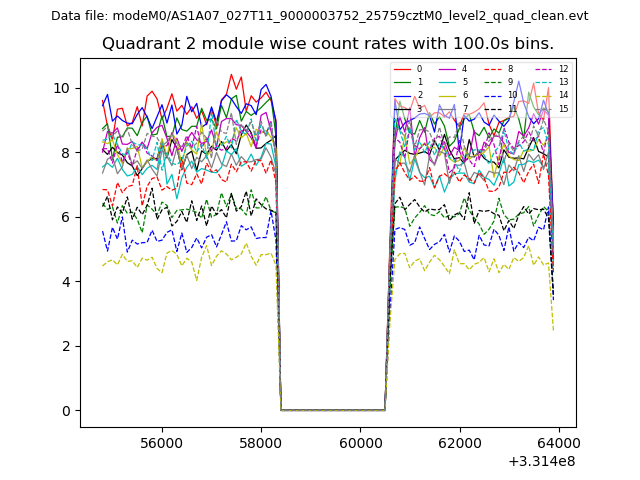 |
 |
| Module-wise count rates for Quadrant D Data is divided into 100 sec bins |
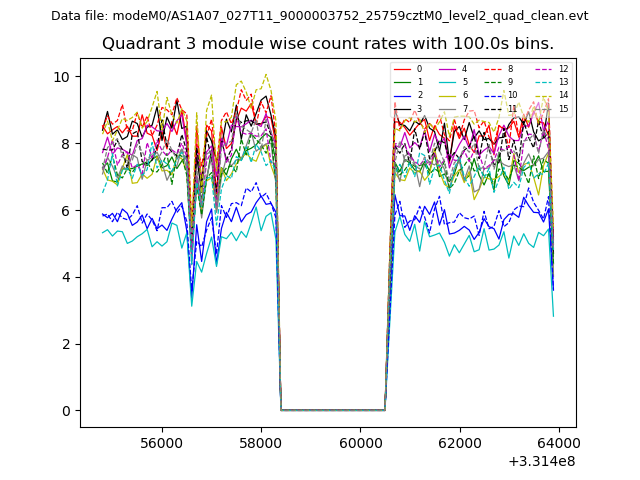 |
 |
| Parameter | Plot |
|---|---|
| CZT HV Monitor | 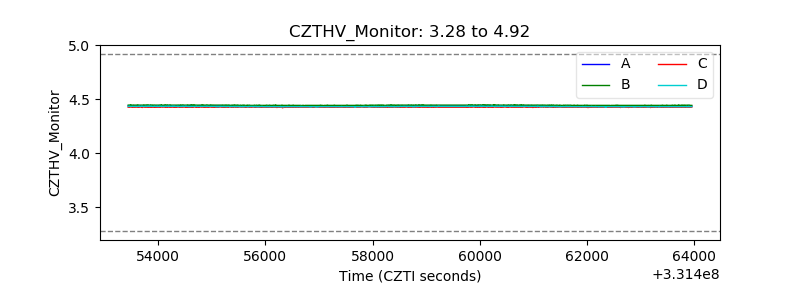 |
| D_VDD | 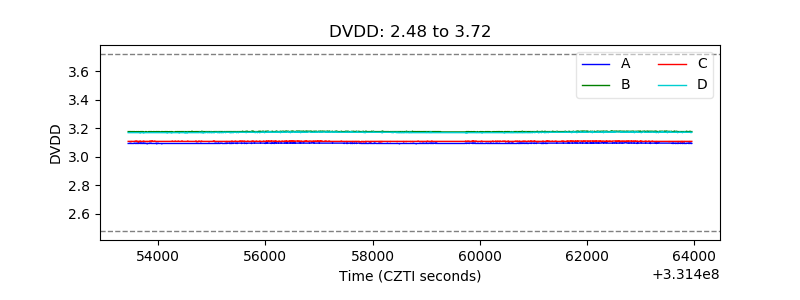 |
| Temperature 1 | 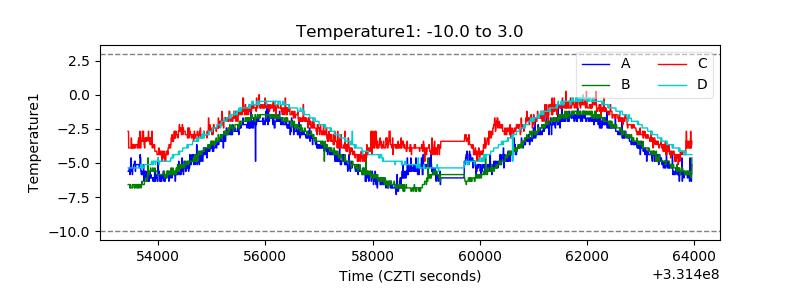 |
| Veto HV Monitor |  |
| Veto LLD | 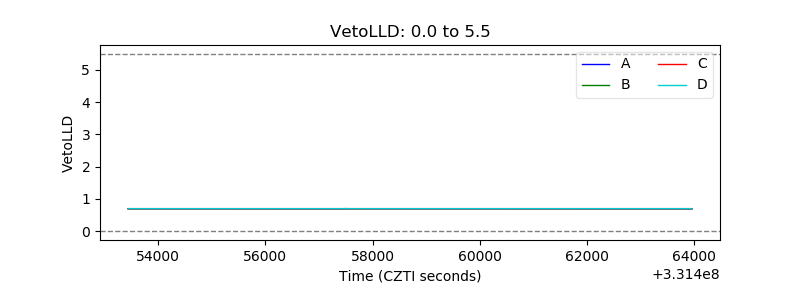 |
| Alpha Counter | 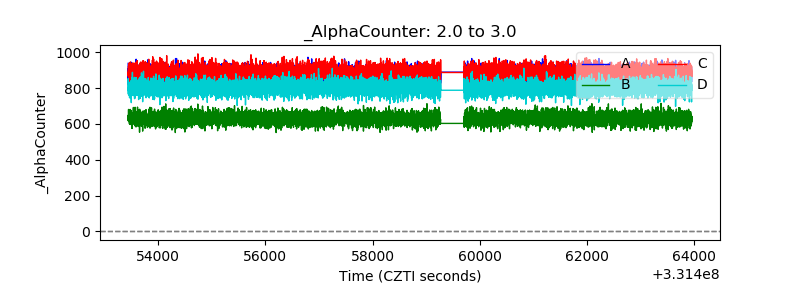 |
| _CPM_Rate | 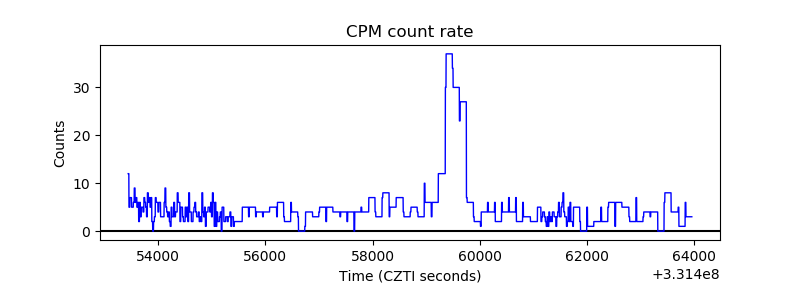 |
| CZT Counter |  |
| +2.5 Volts monitor |  |
| +5 Volts monitor |  |
| _ROLL_ROT | 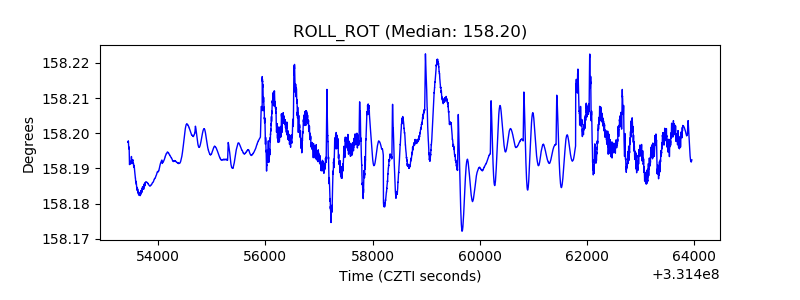 |
| _Roll_DEC | 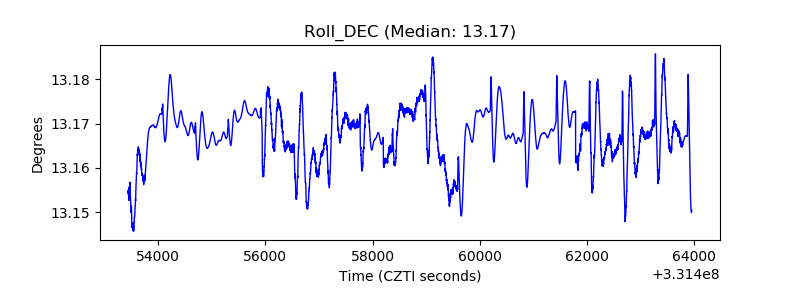 |
| _Roll_RA |  |
| Veto Counter | 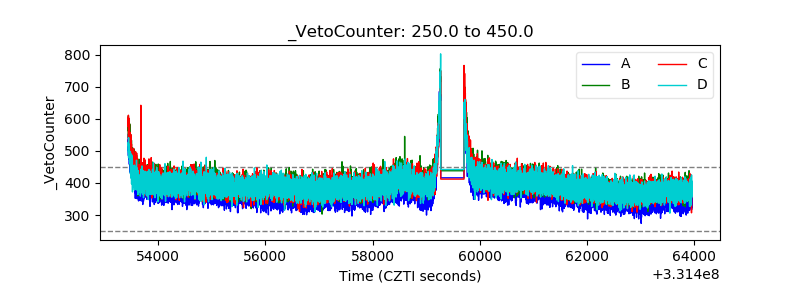 |