| Param | Original file | Final file |
|---|---|---|
| Filename | modeM0/AS1A09_147T01_9000003754cztM0_level2.fits | modeM0/AS1A09_147T01_9000003754cztM0_level2_quad_clean.evt |
| Size (bytes) | 1,558,022,400 | 1,391,342,400 |
| Size | 1.5 GB | 1.3 GB |
| Events in quadrant A | 9,725,230 | 8,286,224 |
| Events in quadrant B | 9,400,002 | 8,402,407 |
| Events in quadrant C | 9,477,488 | 7,909,335 |
| Events in quadrant D | 7,926,148 | 6,886,774 |
| Mode M9 | |||
|---|---|---|---|
| Quadrant | BADHDUFLAG | Total packets | Discarded packets |
| A | 0 | 248 | 0 |
| B | 0 | 248 | 0 |
| C | 0 | 248 | 0 |
| D | 0 | 248 | 0 |
| Mode SS | |||
|---|---|---|---|
| Quadrant | BADHDUFLAG | Total packets | Discarded packets |
| A | 0 | 3166 | 0 |
| B | 0 | 3166 | 0 |
| C | 0 | 3166 | 0 |
| D | 0 | 3166 | 0 |
| Mode M0 | |||
|---|---|---|---|
| Quadrant | BADHDUFLAG | Total packets | Discarded packets |
| A | 0 | 339967 | 0 |
| B | 0 | 328009 | 0 |
| C | 0 | 325974 | 0 |
| D | 0 | 487820 | 0 |
| Quadrant | Total seconds | Saturated seconds | Saturation percentage |
|---|---|---|---|
| A | 155448 | 2697 | 1.734985% |
| B | 155448 | 2300 | 1.479594% |
| C | 155448 | 2745 | 1.765864% |
| D | 155448 | 14457 | 9.300216% |
Noise dominated data is calculated using 1-second bins in cleaned event files. If a bin has >2000 counts, and if more than 50% of those come from <1% of pixels, then it is considered to be noise-dominated and hence unusable.
| Quadrant | # 1 sec bins | Bins with >0 counts | Bins with >2000 counts | High rate bins dominated by noise | Noise dominated (total time) | Noise dominated (detector-on time) | Marked lightcurve |
|---|---|---|---|---|---|---|---|
| A | 179812 | 155422 | 0 | 0 | 0.00% | 0.00% | 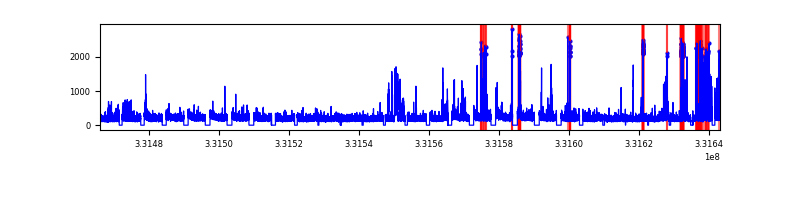 |
| B | 179812 | 155424 | 0 | 0 | 0.00% | 0.00% |  |
| C | 179812 | 155419 | 0 | 0 | 0.00% | 0.00% | 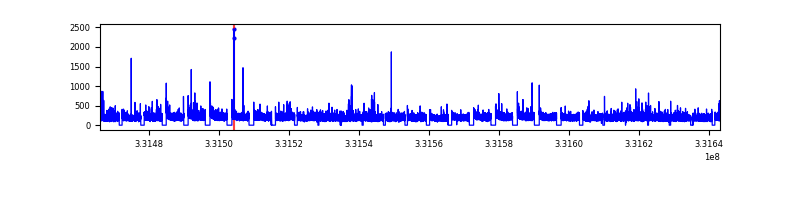 |
| D | 179812 | 154948 | 0 | 0 | 0.00% | 0.00% |  |
Top three noisy pixels from each quadrant. If the there are fewer than three noisy pixels in the level2.evt file, extra rows are filled as -1
| Pixel properties | Quadrant properties | ||||||
|---|---|---|---|---|---|---|---|
| Quadrant | DetID | PixID | Counts | Sigma | Mean | Median | Sigma |
| A | 0 | 29 | 8140 | 9.41 | 2536 | 2394 | 610.5 |
| A | 7 | 110 | 7812 | 8.88 | 2536 | 2394 | 610.5 |
| A | 9 | 19 | 7129 | 7.76 | 2536 | 2394 | 610.5 |
| B | 2 | 9 | 7486 | 10.73 | 2487 | 2384 | 475.3 |
| B | 2 | 8 | 6352 | 8.35 | 2487 | 2384 | 475.3 |
| B | 3 | 17 | 6148 | 7.92 | 2487 | 2384 | 475.3 |
| C | 12 | 241 | 6566 | 6.66 | 2507 | 2352 | 632.7 |
| C | 3 | 126 | 6421 | 6.43 | 2507 | 2352 | 632.7 |
| C | 9 | 209 | 6304 | 6.25 | 2507 | 2352 | 632.7 |
| D | 3 | 14 | 5779 | 6.21 | 2264 | 2062 | 598.5 |
| D | 10 | 189 | 5602 | 5.91 | 2264 | 2062 | 598.5 |
| D | 6 | 231 | 5532 | 5.8 | 2264 | 2062 | 598.5 |
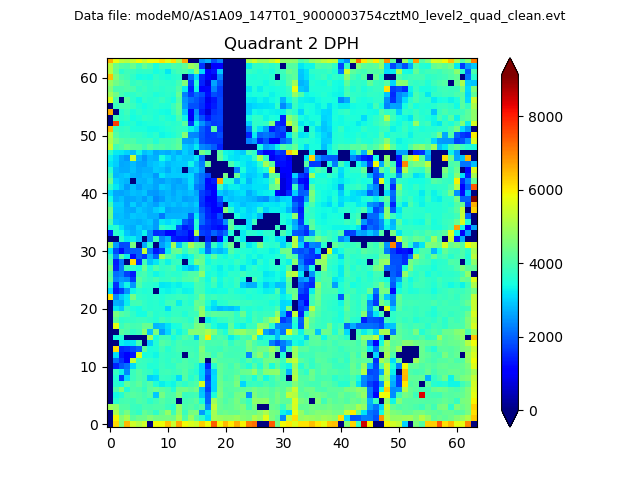
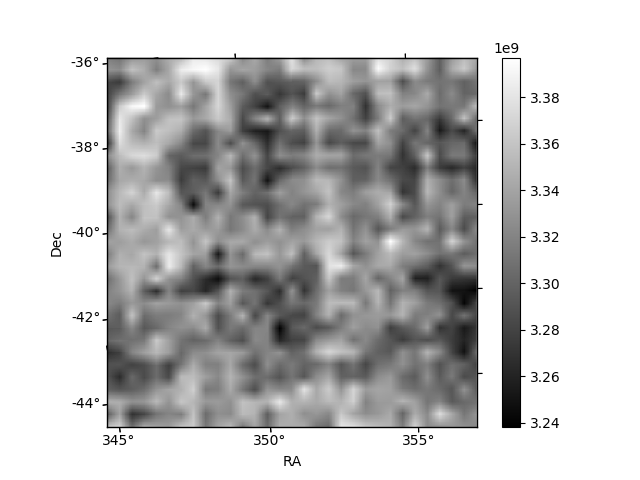
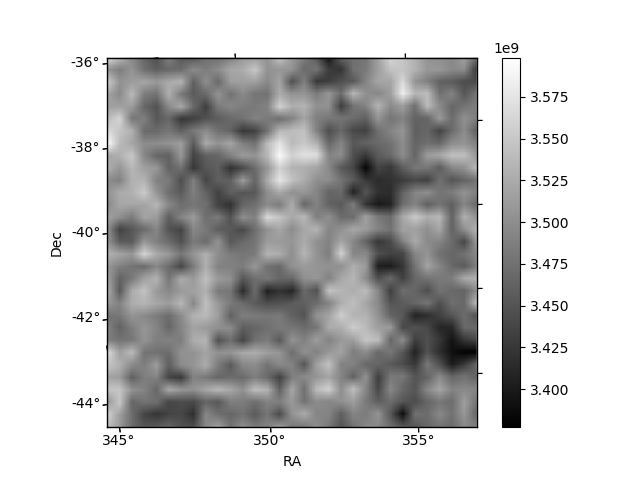
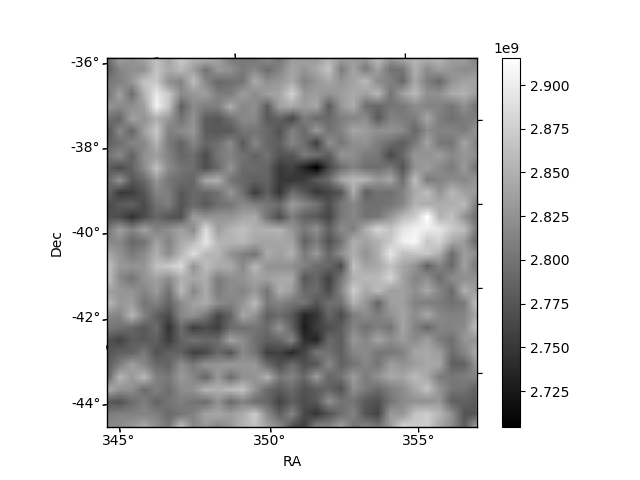
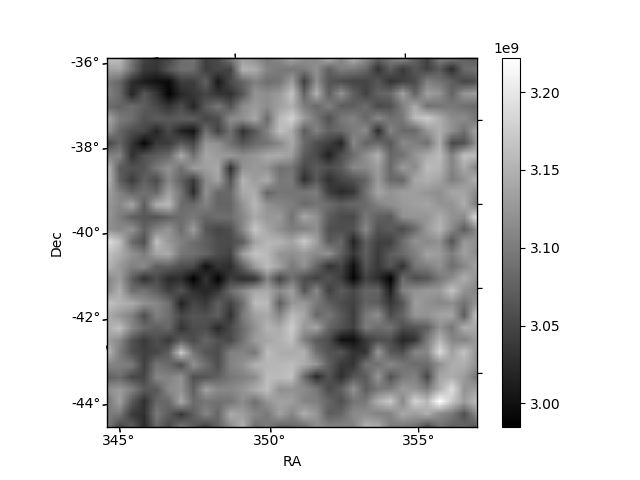
Histogram calculated using DETX and DETY for each event in the final _common_clean file
| Quadrant A | 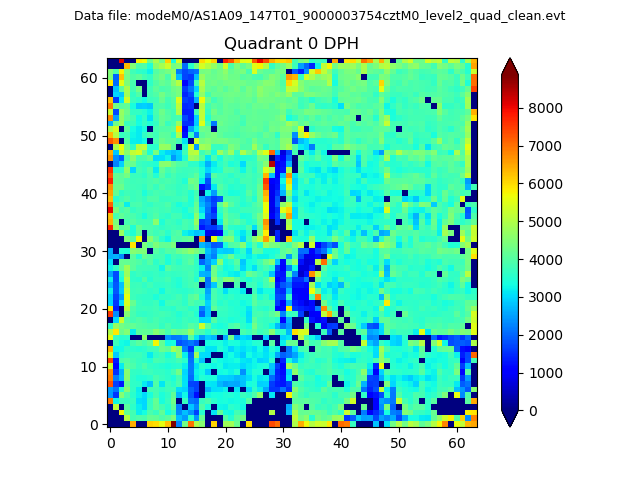 |
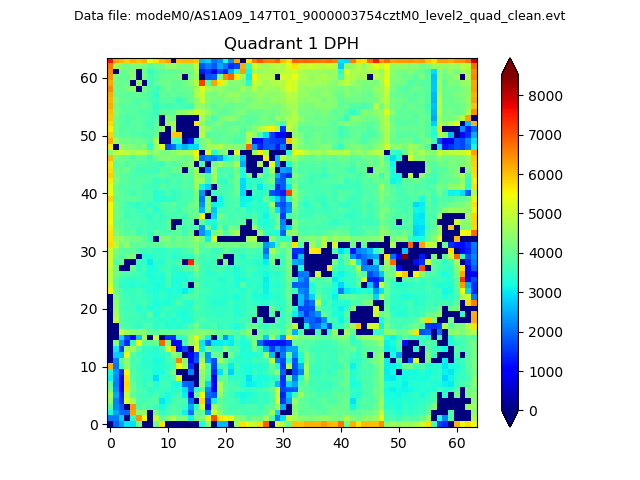 |
Quadrant B |
|---|---|---|---|
| Quadrant D | 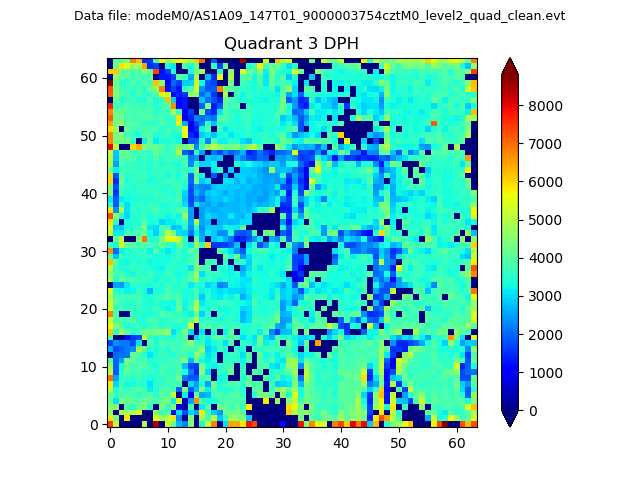 |
 |
Quadrant C |
| Plot type | Count rate plots | Images |
|---|---|---|
| Comparison with Poisson distribution Blue bars denote a histogram of data divided into 1 sec bins. Red curve is a Poisson curve with rate = median count rate of data. |
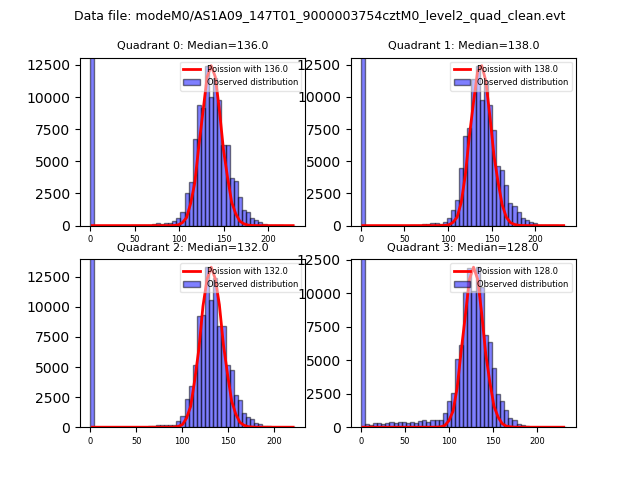 |
 |
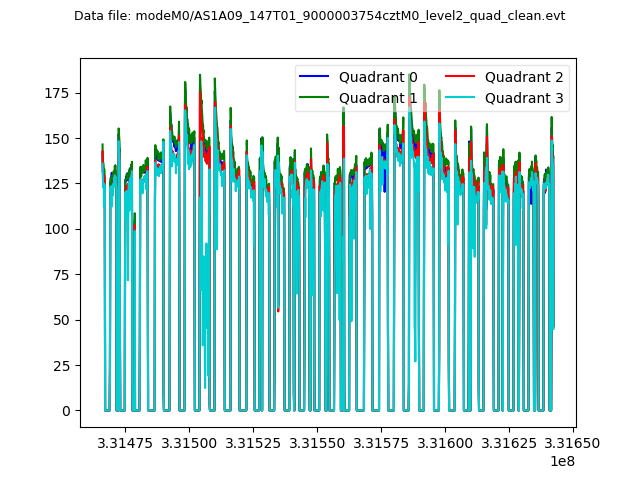
| Quadrant-wise count rates Data is divided into 100 sec bins |
 |
|
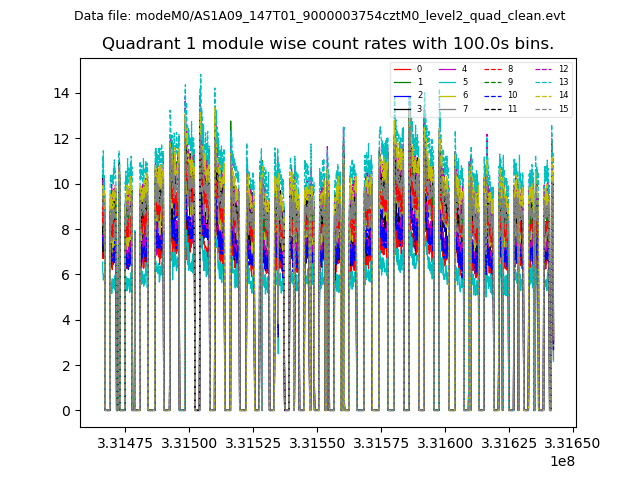
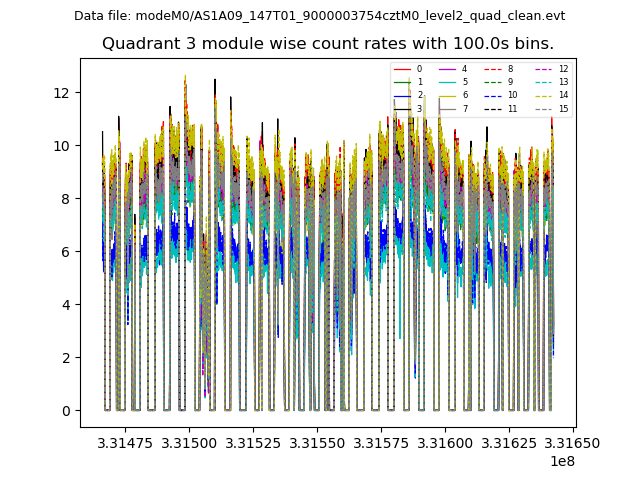
| Module-wise count rates for Quadrant A Data is divided into 100 sec bins |
 |
 |
| Module-wise count rates for Quadrant B Data is divided into 100 sec bins |
 |
 |
| Module-wise count rates for Quadrant C Data is divided into 100 sec bins |
 |
 |
| Module-wise count rates for Quadrant D Data is divided into 100 sec bins |
 |
 |
| Parameter | Plot |
|---|---|
| CZT HV Monitor | 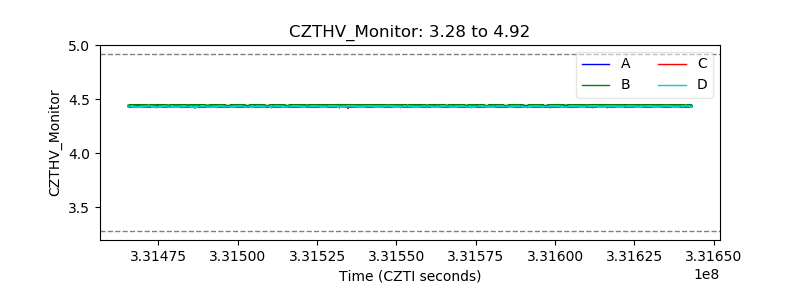 |
| D_VDD | 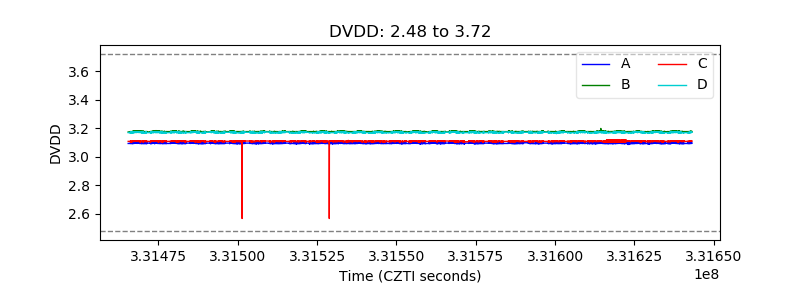 |
| Temperature 1 | 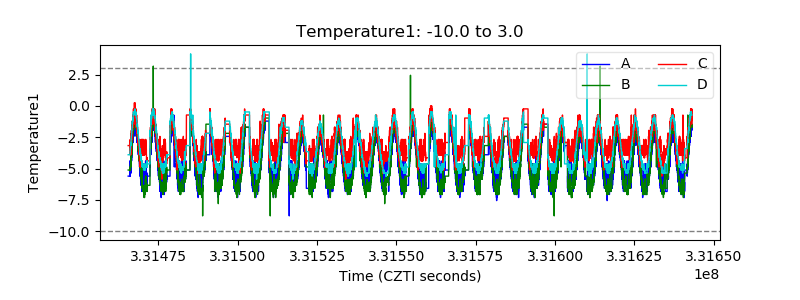 |
| Veto HV Monitor | 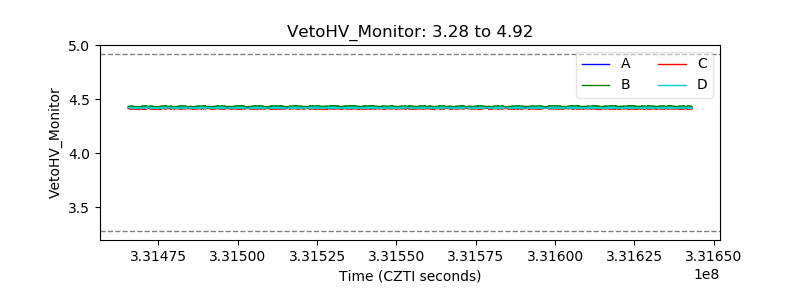 |
| Veto LLD | 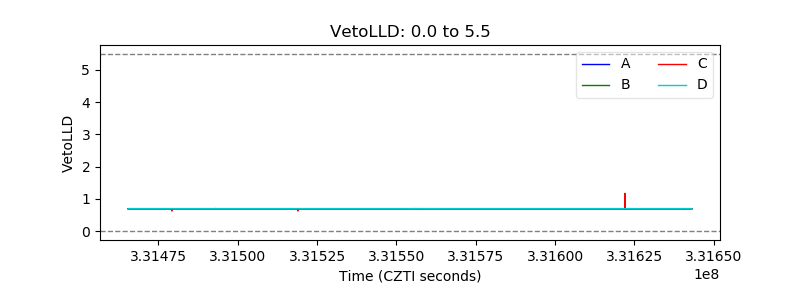 |
| Alpha Counter | 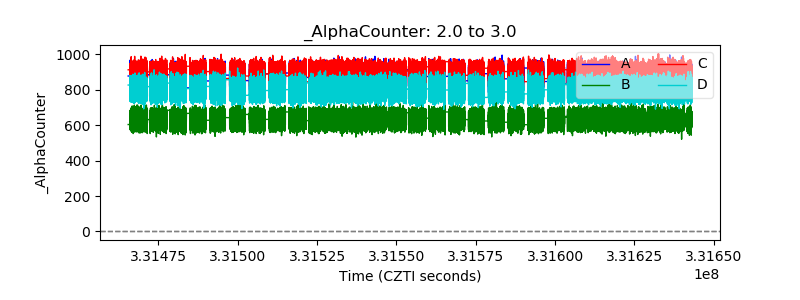 |
| _CPM_Rate | 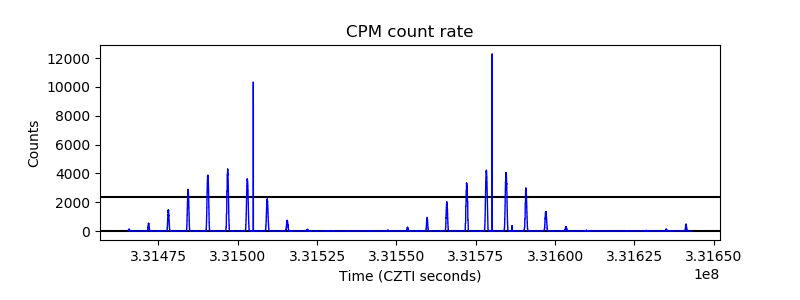 |
| CZT Counter |  |
| +2.5 Volts monitor | 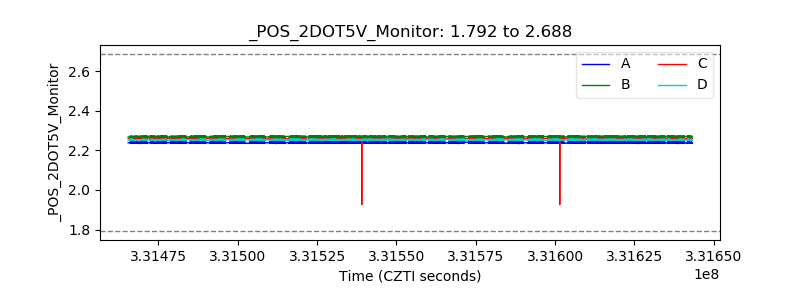 |
| +5 Volts monitor | 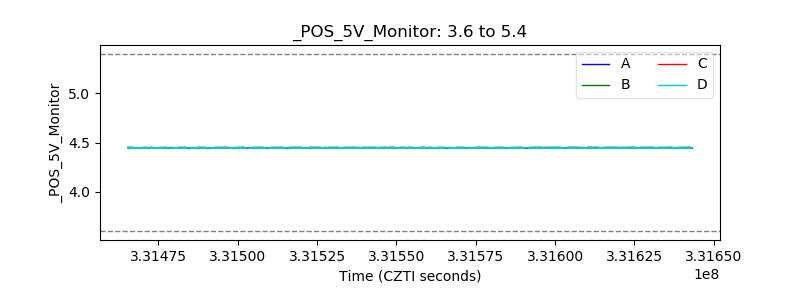 |
| _ROLL_ROT | 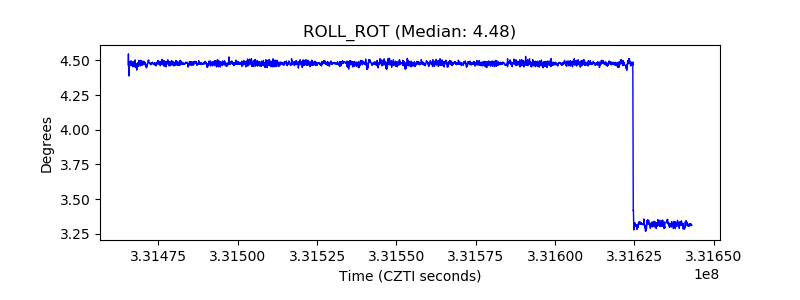 |
| _Roll_DEC |  |
| _Roll_RA | 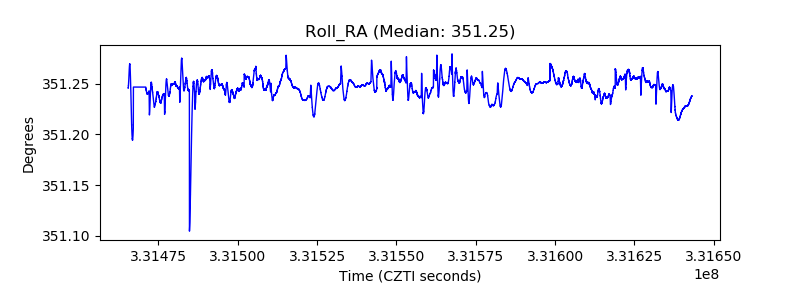 |
| Veto Counter | 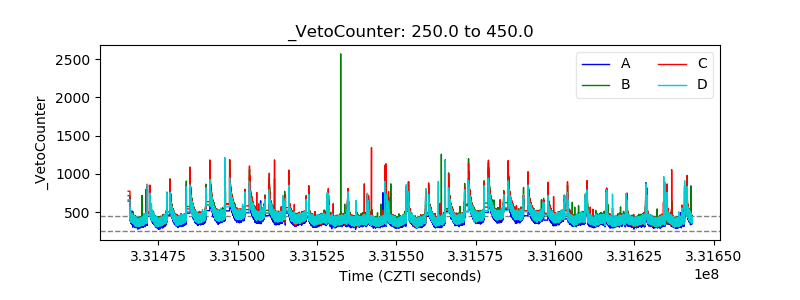 |