| Param | Original file | Final file |
|---|---|---|
| Filename | modeM0/AS1A09_147T01_9000003754_25759cztM0_level2.evt | modeM0/AS1A09_147T01_9000003754_25759cztM0_level2_quad_clean.evt |
| Size (bytes) | 540,581,760 | 85,308,480 |
| Size | 515.5 MB | 81.4 MB |
| Events in quadrant A | 3,437,747 | 529,939 |
| Events in quadrant B | 3,570,483 | 539,070 |
| Events in quadrant C | 3,469,150 | 516,554 |
| Events in quadrant D | 5,417,952 | 508,786 |
| Mode M9 | |||
|---|---|---|---|
| Quadrant | BADHDUFLAG | Total packets | Discarded packets |
| A | 0 | 14 | 0 |
| B | 0 | 14 | 0 |
| C | 0 | 14 | 0 |
| D | 0 | 14 | 0 |
| Mode M0 | |||
|---|---|---|---|
| Quadrant | BADHDUFLAG | Total packets | Discarded packets |
| A | 0 | 14672 | 0 |
| B | 0 | 14898 | 0 |
| C | 0 | 14551 | 0 |
| D | 0 | 20595 | 0 |
| Quadrant | Total seconds | Saturated seconds | Saturation percentage |
|---|---|---|---|
| A | 7022 | 49 | 0.697807% |
| B | 7022 | 107 | 1.523782% |
| C | 7022 | 90 | 1.281686% |
| D | 7021 | 541 | 7.705455% |
Noise dominated data is calculated using 1-second bins in cleaned event files. If a bin has >2000 counts, and if more than 50% of those come from <1% of pixels, then it is considered to be noise-dominated and hence unusable.
| Quadrant | # 1 sec bins | Bins with >0 counts | Bins with >2000 counts | High rate bins dominated by noise | Noise dominated (total time) | Noise dominated (detector-on time) | Marked lightcurve |
|---|---|---|---|---|---|---|---|
| A | 7832 | 7022 | 0 | 0 | 0.00% | 0.00% | 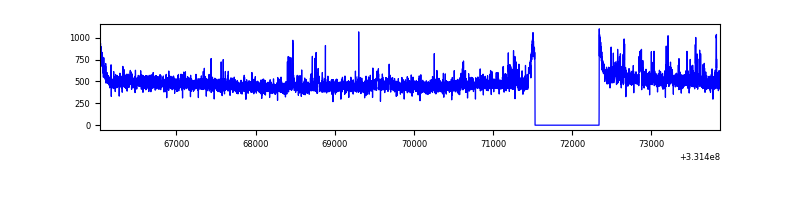 |
| B | 7832 | 7022 | 36 | 36 | 0.46% | 0.51% | 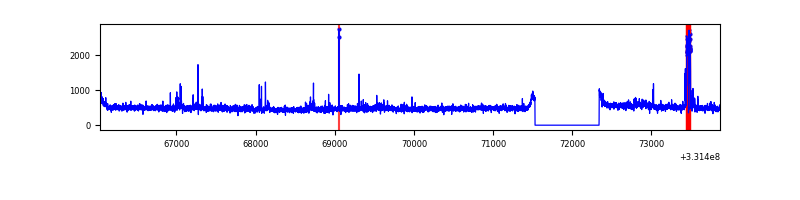 |
| C | 7832 | 7022 | 0 | 0 | 0.00% | 0.00% | 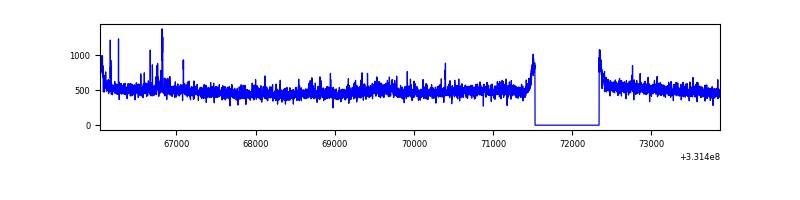 |
| D | 7830 | 7020 | 481 | 481 | 6.14% | 6.85% | 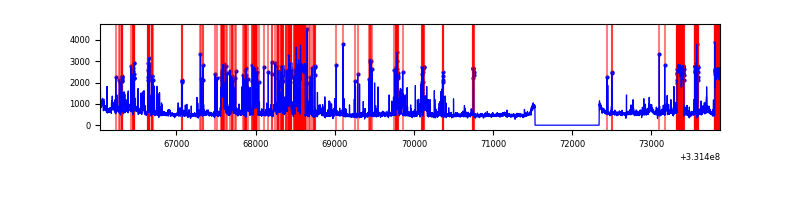 |
Top three noisy pixels from each quadrant. If the there are fewer than three noisy pixels in the level2.evt file, extra rows are filled as -1
| Pixel properties | Quadrant properties | ||||||
|---|---|---|---|---|---|---|---|
| Quadrant | DetID | PixID | Counts | Sigma | Mean | Median | Sigma |
| A | 6 | 16 | 108788 | 626.95 | 863 | 845 | 172.2 |
| A | 13 | 254 | 11237 | 60.36 | 863 | 845 | 172.2 |
| A | 3 | 137 | 7979 | 41.44 | 863 | 845 | 172.2 |
| B | 7 | 219 | 59179 | 356.87 | 854 | 830 | 163.5 |
| B | 7 | 235 | 36914 | 220.7 | 854 | 830 | 163.5 |
| B | 0 | 190 | 30308 | 180.29 | 854 | 830 | 163.5 |
| C | 14 | 238 | 132376 | 679.13 | 829 | 836 | 193.7 |
| C | 3 | 233 | 98928 | 506.44 | 829 | 836 | 193.7 |
| C | 14 | 225 | 6956 | 31.6 | 829 | 836 | 193.7 |
| D | 1 | 52 | 1158551 | 6019.94 | 805 | 787 | 192.3 |
| D | 7 | 80 | 776781 | 4034.88 | 805 | 787 | 192.3 |
| D | 8 | 195 | 183453 | 949.79 | 805 | 787 | 192.3 |
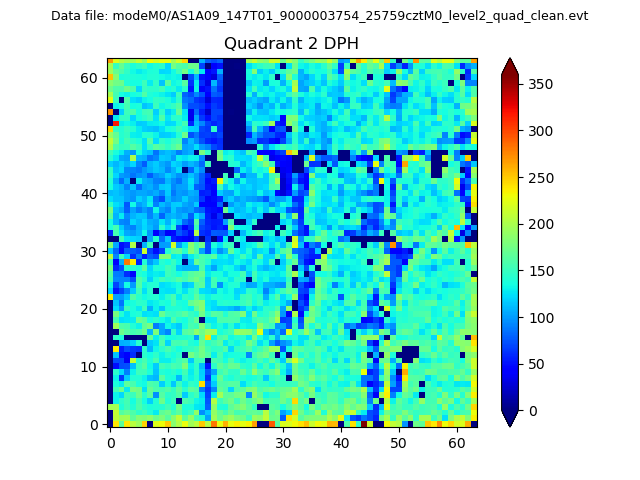
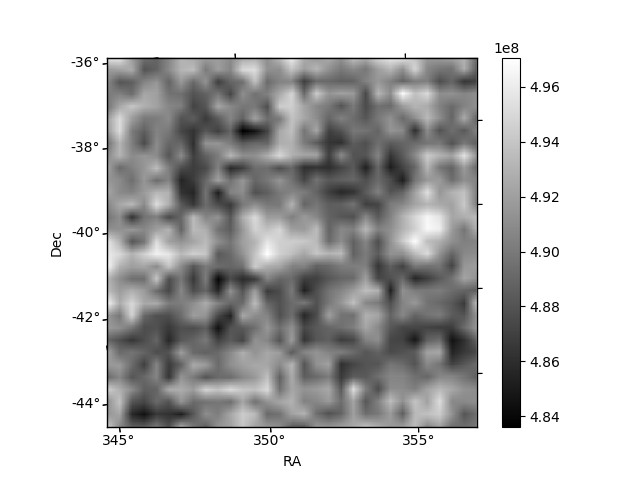
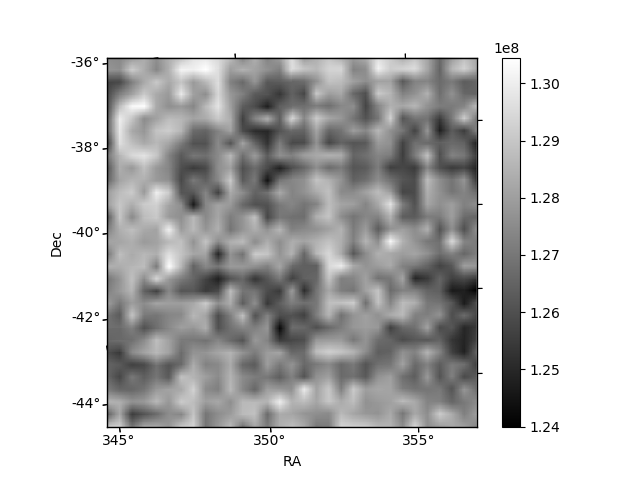
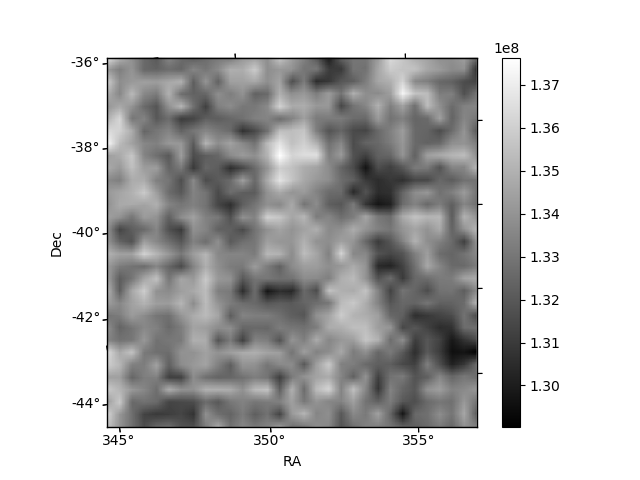
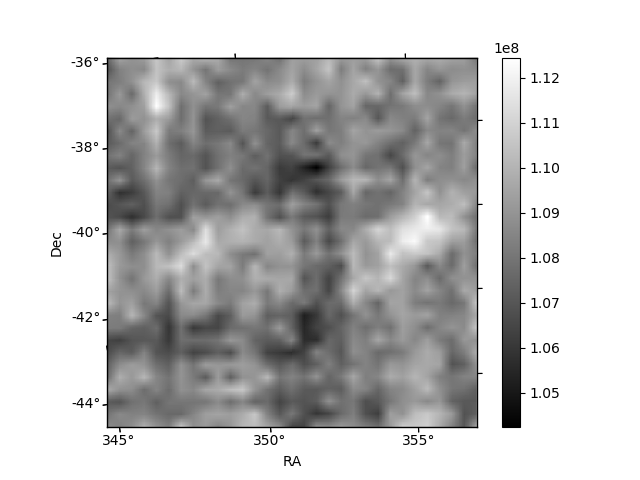
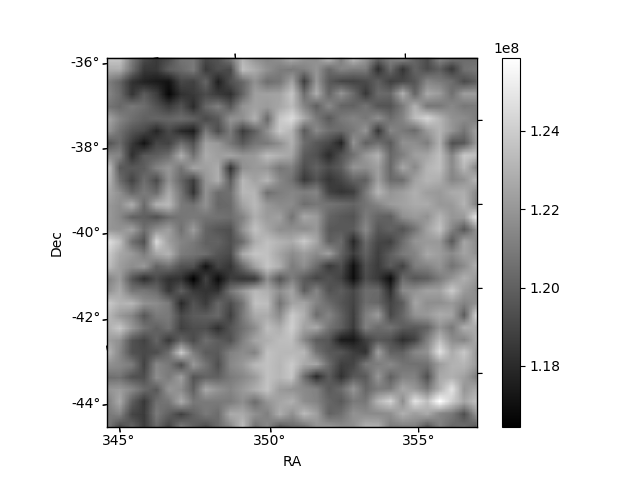
Histogram calculated using DETX and DETY for each event in the final _common_clean file
| Quadrant A | 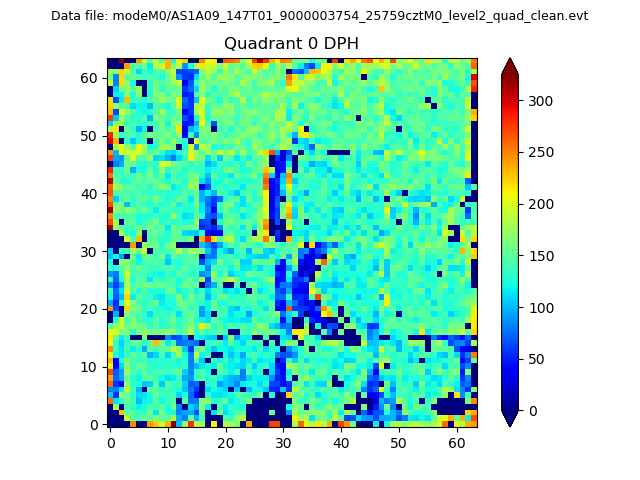 |
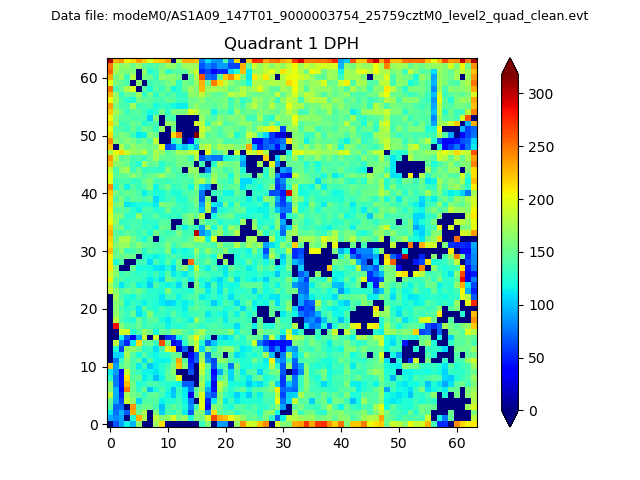 |
Quadrant B |
|---|---|---|---|
| Quadrant D | 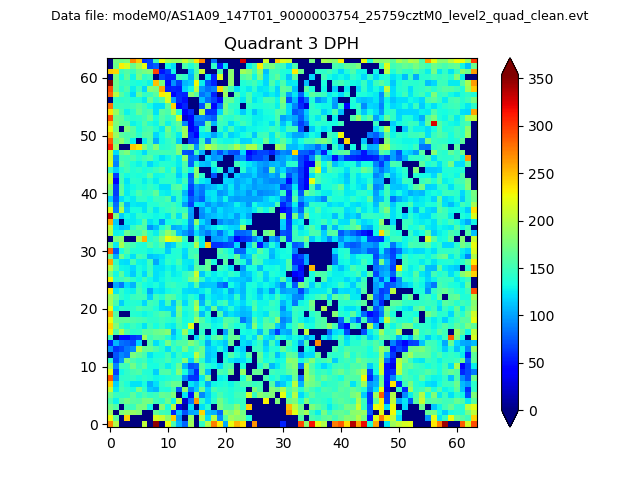 |
 |
Quadrant C |
| Plot type | Count rate plots | Images |
|---|---|---|
| Comparison with Poisson distribution Blue bars denote a histogram of data divided into 1 sec bins. Red curve is a Poisson curve with rate = median count rate of data. |
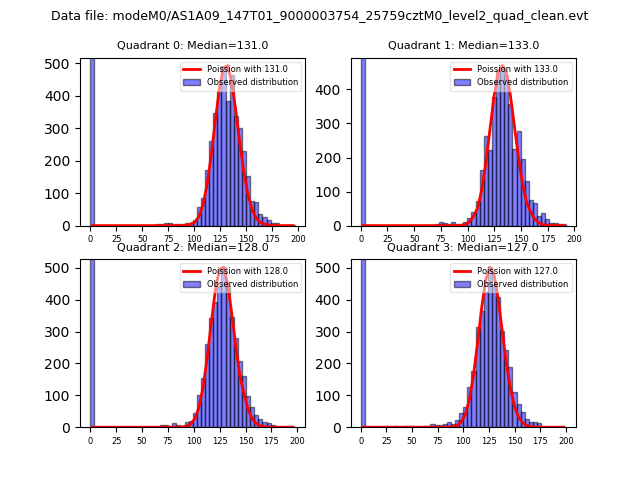 |
 |
| Quadrant-wise count rates Data is divided into 100 sec bins |
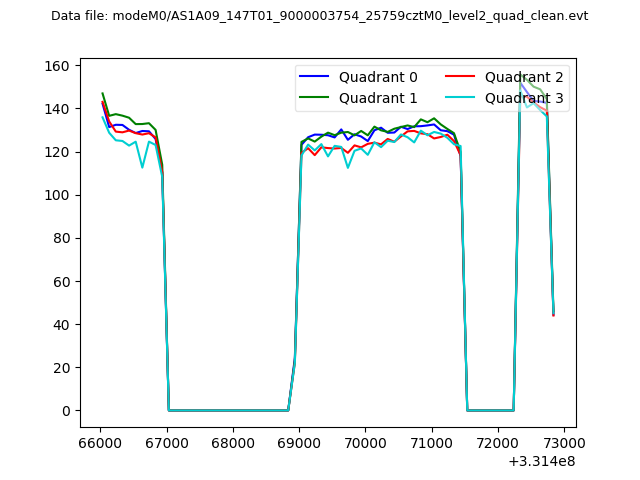 |
|
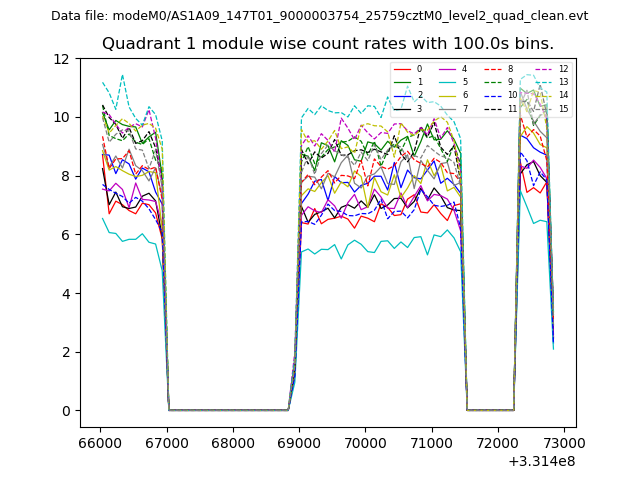
| Module-wise count rates for Quadrant A Data is divided into 100 sec bins |
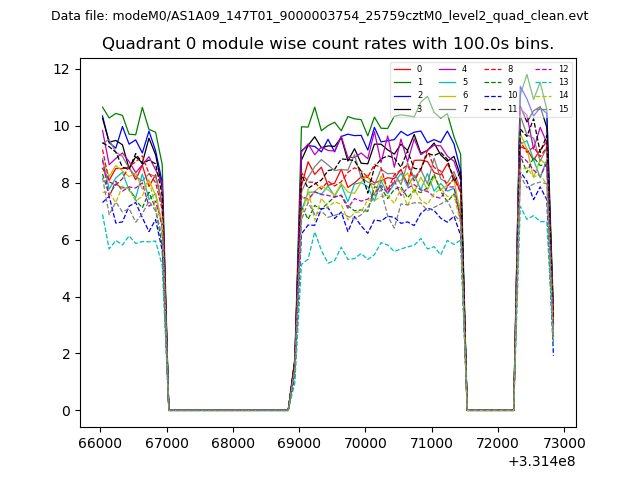 |
 |
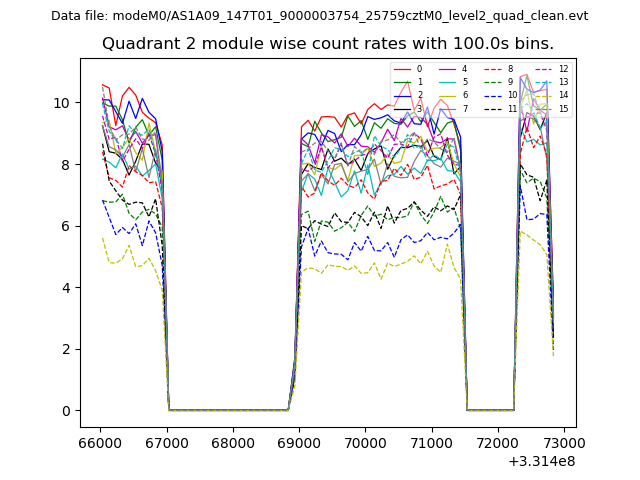
| Module-wise count rates for Quadrant B Data is divided into 100 sec bins |
 |
 |
| Module-wise count rates for Quadrant C Data is divided into 100 sec bins |
 |
 |
| Module-wise count rates for Quadrant D Data is divided into 100 sec bins |
 |
 |
| Parameter | Plot |
|---|---|
| CZT HV Monitor | 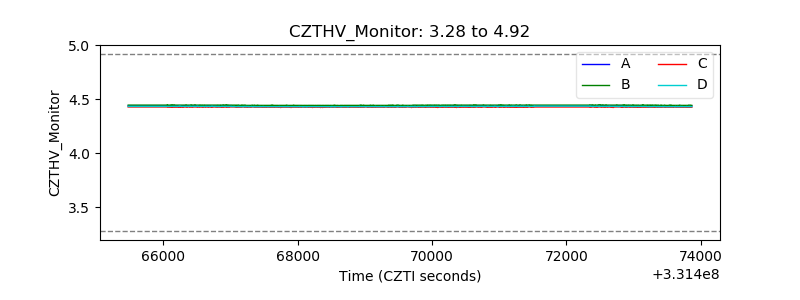 |
| D_VDD | 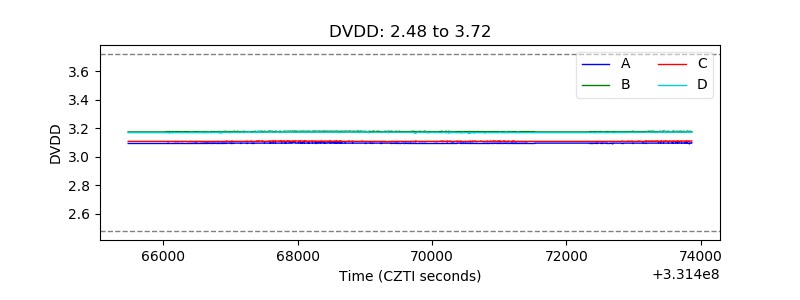 |
| Temperature 1 | 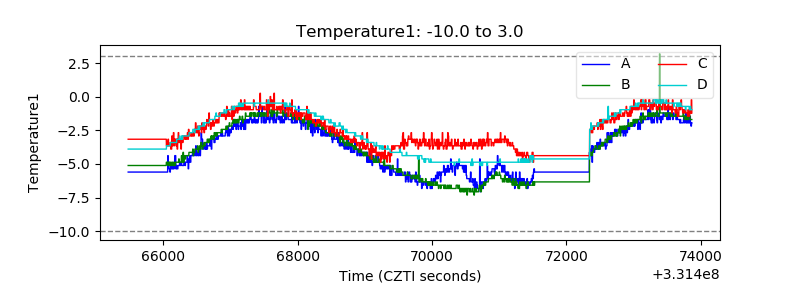 |
| Veto HV Monitor | 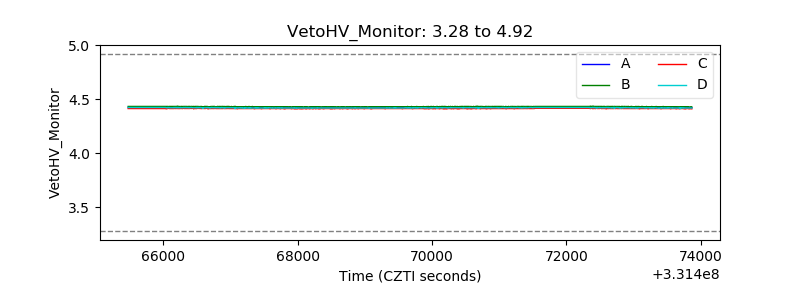 |
| Veto LLD | 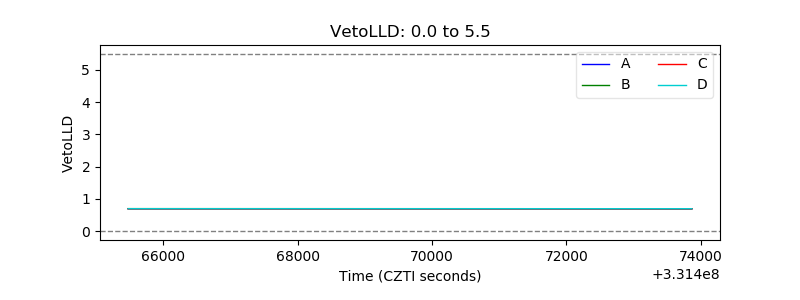 |
| Alpha Counter | 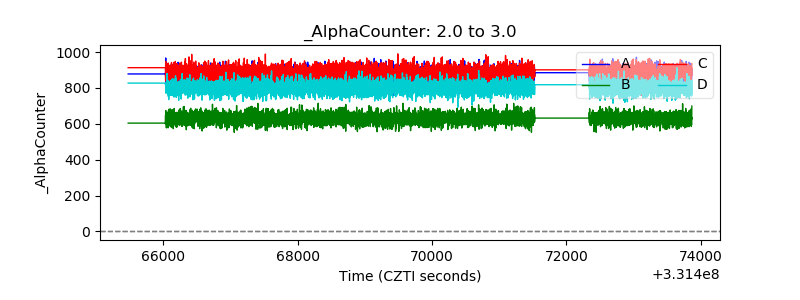 |
| _CPM_Rate | 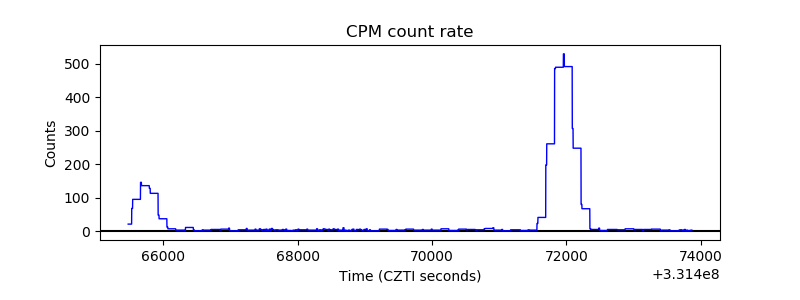 |
| CZT Counter | 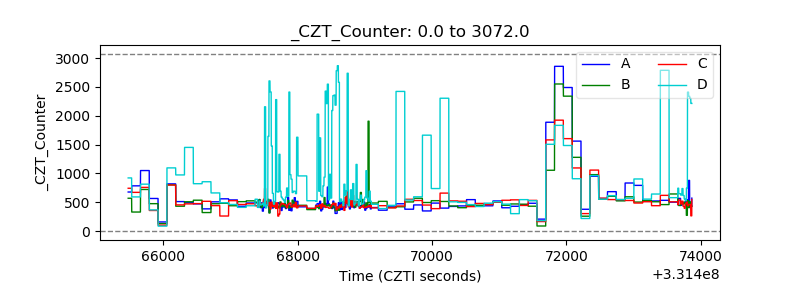 |
| +2.5 Volts monitor |  |
| +5 Volts monitor | 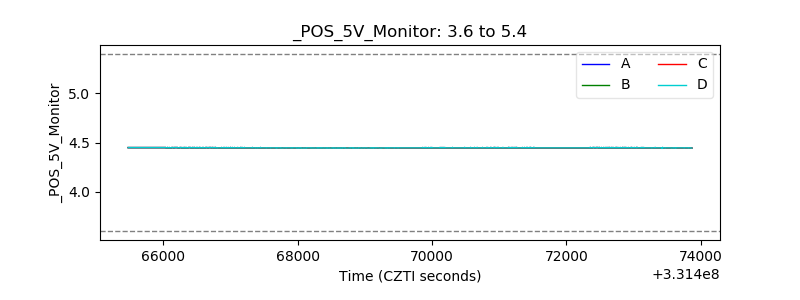 |
| _ROLL_ROT | 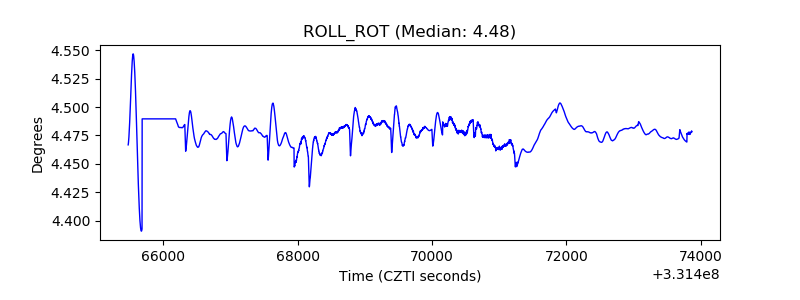 |
| _Roll_DEC | 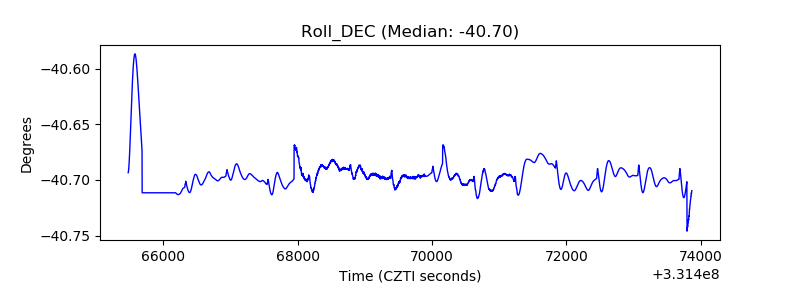 |
| _Roll_RA | 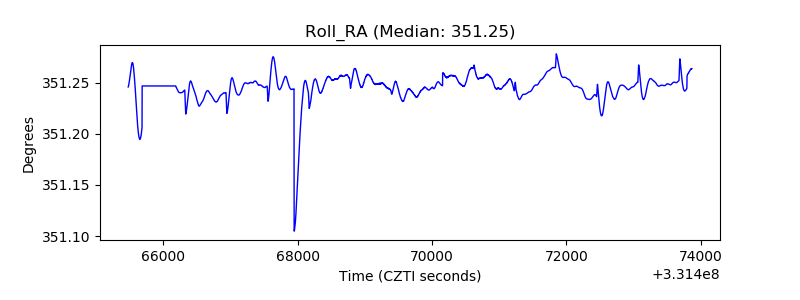 |
| Veto Counter | 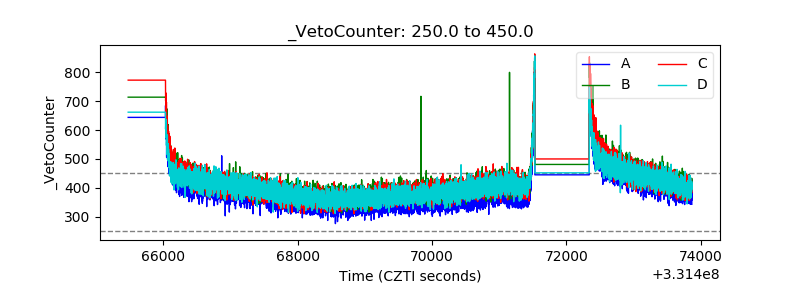 |