| Param | Original file | Final file |
|---|---|---|
| Filename | modeM0/AS1A09_147T01_9000003754_25760cztM0_level2.evt | modeM0/AS1A09_147T01_9000003754_25760cztM0_level2_quad_clean.evt |
| Size (bytes) | 528,840,000 | 73,304,640 |
| Size | 504.3 MB | 69.9 MB |
| Events in quadrant A | 3,413,473 | 449,050 |
| Events in quadrant B | 3,472,562 | 454,261 |
| Events in quadrant C | 3,306,770 | 432,615 |
| Events in quadrant D | 5,367,223 | 415,059 |
| Mode M9 | |||
|---|---|---|---|
| Quadrant | BADHDUFLAG | Total packets | Discarded packets |
| A | 0 | 12 | 0 |
| B | 0 | 13 | 0 |
| C | 0 | 13 | 0 |
| D | 0 | 13 | 0 |
| Mode M0 | |||
|---|---|---|---|
| Quadrant | BADHDUFLAG | Total packets | Discarded packets |
| A | 0 | 14430 | 0 |
| B | 0 | 14574 | 0 |
| C | 0 | 14067 | 0 |
| D | 0 | 20343 | 0 |
| Quadrant | Total seconds | Saturated seconds | Saturation percentage |
|---|---|---|---|
| A | 6722 | 41 | 0.609938% |
| B | 6722 | 96 | 1.428146% |
| C | 6722 | 62 | 0.922345% |
| D | 6722 | 573 | 8.524249% |
Noise dominated data is calculated using 1-second bins in cleaned event files. If a bin has >2000 counts, and if more than 50% of those come from <1% of pixels, then it is considered to be noise-dominated and hence unusable.
| Quadrant | # 1 sec bins | Bins with >0 counts | Bins with >2000 counts | High rate bins dominated by noise | Noise dominated (total time) | Noise dominated (detector-on time) | Marked lightcurve |
|---|---|---|---|---|---|---|---|
| A | 7727 | 6722 | 0 | 0 | 0.00% | 0.00% | 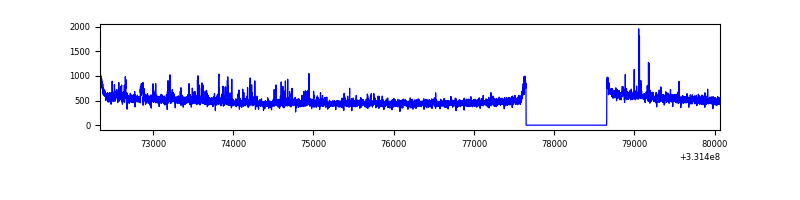 |
| B | 7727 | 6722 | 35 | 35 | 0.45% | 0.52% | 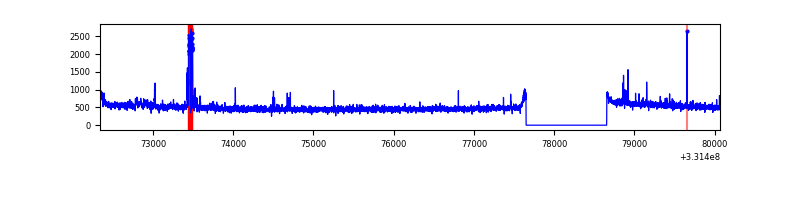 |
| C | 7727 | 6722 | 1 | 1 | 0.01% | 0.01% | 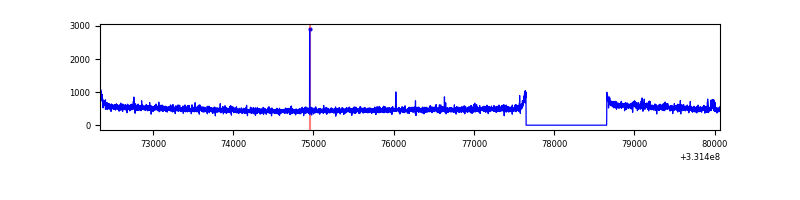 |
| D | 7727 | 6722 | 532 | 532 | 6.88% | 7.91% | 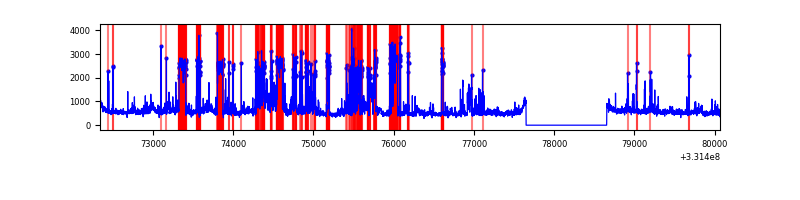 |
Top three noisy pixels from each quadrant. If the there are fewer than three noisy pixels in the level2.evt file, extra rows are filled as -1
| Pixel properties | Quadrant properties | ||||||
|---|---|---|---|---|---|---|---|
| Quadrant | DetID | PixID | Counts | Sigma | Mean | Median | Sigma |
| A | 6 | 16 | 121896 | 715.54 | 847 | 832 | 169.2 |
| A | 0 | 13 | 26284 | 150.43 | 847 | 832 | 169.2 |
| A | 13 | 254 | 10366 | 56.35 | 847 | 832 | 169.2 |
| B | 7 | 219 | 59155 | 366.89 | 838 | 816 | 159.0 |
| B | 7 | 235 | 36904 | 226.95 | 838 | 816 | 159.0 |
| B | 0 | 190 | 33931 | 208.26 | 838 | 816 | 159.0 |
| C | 14 | 238 | 129538 | 679.65 | 806 | 813 | 189.4 |
| C | 3 | 233 | 34071 | 175.6 | 806 | 813 | 189.4 |
| C | 13 | 61 | 5503 | 24.76 | 806 | 813 | 189.4 |
| D | 1 | 52 | 1606593 | 8543.73 | 781 | 763 | 188.0 |
| D | 12 | 1 | 340204 | 1805.98 | 781 | 763 | 188.0 |
| D | 7 | 80 | 256577 | 1361.04 | 781 | 763 | 188.0 |
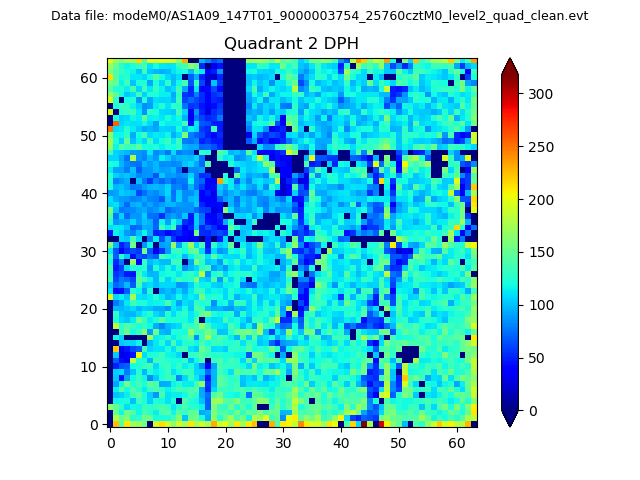
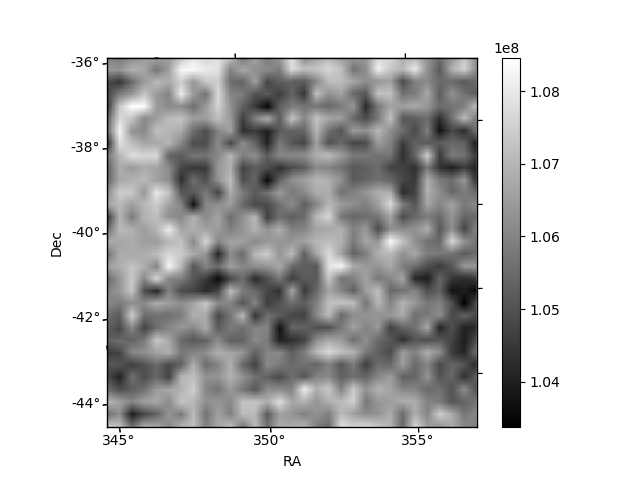
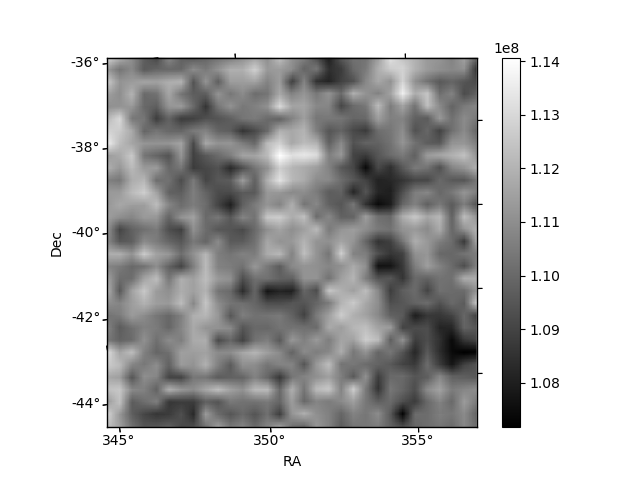
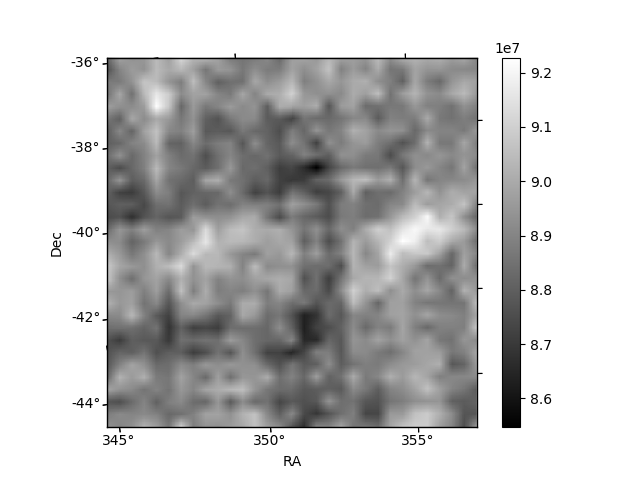
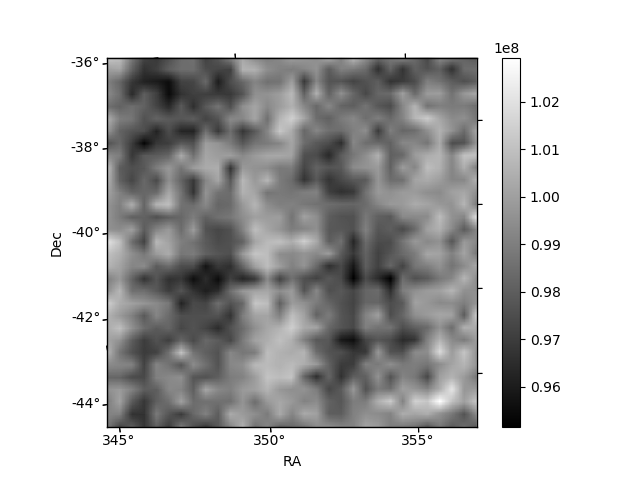
Histogram calculated using DETX and DETY for each event in the final _common_clean file
| Quadrant A | 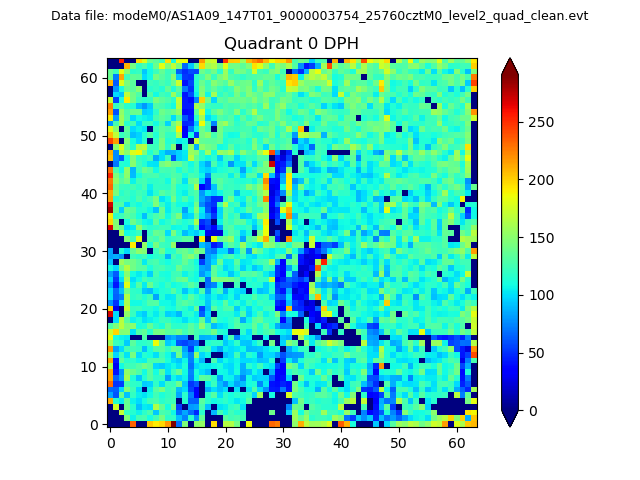 |
 |
Quadrant B |
|---|---|---|---|
| Quadrant D |  |
 |
Quadrant C |
| Plot type | Count rate plots | Images |
|---|---|---|
| Comparison with Poisson distribution Blue bars denote a histogram of data divided into 1 sec bins. Red curve is a Poisson curve with rate = median count rate of data. |
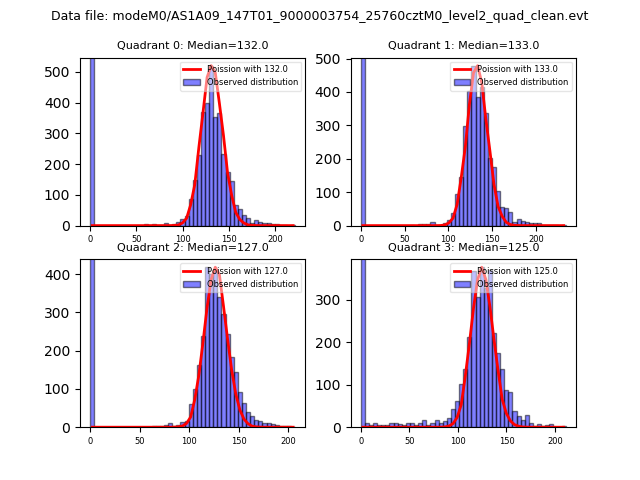 |
 |
| Quadrant-wise count rates Data is divided into 100 sec bins |
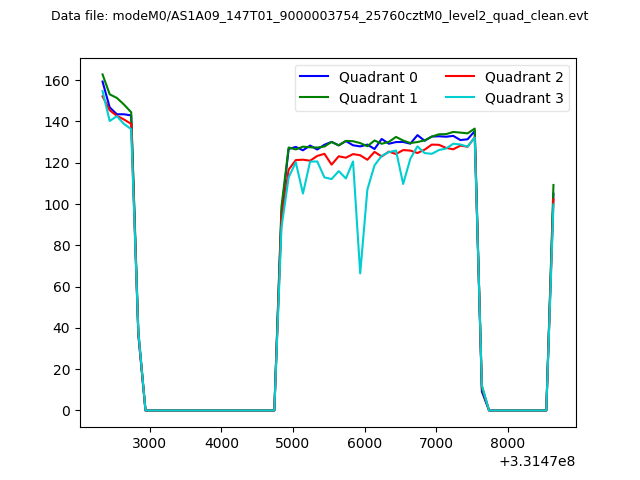 |
|
| Module-wise count rates for Quadrant A Data is divided into 100 sec bins |
 |
 |
| Module-wise count rates for Quadrant B Data is divided into 100 sec bins |
 |
 |
| Module-wise count rates for Quadrant C Data is divided into 100 sec bins |
 |
 |
| Module-wise count rates for Quadrant D Data is divided into 100 sec bins |
 |
 |
| Parameter | Plot |
|---|---|
| CZT HV Monitor |  |
| D_VDD | 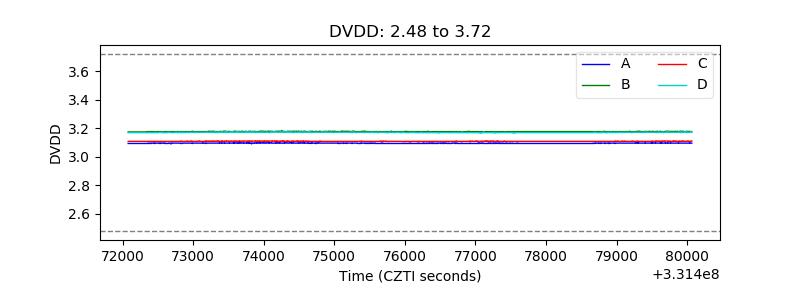 |
| Temperature 1 | 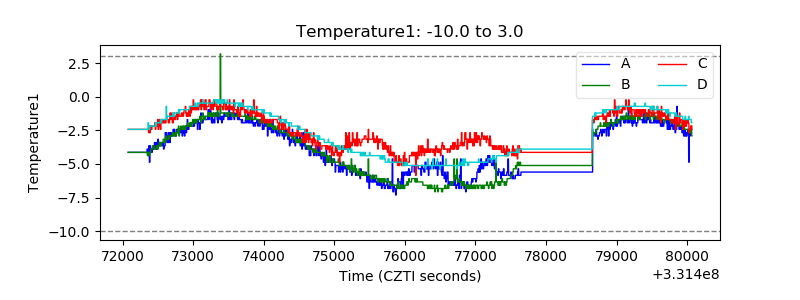 |
| Veto HV Monitor |  |
| Veto LLD | 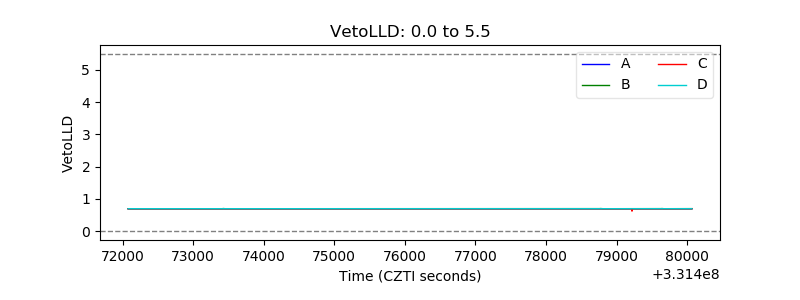 |
| Alpha Counter | 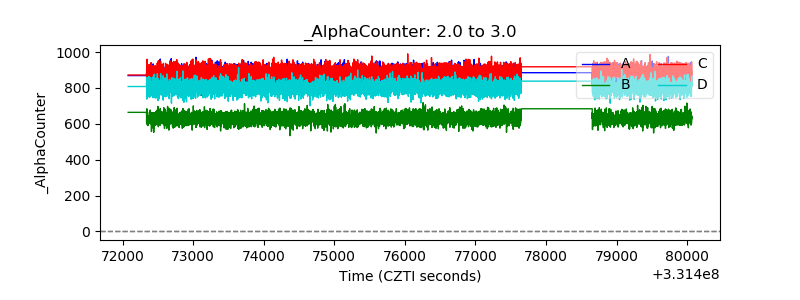 |
| _CPM_Rate | 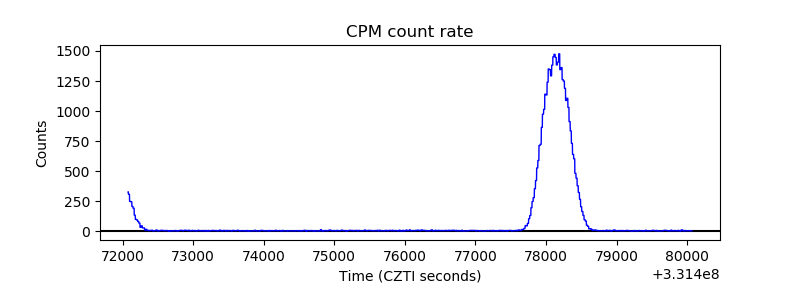 |
| CZT Counter | 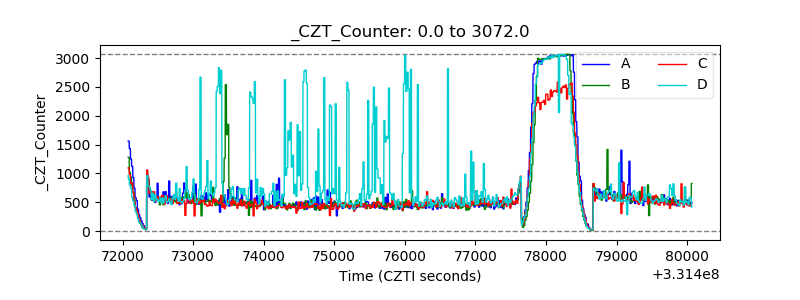 |
| +2.5 Volts monitor | 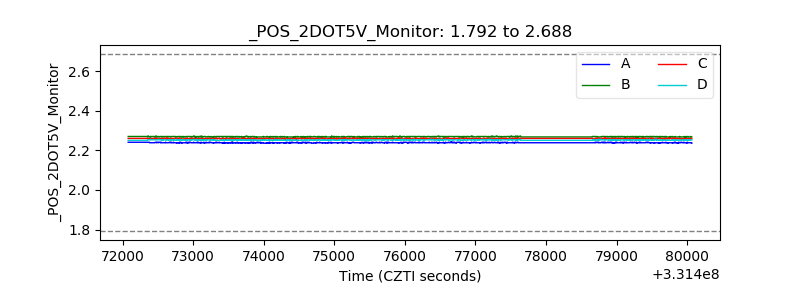 |
| +5 Volts monitor |  |
| _ROLL_ROT | 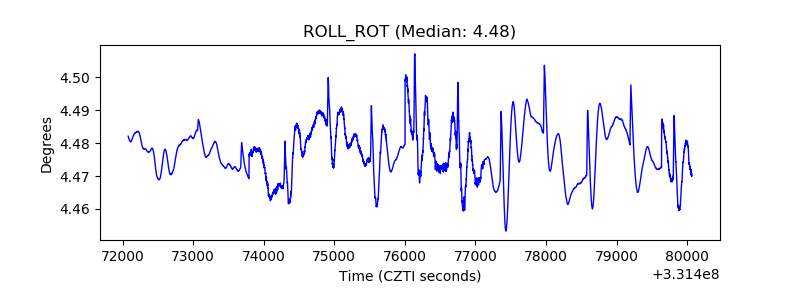 |
| _Roll_DEC |  |
| _Roll_RA | 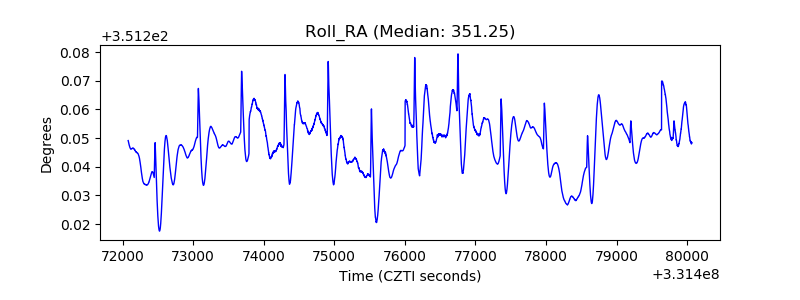 |
| Veto Counter | 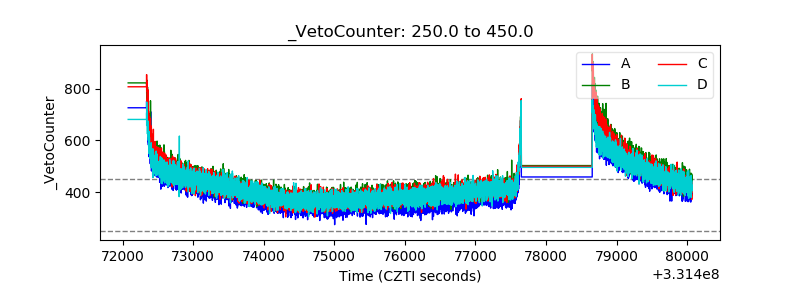 |