| Param | Original file | Final file |
|---|---|---|
| Filename | modeM0/AS1A09_147T01_9000003754_25762cztM0_level2.evt | modeM0/AS1A09_147T01_9000003754_25762cztM0_level2_quad_clean.evt |
| Size (bytes) | 484,217,280 | 69,543,360 |
| Size | 461.8 MB | 66.3 MB |
| Events in quadrant A | 3,315,363 | 422,786 |
| Events in quadrant B | 3,411,458 | 424,324 |
| Events in quadrant C | 3,401,287 | 404,707 |
| Events in quadrant D | 4,095,701 | 400,842 |
| Mode M9 | |||
|---|---|---|---|
| Quadrant | BADHDUFLAG | Total packets | Discarded packets |
| A | 0 | 11 | 0 |
| B | 0 | 12 | 0 |
| C | 0 | 12 | 0 |
| D | 0 | 12 | 0 |
| Mode M0 | |||
|---|---|---|---|
| Quadrant | BADHDUFLAG | Total packets | Discarded packets |
| A | 0 | 14127 | 0 |
| B | 0 | 14329 | 0 |
| C | 0 | 14191 | 0 |
| D | 0 | 16456 | 0 |
| Quadrant | Total seconds | Saturated seconds | Saturation percentage |
|---|---|---|---|
| A | 6486 | 53 | 0.817145% |
| B | 6486 | 61 | 0.940487% |
| C | 6486 | 86 | 1.325933% |
| D | 6486 | 180 | 2.775208% |
Noise dominated data is calculated using 1-second bins in cleaned event files. If a bin has >2000 counts, and if more than 50% of those come from <1% of pixels, then it is considered to be noise-dominated and hence unusable.
| Quadrant | # 1 sec bins | Bins with >0 counts | Bins with >2000 counts | High rate bins dominated by noise | Noise dominated (total time) | Noise dominated (detector-on time) | Marked lightcurve |
|---|---|---|---|---|---|---|---|
| A | 7631 | 6486 | 0 | 0 | 0.00% | 0.00% | 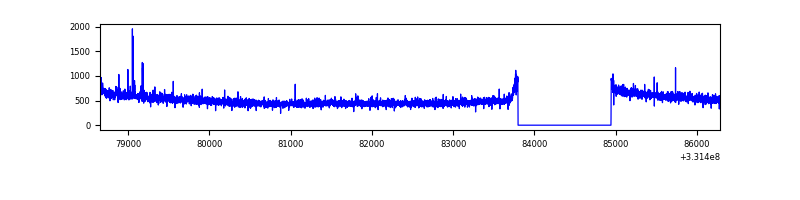 |
| B | 7631 | 6486 | 1 | 1 | 0.01% | 0.02% | 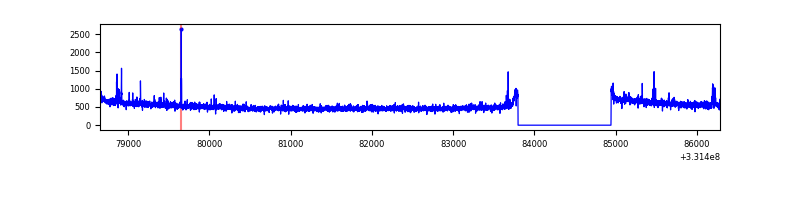 |
| C | 7631 | 6486 | 0 | 0 | 0.00% | 0.00% | 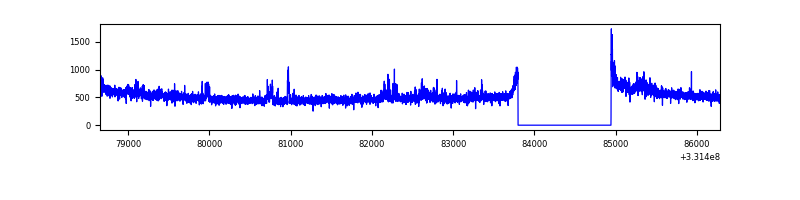 |
| D | 7631 | 6486 | 142 | 142 | 1.86% | 2.19% | 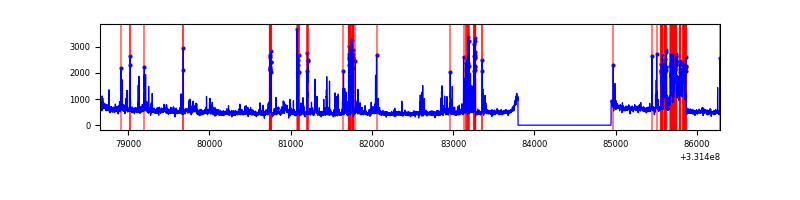 |
Top three noisy pixels from each quadrant. If the there are fewer than three noisy pixels in the level2.evt file, extra rows are filled as -1
| Pixel properties | Quadrant properties | ||||||
|---|---|---|---|---|---|---|---|
| Quadrant | DetID | PixID | Counts | Sigma | Mean | Median | Sigma |
| A | 0 | 13 | 26563 | 152.17 | 852 | 835 | 169.1 |
| A | 13 | 254 | 9289 | 50.0 | 852 | 835 | 169.1 |
| A | 3 | 137 | 7749 | 40.89 | 852 | 835 | 169.1 |
| B | 0 | 190 | 25747 | 159.43 | 841 | 823 | 156.3 |
| B | 3 | 64 | 23838 | 147.22 | 841 | 823 | 156.3 |
| B | 0 | 229 | 23802 | 146.99 | 841 | 823 | 156.3 |
| C | 3 | 233 | 134374 | 719.87 | 804 | 811 | 185.5 |
| C | 14 | 238 | 130799 | 700.6 | 804 | 811 | 185.5 |
| C | 13 | 61 | 5411 | 24.79 | 804 | 811 | 185.5 |
| D | 7 | 80 | 634201 | 3241.69 | 814 | 795 | 195.4 |
| D | 1 | 52 | 168625 | 858.93 | 814 | 795 | 195.4 |
| D | 8 | 195 | 91295 | 463.17 | 814 | 795 | 195.4 |
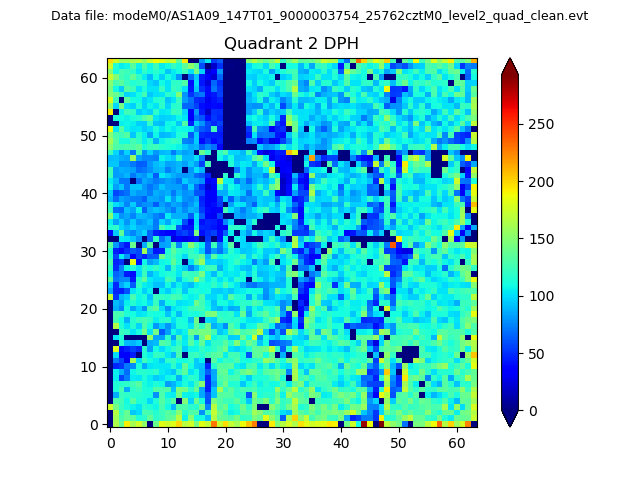
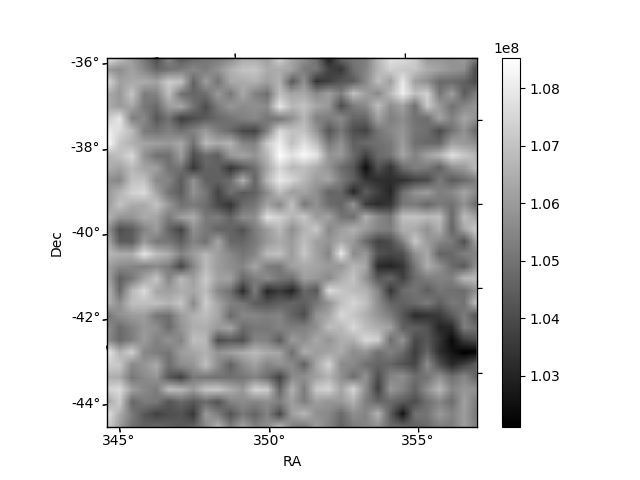
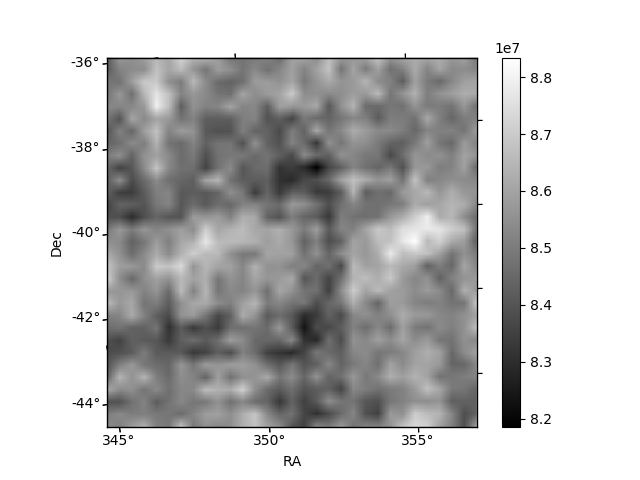
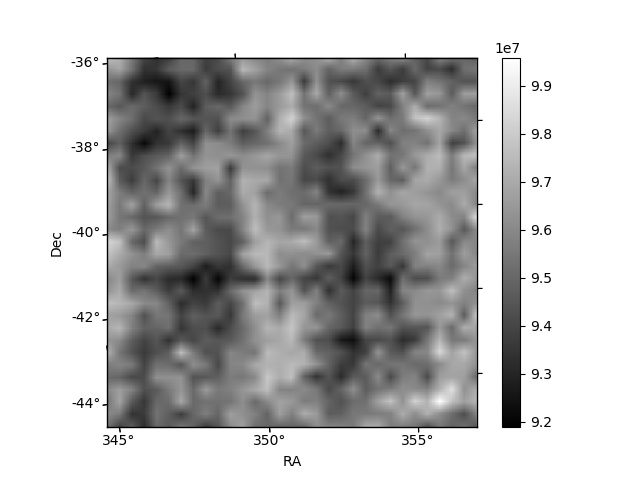
Histogram calculated using DETX and DETY for each event in the final _common_clean file
| Quadrant A | 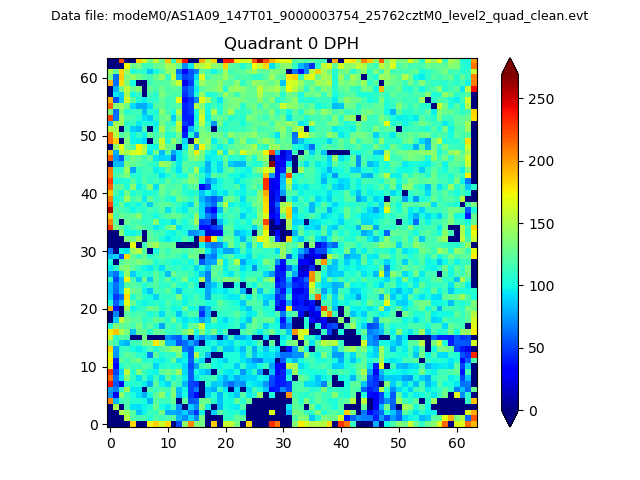 |
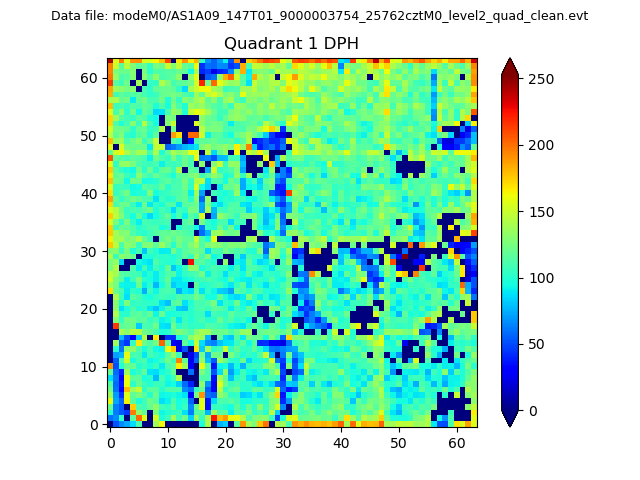 |
Quadrant B |
|---|---|---|---|
| Quadrant D | 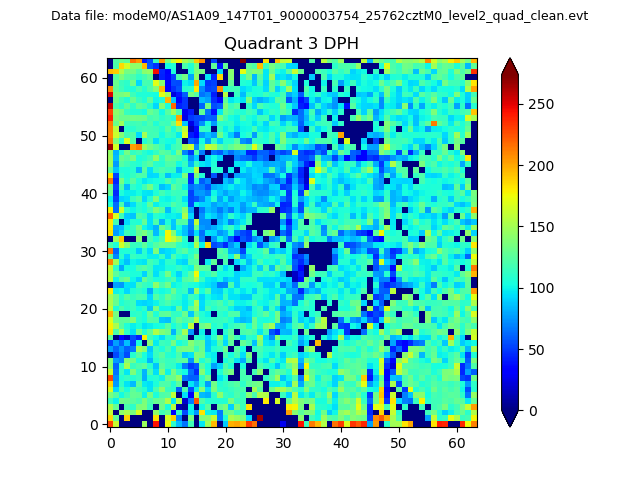 |
 |
Quadrant C |
| Plot type | Count rate plots | Images |
|---|---|---|
| Comparison with Poisson distribution Blue bars denote a histogram of data divided into 1 sec bins. Red curve is a Poisson curve with rate = median count rate of data. |
 |
 |
| Quadrant-wise count rates Data is divided into 100 sec bins |
 |
|
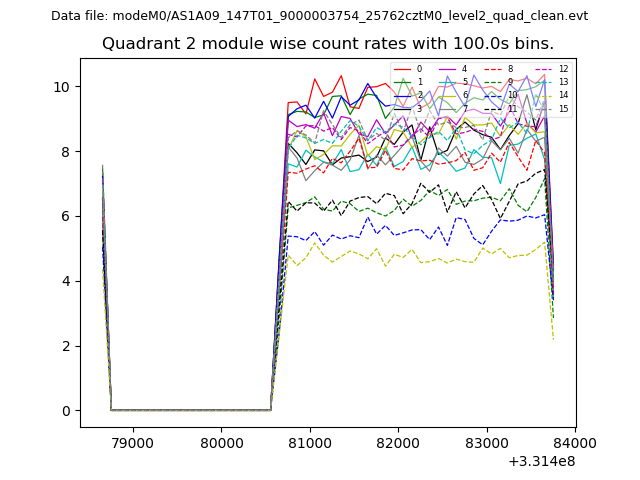
| Module-wise count rates for Quadrant A Data is divided into 100 sec bins |
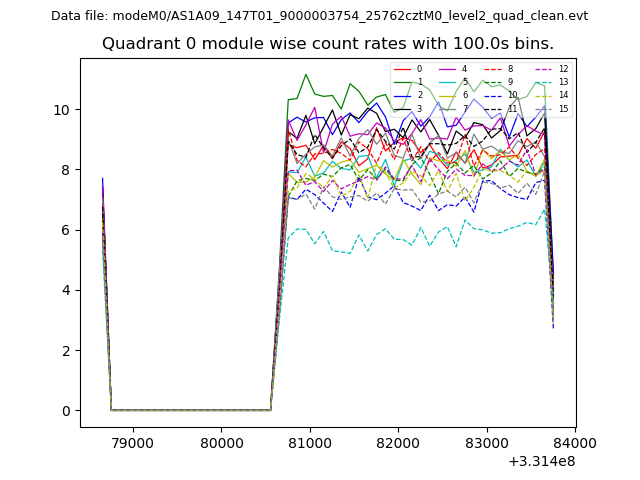 |
 |
| Module-wise count rates for Quadrant B Data is divided into 100 sec bins |
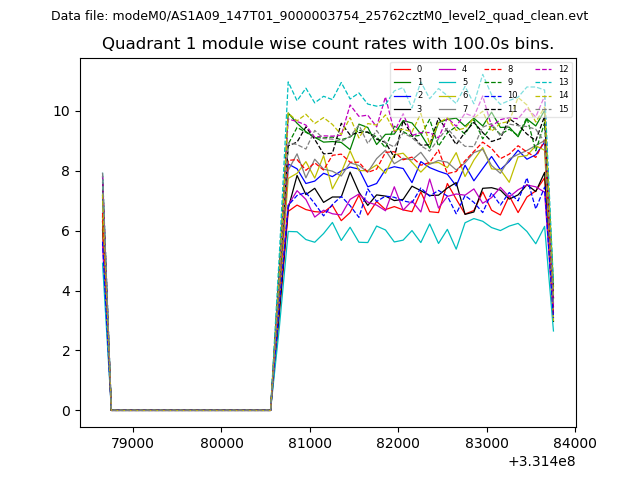 |
 |
| Module-wise count rates for Quadrant C Data is divided into 100 sec bins |
 |
 |
| Module-wise count rates for Quadrant D Data is divided into 100 sec bins |
 |
 |
| Parameter | Plot |
|---|---|
| CZT HV Monitor | 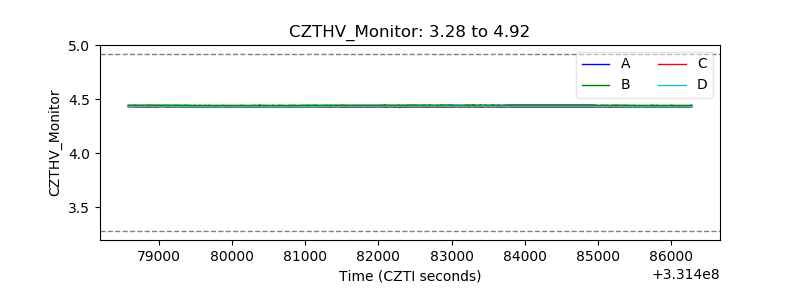 |
| D_VDD | 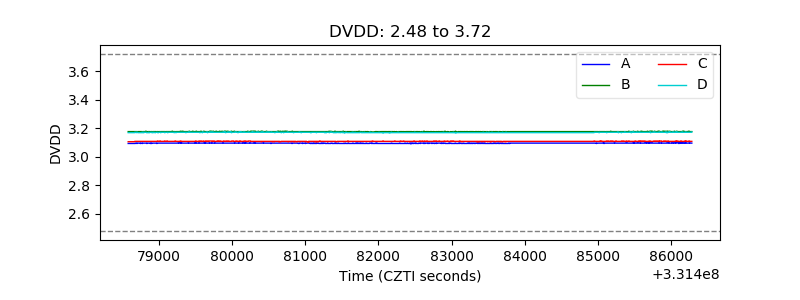 |
| Temperature 1 | 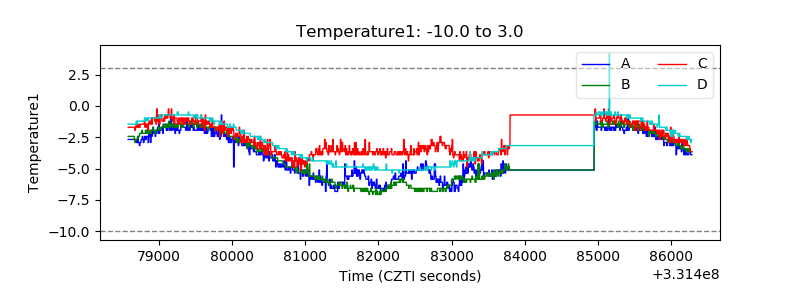 |
| Veto HV Monitor | 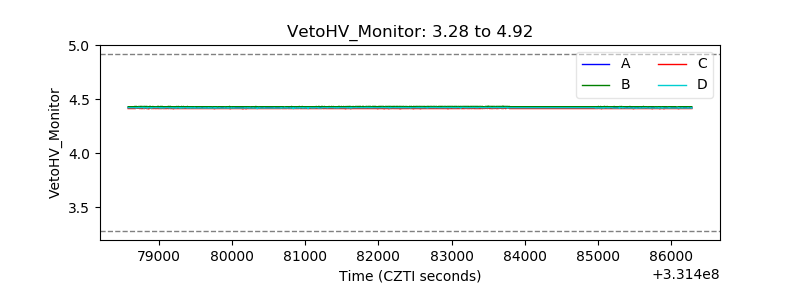 |
| Veto LLD | 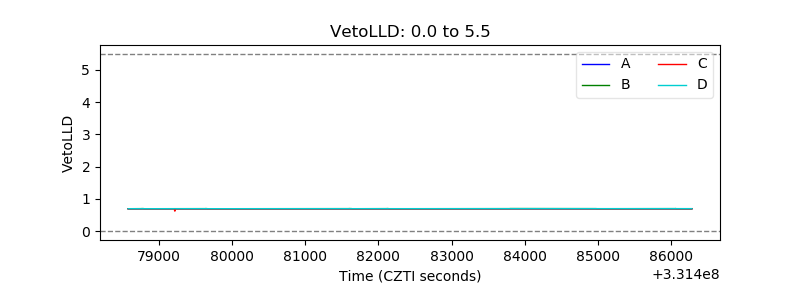 |
| Alpha Counter | 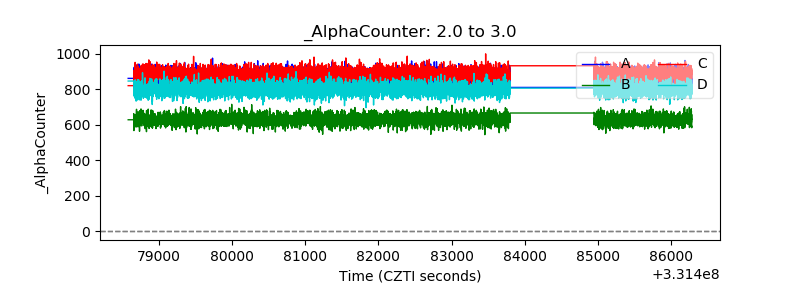 |
| _CPM_Rate | 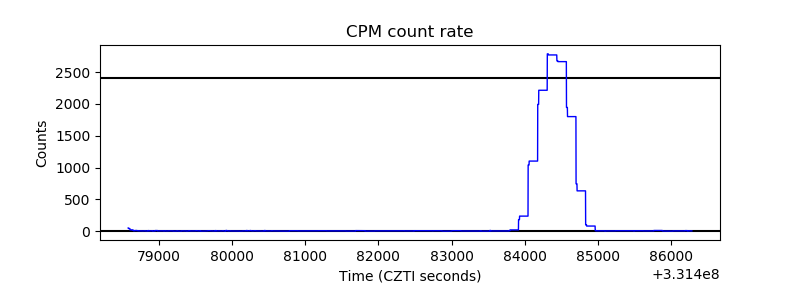 |
| CZT Counter | 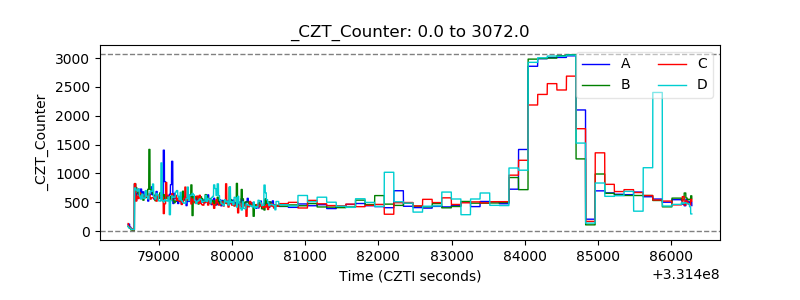 |
| +2.5 Volts monitor |  |
| +5 Volts monitor |  |
| _ROLL_ROT | 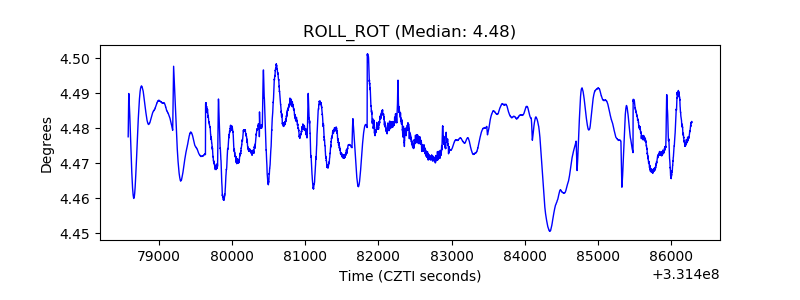 |
| _Roll_DEC | 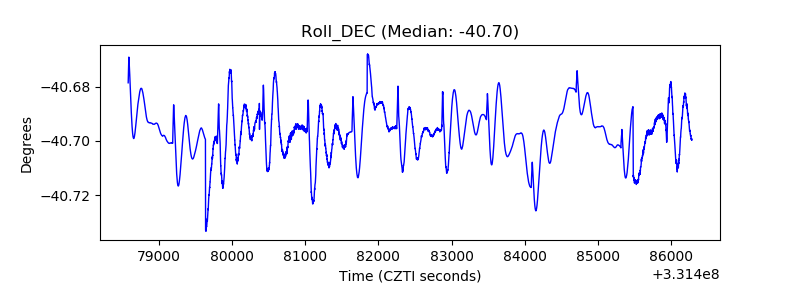 |
| _Roll_RA | 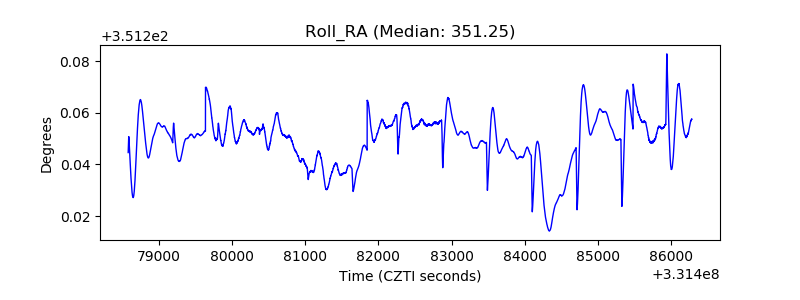 |
| Veto Counter | 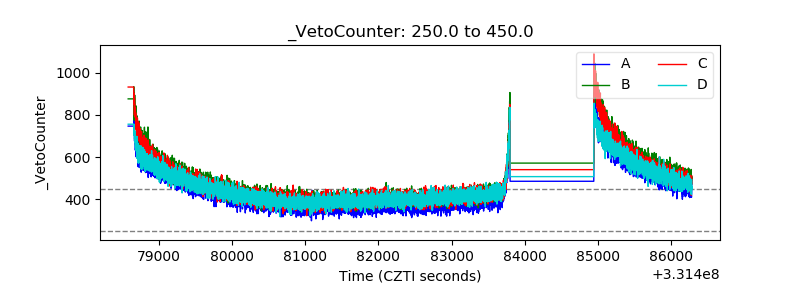 |