| Param | Original file | Final file |
|---|---|---|
| Filename | modeM0/AS1A09_147T01_9000003754_25763cztM0_level2.evt | modeM0/AS1A09_147T01_9000003754_25763cztM0_level2_quad_clean.evt |
| Size (bytes) | 489,536,640 | 77,495,040 |
| Size | 466.9 MB | 73.9 MB |
| Events in quadrant A | 3,327,692 | 487,786 |
| Events in quadrant B | 3,447,051 | 493,409 |
| Events in quadrant C | 3,394,955 | 464,601 |
| Events in quadrant D | 4,231,117 | 463,758 |
| Mode M9 | |||
|---|---|---|---|
| Quadrant | BADHDUFLAG | Total packets | Discarded packets |
| A | 0 | 19 | 0 |
| B | 0 | 20 | 0 |
| C | 0 | 20 | 0 |
| D | 0 | 20 | 0 |
| Mode M0 | |||
|---|---|---|---|
| Quadrant | BADHDUFLAG | Total packets | Discarded packets |
| A | 0 | 13982 | 0 |
| B | 0 | 14331 | 0 |
| C | 0 | 14055 | 0 |
| D | 0 | 16754 | 0 |
| Quadrant | Total seconds | Saturated seconds | Saturation percentage |
|---|---|---|---|
| A | 6267 | 54 | 0.861656% |
| B | 6267 | 75 | 1.196745% |
| C | 6267 | 110 | 1.755226% |
| D | 6267 | 278 | 4.435934% |
Noise dominated data is calculated using 1-second bins in cleaned event files. If a bin has >2000 counts, and if more than 50% of those come from <1% of pixels, then it is considered to be noise-dominated and hence unusable.
| Quadrant | # 1 sec bins | Bins with >0 counts | Bins with >2000 counts | High rate bins dominated by noise | Noise dominated (total time) | Noise dominated (detector-on time) | Marked lightcurve |
|---|---|---|---|---|---|---|---|
| A | 7522 | 6267 | 0 | 0 | 0.00% | 0.00% | 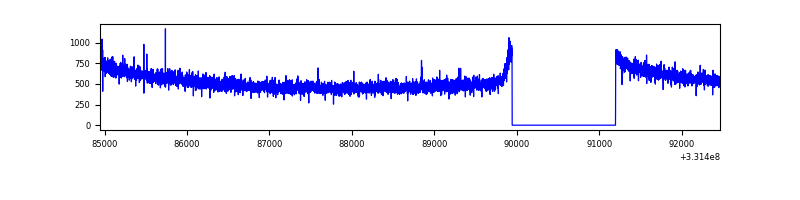 |
| B | 7522 | 6267 | 0 | 0 | 0.00% | 0.00% | 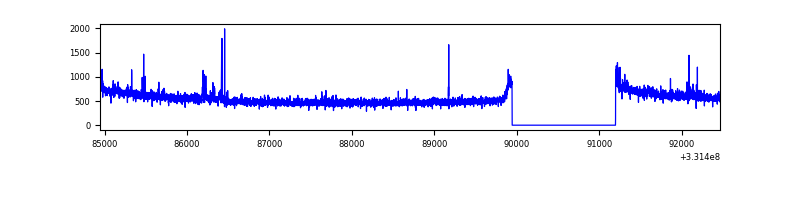 |
| C | 7522 | 6267 | 2 | 2 | 0.03% | 0.03% | 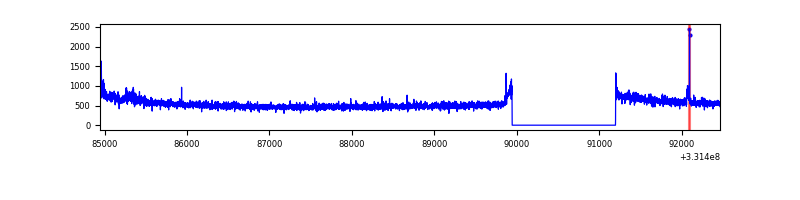 |
| D | 7522 | 6267 | 223 | 223 | 2.96% | 3.56% | 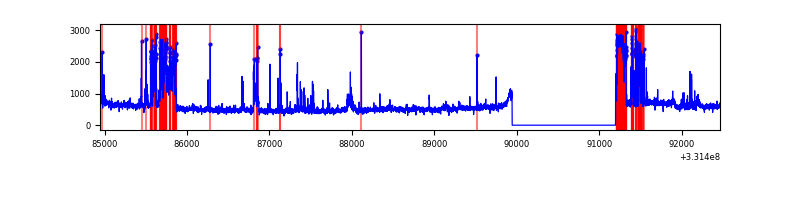 |
Top three noisy pixels from each quadrant. If the there are fewer than three noisy pixels in the level2.evt file, extra rows are filled as -1
| Pixel properties | Quadrant properties | ||||||
|---|---|---|---|---|---|---|---|
| Quadrant | DetID | PixID | Counts | Sigma | Mean | Median | Sigma |
| A | 13 | 254 | 9487 | 51.2 | 860 | 844 | 168.8 |
| A | 5 | 203 | 7922 | 41.93 | 860 | 844 | 168.8 |
| A | 0 | 226 | 7432 | 39.03 | 860 | 844 | 168.8 |
| B | 0 | 229 | 41452 | 256.57 | 856 | 838 | 158.3 |
| B | 12 | 111 | 18098 | 109.04 | 856 | 838 | 158.3 |
| B | 11 | 111 | 16122 | 96.55 | 856 | 838 | 158.3 |
| C | 14 | 238 | 132611 | 704.81 | 810 | 818 | 187.0 |
| C | 3 | 233 | 103971 | 551.65 | 810 | 818 | 187.0 |
| C | 13 | 61 | 5734 | 26.29 | 810 | 818 | 187.0 |
| D | 7 | 80 | 803055 | 4073.33 | 805 | 786 | 197.0 |
| D | 8 | 195 | 222957 | 1128.02 | 805 | 786 | 197.0 |
| D | 12 | 1 | 46801 | 233.63 | 805 | 786 | 197.0 |
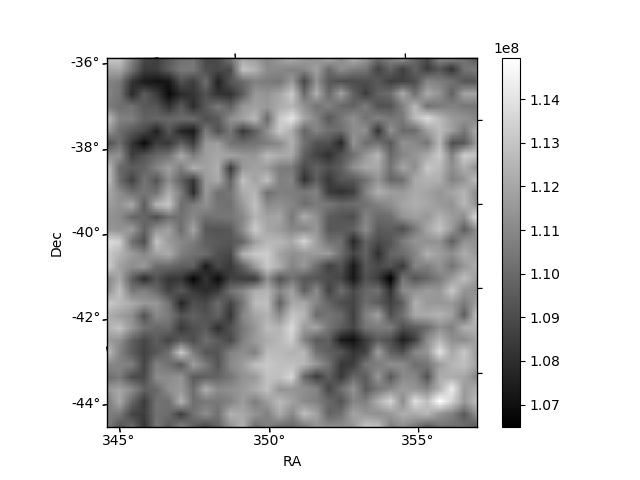
Histogram calculated using DETX and DETY for each event in the final _common_clean file
| Quadrant A | 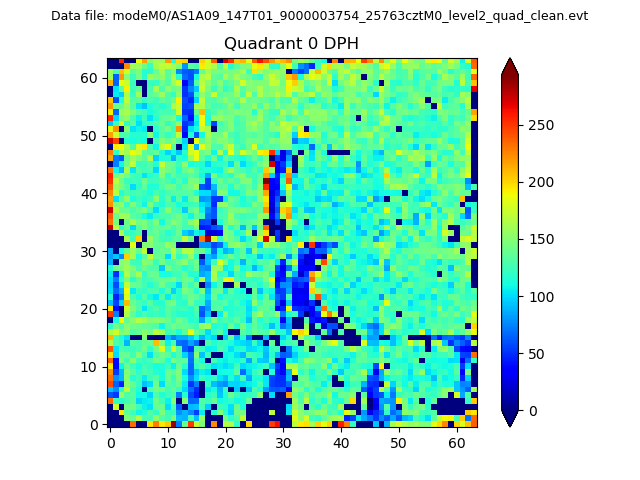 |
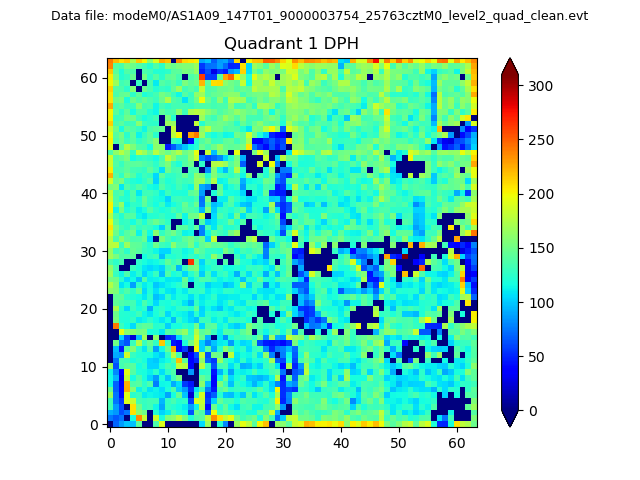 |
Quadrant B |
|---|---|---|---|
| Quadrant D | 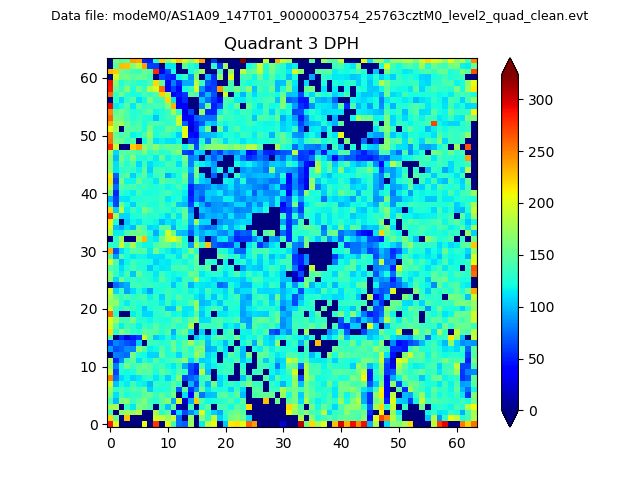 |
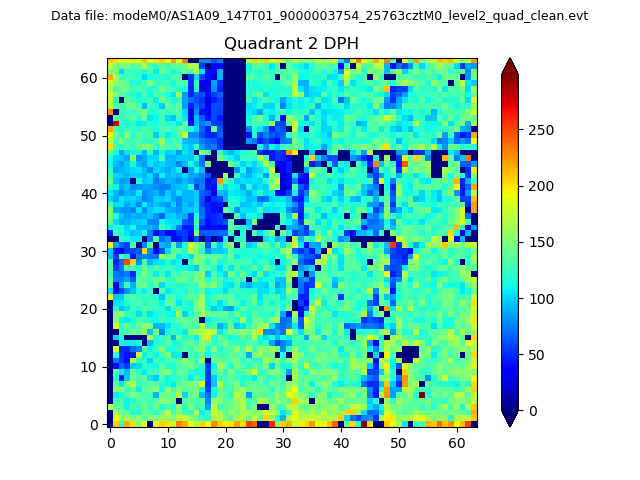 |
Quadrant C |
| Plot type | Count rate plots | Images |
|---|---|---|
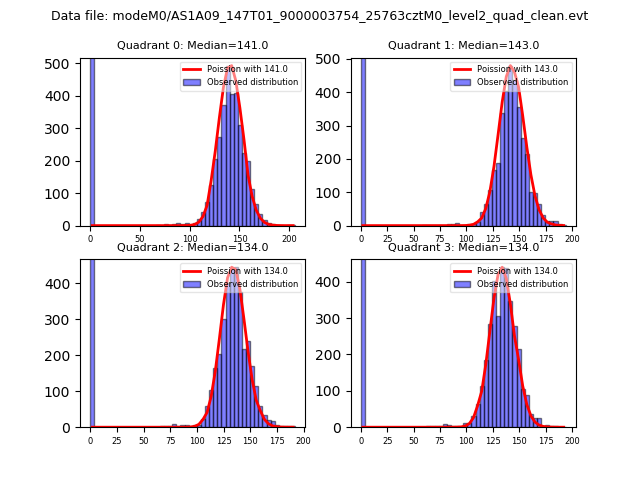
| Comparison with Poisson distribution Blue bars denote a histogram of data divided into 1 sec bins. Red curve is a Poisson curve with rate = median count rate of data. |
 |
 |
| Quadrant-wise count rates Data is divided into 100 sec bins |
 |
|
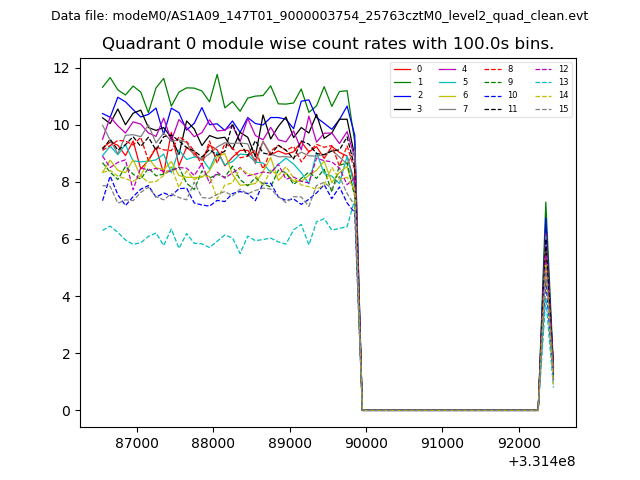
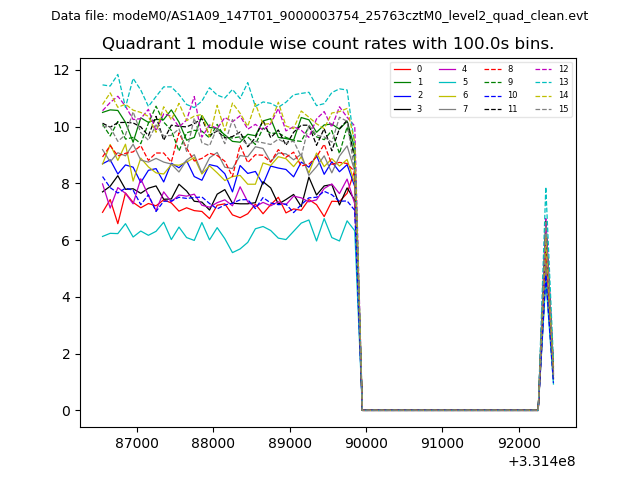
| Module-wise count rates for Quadrant A Data is divided into 100 sec bins |
 |
 |
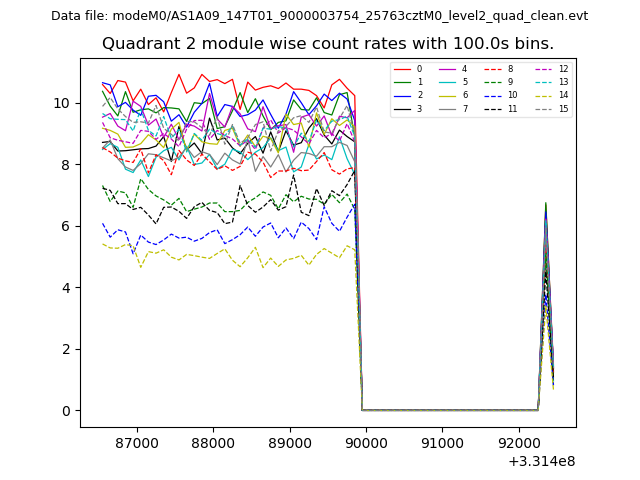
| Module-wise count rates for Quadrant B Data is divided into 100 sec bins |
 |
 |
| Module-wise count rates for Quadrant C Data is divided into 100 sec bins |
 |
 |
| Module-wise count rates for Quadrant D Data is divided into 100 sec bins |
 |
 |
| Parameter | Plot |
|---|---|
| CZT HV Monitor | 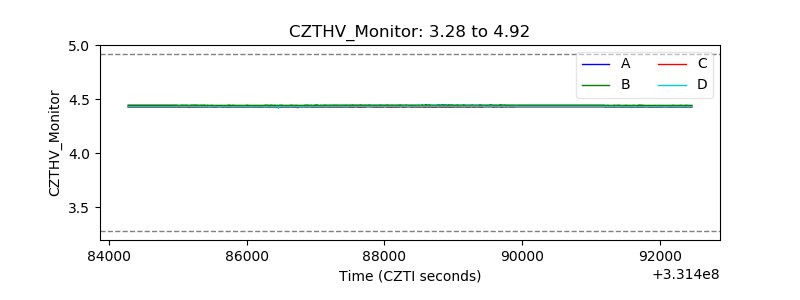 |
| D_VDD | 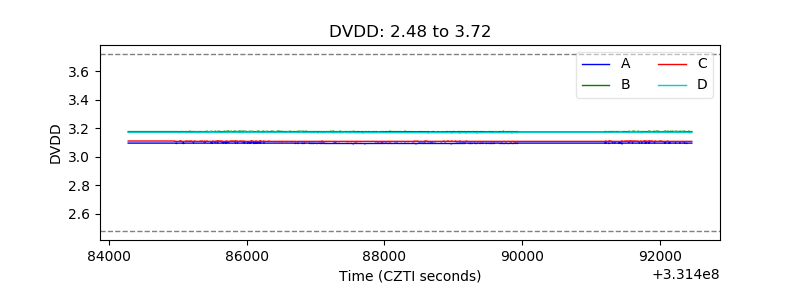 |
| Temperature 1 | 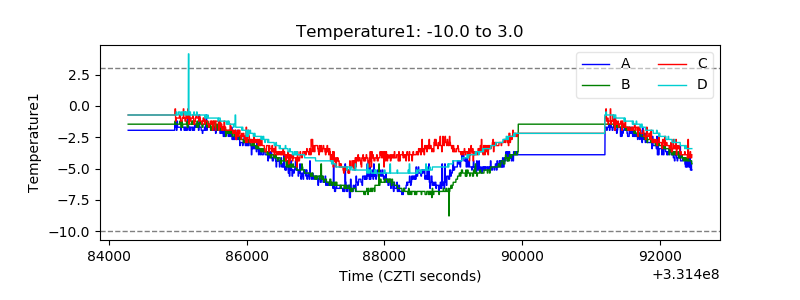 |
| Veto HV Monitor | 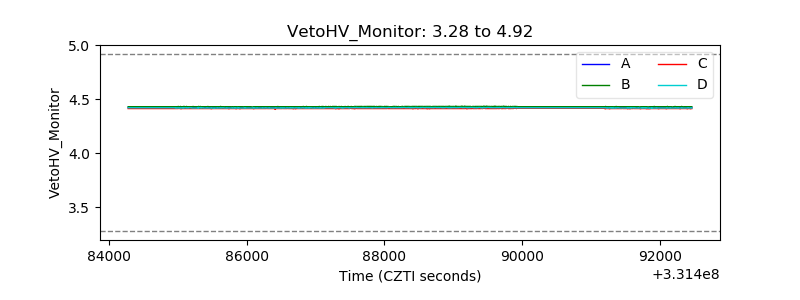 |
| Veto LLD | 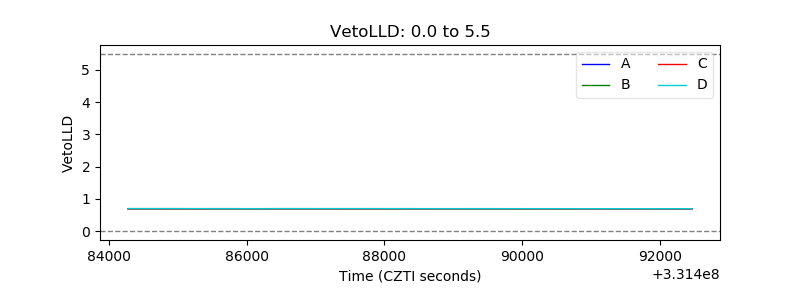 |
| Alpha Counter |  |
| _CPM_Rate | 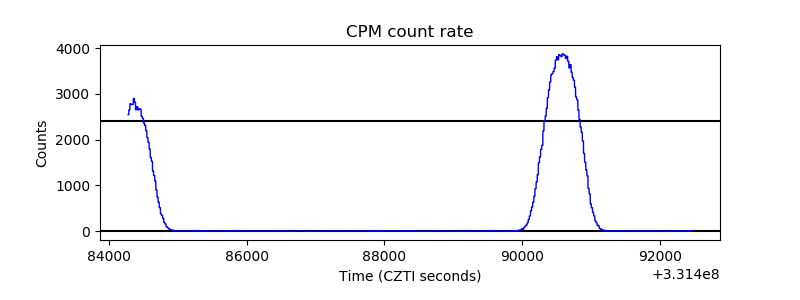 |
| CZT Counter | 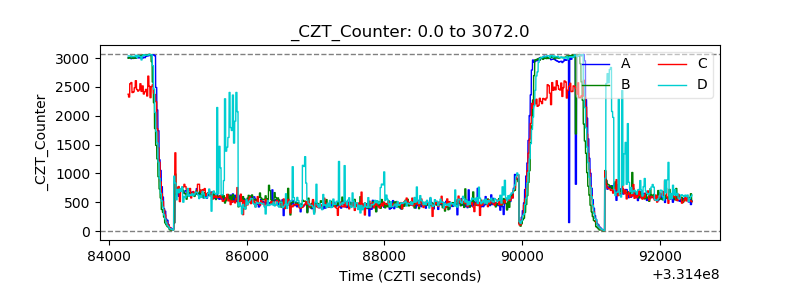 |
| +2.5 Volts monitor |  |
| +5 Volts monitor |  |
| _ROLL_ROT | 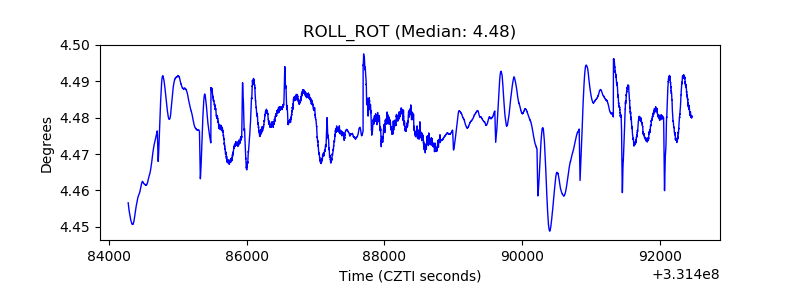 |
| _Roll_DEC |  |
| _Roll_RA | 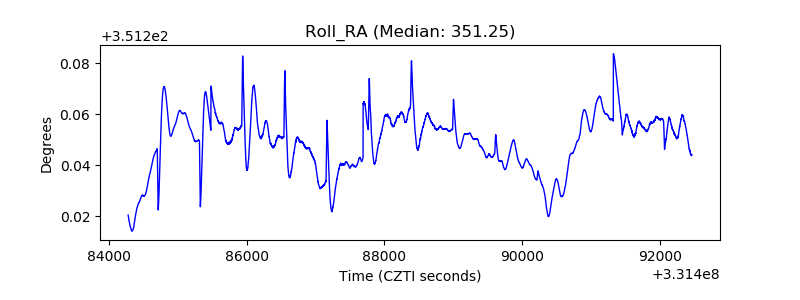 |
| Veto Counter | 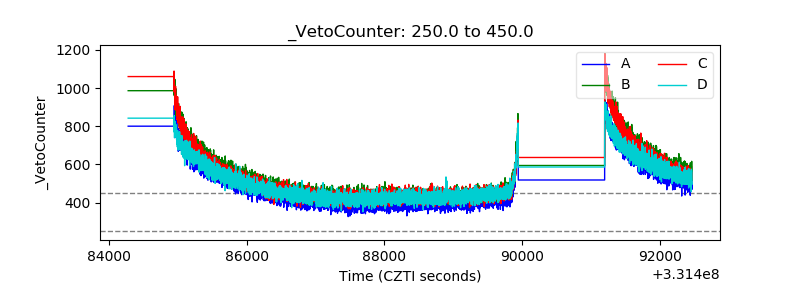 |