| Param | Original file | Final file |
|---|---|---|
| Filename | modeM0/AS1A09_147T01_9000003754_25764cztM0_level2.evt | modeM0/AS1A09_147T01_9000003754_25764cztM0_level2_quad_clean.evt |
| Size (bytes) | 438,776,640 | 93,038,400 |
| Size | 418.5 MB | 88.7 MB |
| Events in quadrant A | 3,052,837 | 618,289 |
| Events in quadrant B | 3,142,536 | 629,862 |
| Events in quadrant C | 3,173,034 | 588,983 |
| Events in quadrant D | 3,532,082 | 581,136 |
| Mode M9 | |||
|---|---|---|---|
| Quadrant | BADHDUFLAG | Total packets | Discarded packets |
| A | 0 | 13 | 0 |
| B | 0 | 13 | 0 |
| C | 0 | 13 | 0 |
| D | 0 | 13 | 0 |
| Mode M0 | |||
|---|---|---|---|
| Quadrant | BADHDUFLAG | Total packets | Discarded packets |
| A | 0 | 12640 | 0 |
| B | 0 | 12963 | 0 |
| C | 0 | 12935 | 0 |
| D | 0 | 14103 | 0 |
| Quadrant | Total seconds | Saturated seconds | Saturation percentage |
|---|---|---|---|
| A | 5706 | 51 | 0.893796% |
| B | 5707 | 73 | 1.279131% |
| C | 5707 | 91 | 1.594533% |
| D | 5706 | 93 | 1.629863% |
Noise dominated data is calculated using 1-second bins in cleaned event files. If a bin has >2000 counts, and if more than 50% of those come from <1% of pixels, then it is considered to be noise-dominated and hence unusable.
| Quadrant | # 1 sec bins | Bins with >0 counts | Bins with >2000 counts | High rate bins dominated by noise | Noise dominated (total time) | Noise dominated (detector-on time) | Marked lightcurve |
|---|---|---|---|---|---|---|---|
| A | 7046 | 5706 | 0 | 0 | 0.00% | 0.00% | 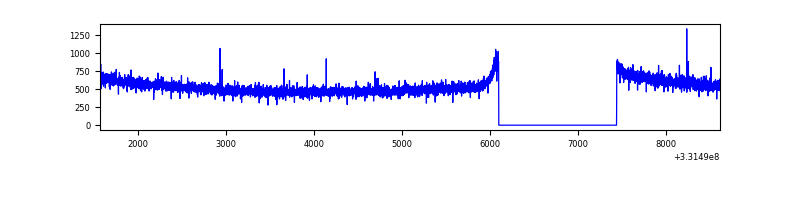 |
| B | 7047 | 5707 | 1 | 1 | 0.01% | 0.02% | 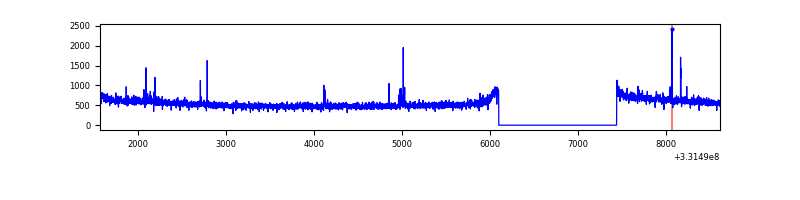 |
| C | 7047 | 5707 | 2 | 2 | 0.03% | 0.04% | 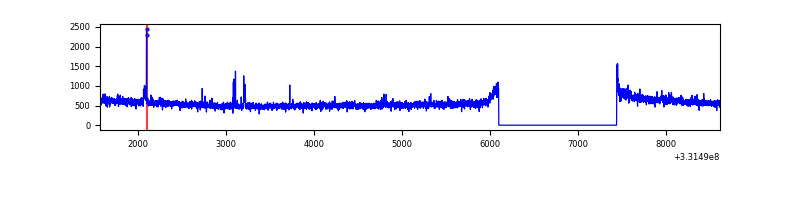 |
| D | 7046 | 5707 | 64 | 64 | 0.91% | 1.12% | 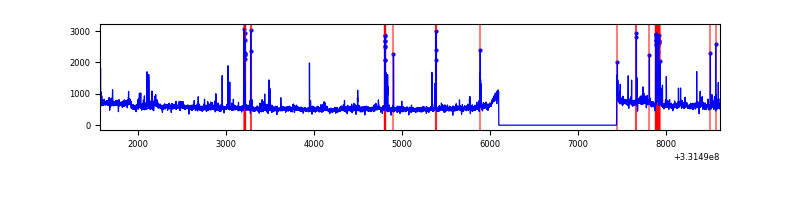 |
Top three noisy pixels from each quadrant. If the there are fewer than three noisy pixels in the level2.evt file, extra rows are filled as -1
| Pixel properties | Quadrant properties | ||||||
|---|---|---|---|---|---|---|---|
| Quadrant | DetID | PixID | Counts | Sigma | Mean | Median | Sigma |
| A | 13 | 254 | 9298 | 54.05 | 792 | 779 | 157.6 |
| A | 0 | 226 | 6804 | 38.22 | 792 | 779 | 157.6 |
| A | 3 | 137 | 6646 | 37.22 | 792 | 779 | 157.6 |
| B | 12 | 111 | 16402 | 107.58 | 791 | 777 | 145.2 |
| B | 11 | 111 | 14736 | 96.11 | 791 | 777 | 145.2 |
| B | 4 | 171 | 13739 | 89.24 | 791 | 777 | 145.2 |
| C | 14 | 238 | 122561 | 710.48 | 751 | 759 | 171.4 |
| C | 3 | 233 | 121383 | 703.61 | 751 | 759 | 171.4 |
| C | 13 | 61 | 5223 | 26.04 | 751 | 759 | 171.4 |
| D | 8 | 195 | 333954 | 1852.62 | 751 | 735 | 179.9 |
| D | 1 | 52 | 155711 | 861.63 | 751 | 735 | 179.9 |
| D | 13 | 104 | 86808 | 478.55 | 751 | 735 | 179.9 |
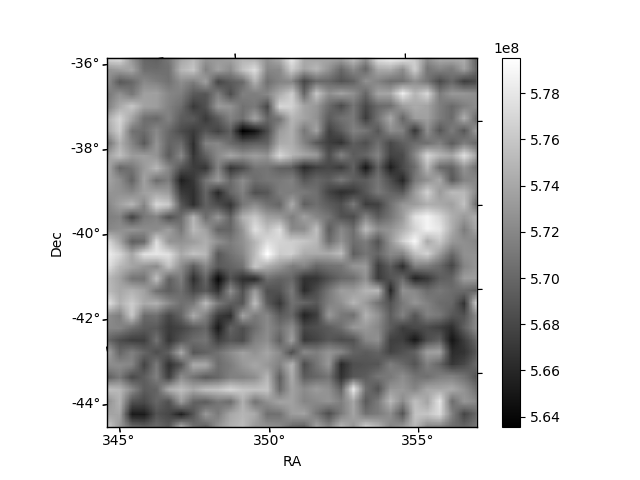
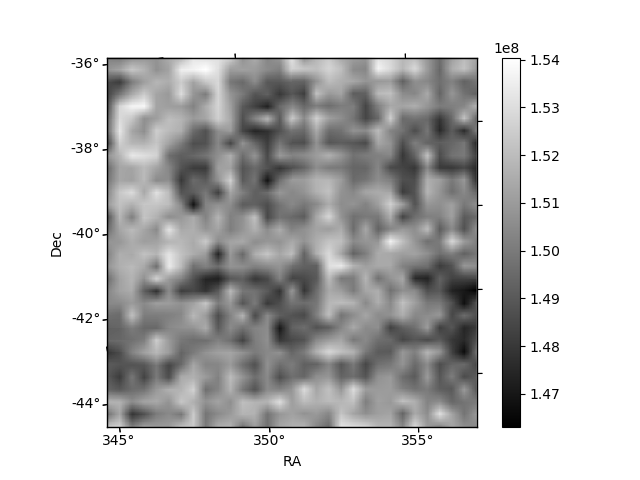
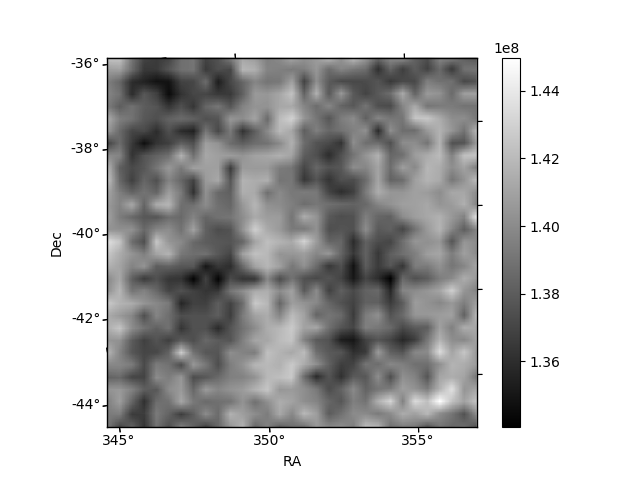
Histogram calculated using DETX and DETY for each event in the final _common_clean file
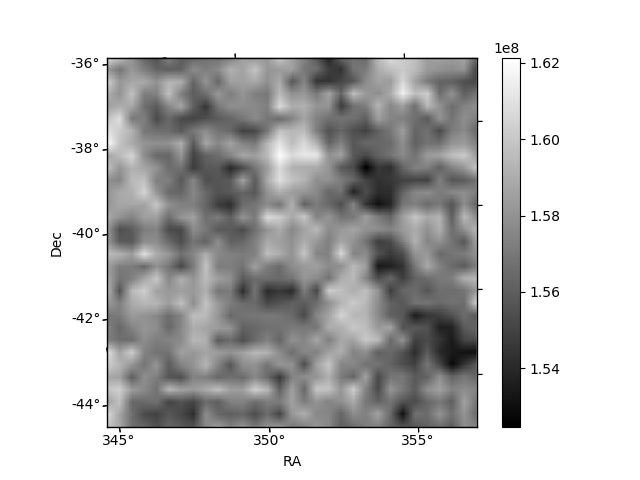
| Quadrant A | 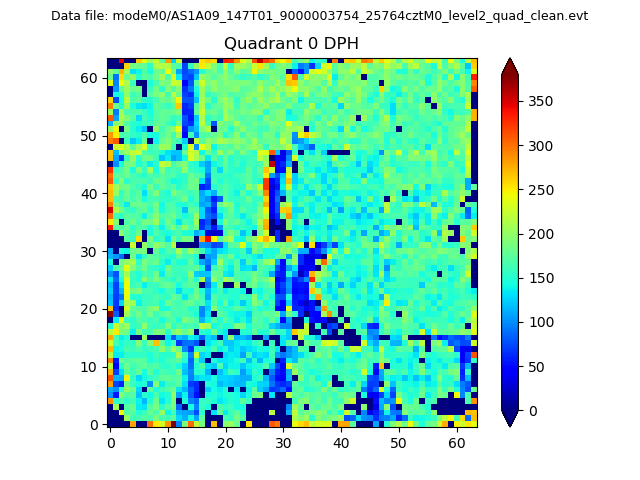 |
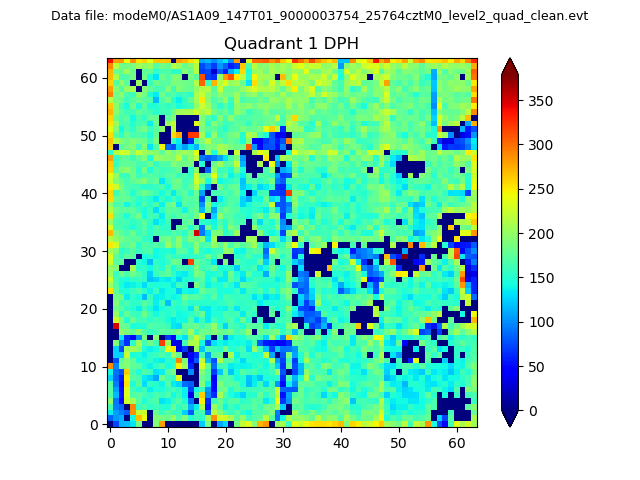 |
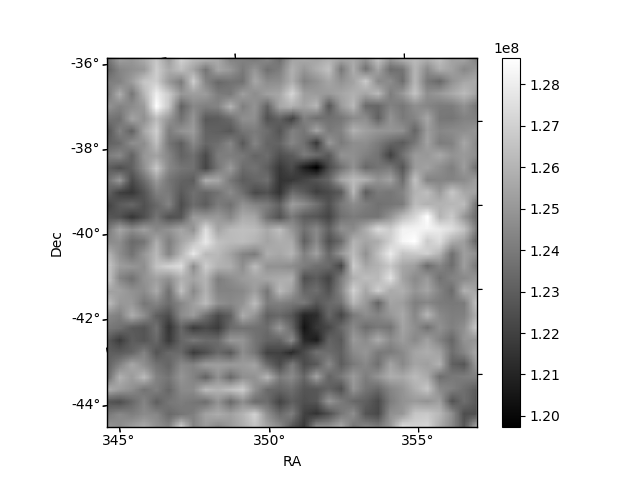
Quadrant B |
|---|---|---|---|
| Quadrant D | 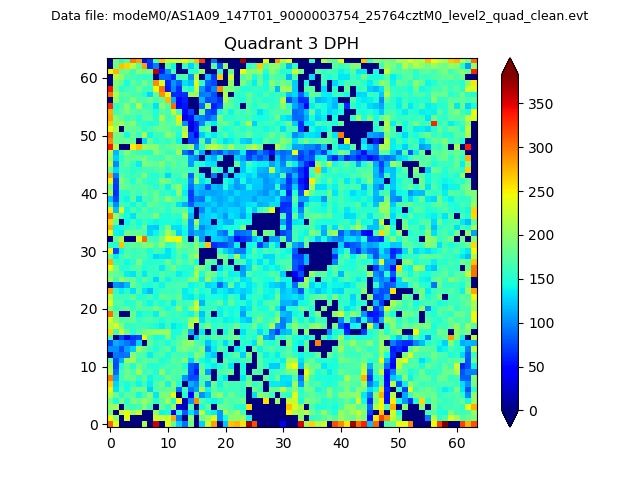 |
 |
Quadrant C |
| Plot type | Count rate plots | Images |
|---|---|---|
| Comparison with Poisson distribution Blue bars denote a histogram of data divided into 1 sec bins. Red curve is a Poisson curve with rate = median count rate of data. |
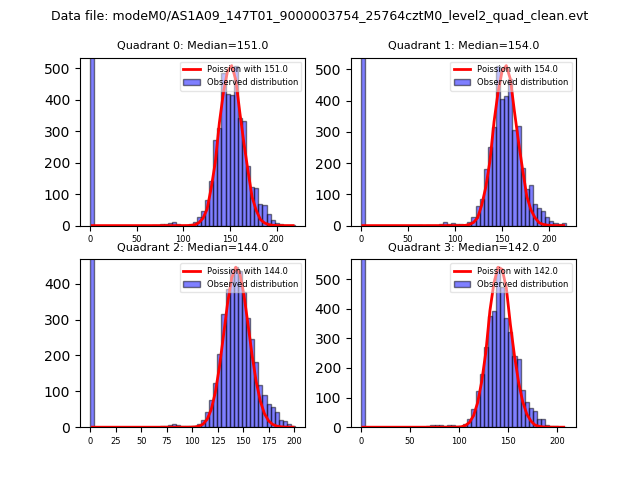 |
 |
| Quadrant-wise count rates Data is divided into 100 sec bins |
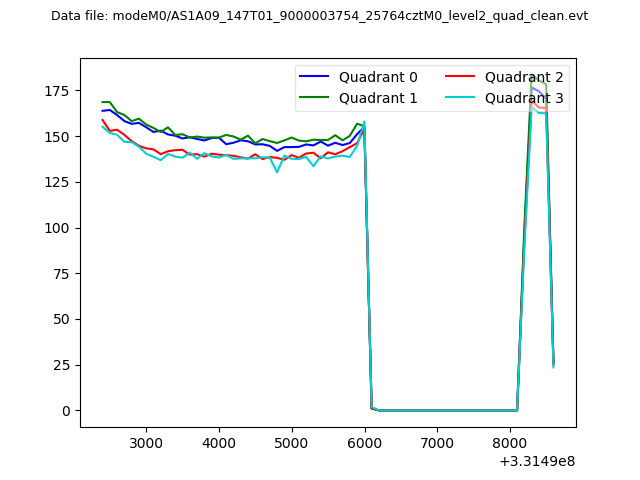 |
|
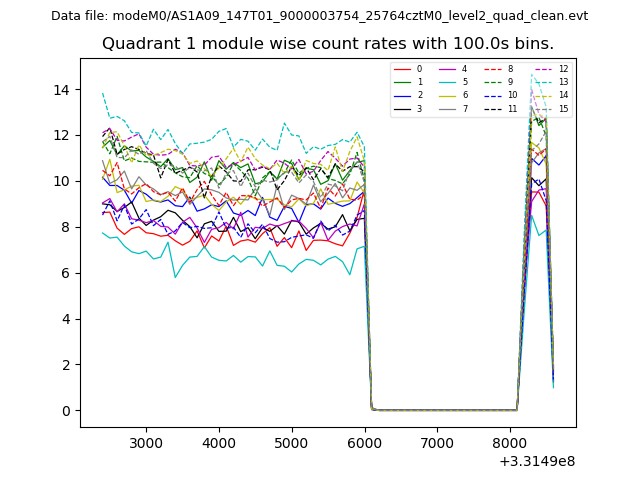
| Module-wise count rates for Quadrant A Data is divided into 100 sec bins |
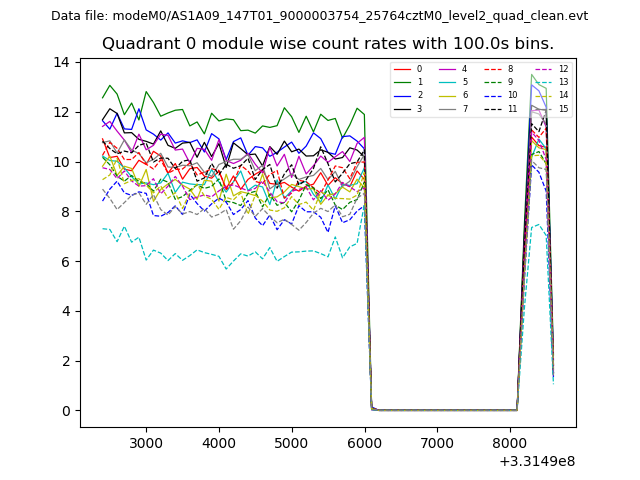 |
 |
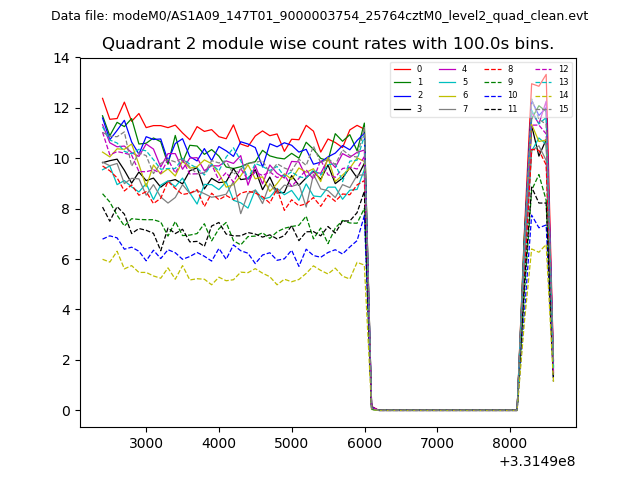
| Module-wise count rates for Quadrant B Data is divided into 100 sec bins |
 |
 |
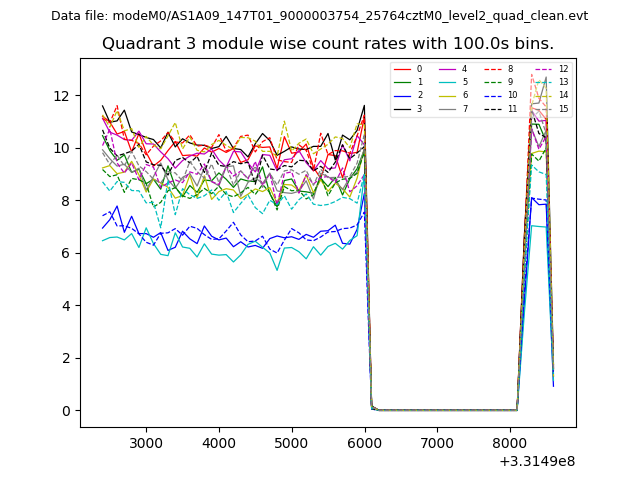
| Module-wise count rates for Quadrant C Data is divided into 100 sec bins |
 |
 |
| Module-wise count rates for Quadrant D Data is divided into 100 sec bins |
 |
 |
| Parameter | Plot |
|---|---|
| CZT HV Monitor | 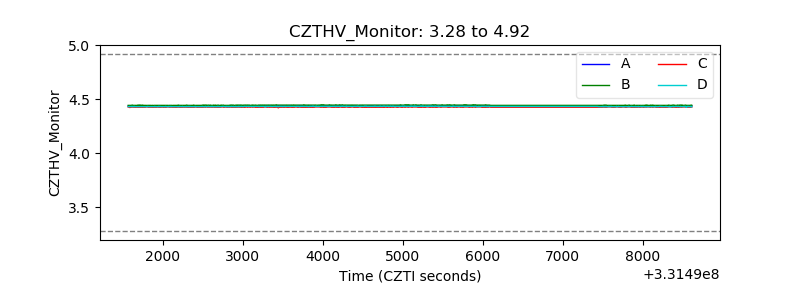 |
| D_VDD | 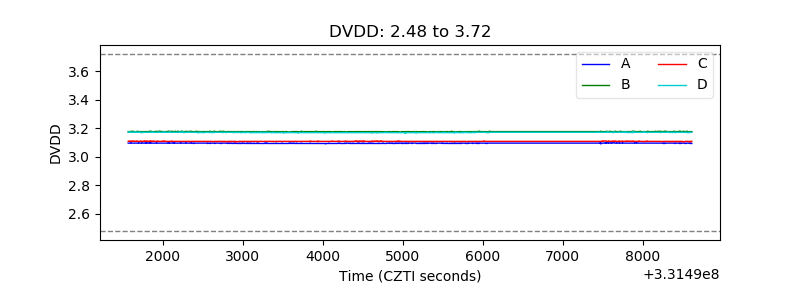 |
| Temperature 1 | 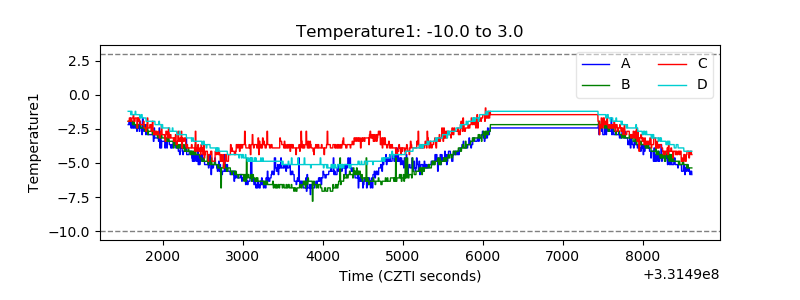 |
| Veto HV Monitor | 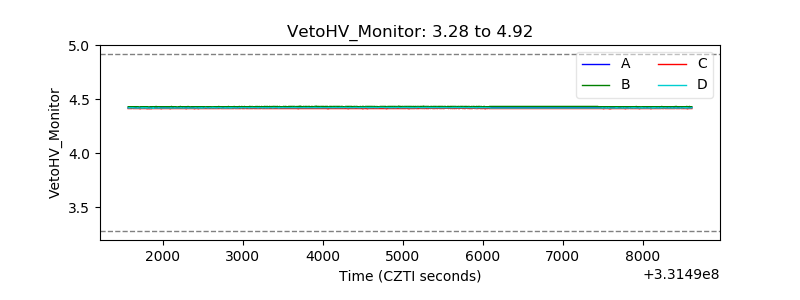 |
| Veto LLD | 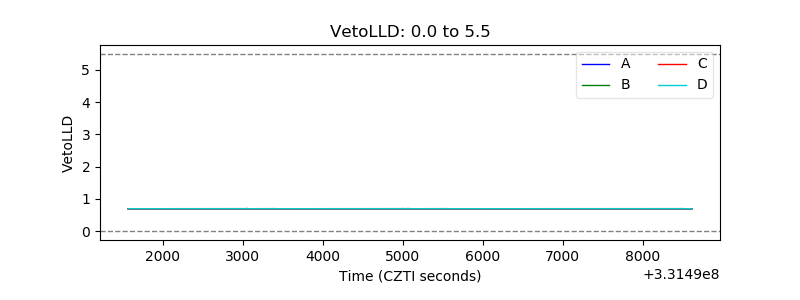 |
| Alpha Counter | 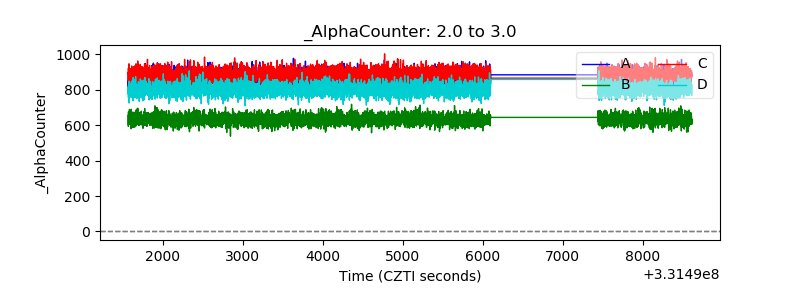 |
| _CPM_Rate | 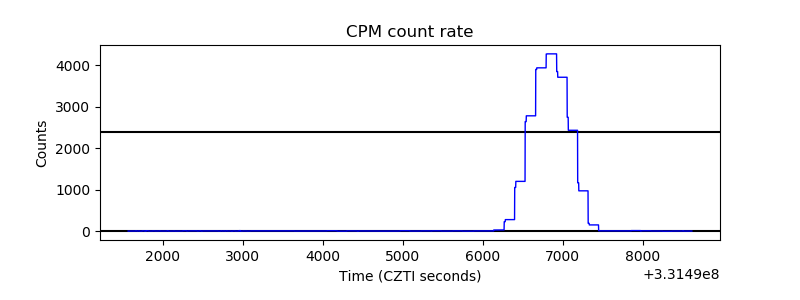 |
| CZT Counter | 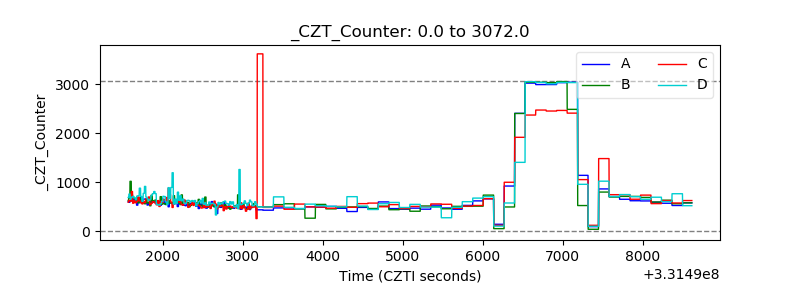 |
| +2.5 Volts monitor |  |
| +5 Volts monitor | 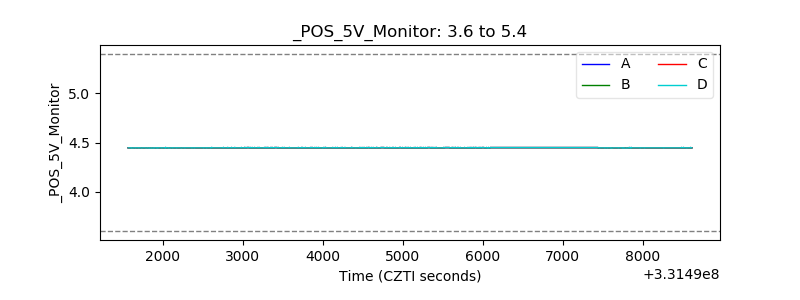 |
| _ROLL_ROT | 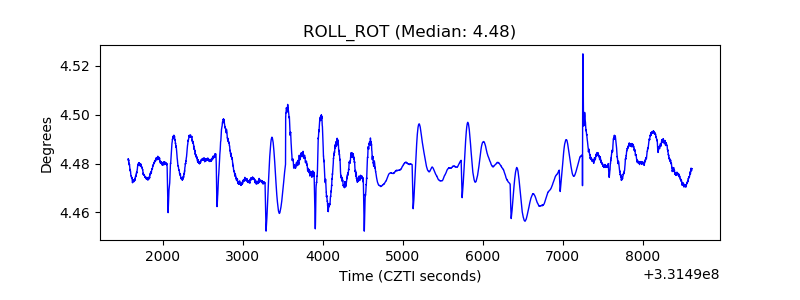 |
| _Roll_DEC |  |
| _Roll_RA | 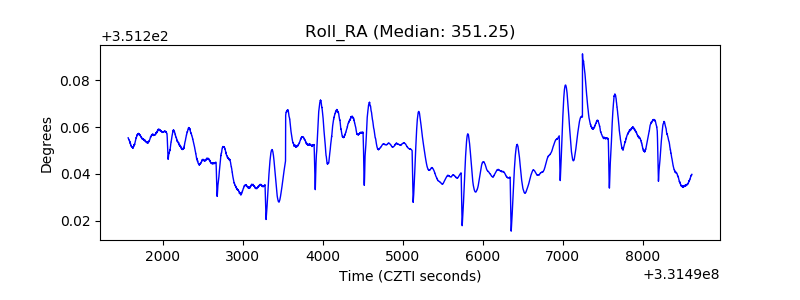 |
| Veto Counter | 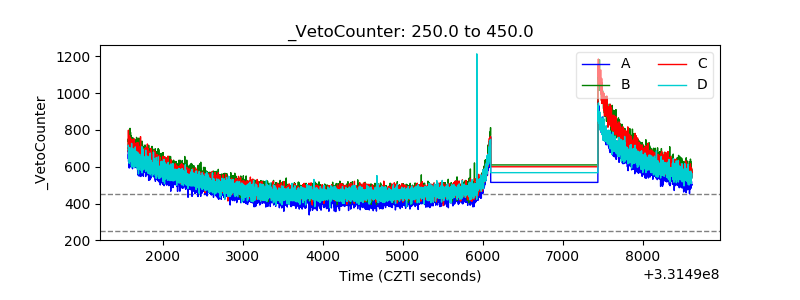 |