| Param | Original file | Final file |
|---|---|---|
| Filename | modeM0/AS1A09_147T01_9000003754_25765cztM0_level2.evt | modeM0/AS1A09_147T01_9000003754_25765cztM0_level2_quad_clean.evt |
| Size (bytes) | 525,087,360 | 108,129,600 |
| Size | 500.8 MB | 103.1 MB |
| Events in quadrant A | 3,303,121 | 735,282 |
| Events in quadrant B | 3,409,898 | 754,939 |
| Events in quadrant C | 3,414,015 | 705,899 |
| Events in quadrant D | 5,361,741 | 652,522 |
| Mode M9 | |||
|---|---|---|---|
| Quadrant | BADHDUFLAG | Total packets | Discarded packets |
| A | 0 | 14 | 0 |
| B | 0 | 15 | 0 |
| C | 0 | 15 | 0 |
| D | 0 | 15 | 0 |
| Mode M0 | |||
|---|---|---|---|
| Quadrant | BADHDUFLAG | Total packets | Discarded packets |
| A | 0 | 13643 | 0 |
| B | 0 | 13943 | 0 |
| C | 0 | 13846 | 0 |
| D | 0 | 20050 | 0 |
| Quadrant | Total seconds | Saturated seconds | Saturation percentage |
|---|---|---|---|
| A | 6103 | 71 | 1.163362% |
| B | 6103 | 105 | 1.720465% |
| C | 6102 | 119 | 1.950180% |
| D | 6102 | 655 | 10.734186% |
Noise dominated data is calculated using 1-second bins in cleaned event files. If a bin has >2000 counts, and if more than 50% of those come from <1% of pixels, then it is considered to be noise-dominated and hence unusable.
| Quadrant | # 1 sec bins | Bins with >0 counts | Bins with >2000 counts | High rate bins dominated by noise | Noise dominated (total time) | Noise dominated (detector-on time) | Marked lightcurve |
|---|---|---|---|---|---|---|---|
| A | 7498 | 6103 | 1 | 1 | 0.01% | 0.02% | 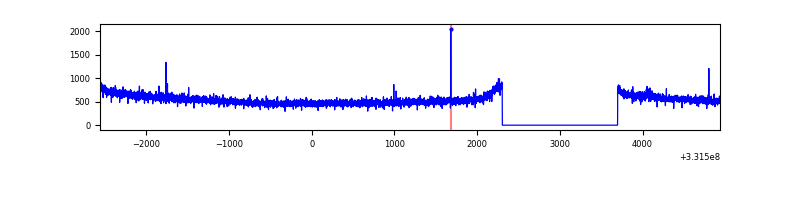 |
| B | 7498 | 6103 | 4 | 4 | 0.05% | 0.07% | 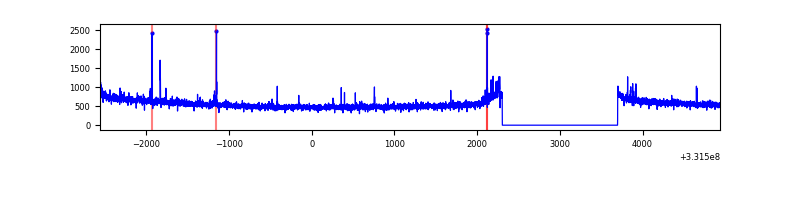 |
| C | 7497 | 6102 | 3 | 3 | 0.04% | 0.05% | 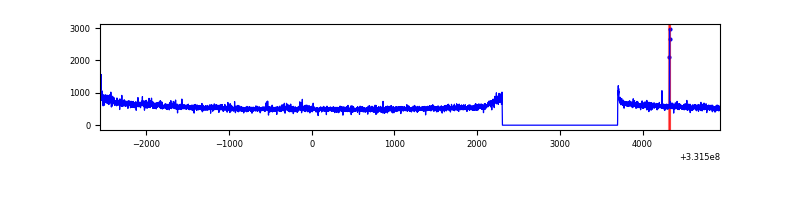 |
| D | 7497 | 6102 | 593 | 593 | 7.91% | 9.72% | 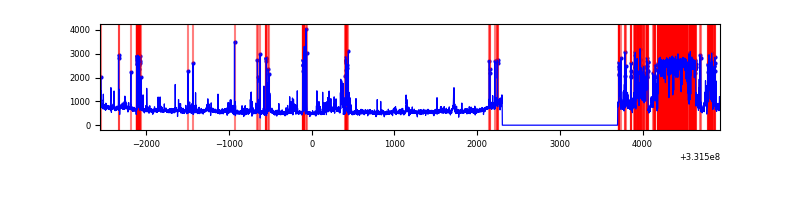 |
Top three noisy pixels from each quadrant. If the there are fewer than three noisy pixels in the level2.evt file, extra rows are filled as -1
| Pixel properties | Quadrant properties | ||||||
|---|---|---|---|---|---|---|---|
| Quadrant | DetID | PixID | Counts | Sigma | Mean | Median | Sigma |
| A | 13 | 254 | 10089 | 54.7 | 855 | 840 | 169.1 |
| A | 0 | 226 | 7304 | 38.23 | 855 | 840 | 169.1 |
| A | 3 | 137 | 7153 | 37.34 | 855 | 840 | 169.1 |
| B | 0 | 190 | 20928 | 127.99 | 855 | 838 | 157.0 |
| B | 12 | 111 | 17725 | 107.58 | 855 | 838 | 157.0 |
| B | 0 | 229 | 17153 | 103.94 | 855 | 838 | 157.0 |
| C | 14 | 238 | 134211 | 709.19 | 818 | 827 | 188.1 |
| C | 3 | 233 | 83041 | 437.13 | 818 | 827 | 188.1 |
| C | 15 | 127 | 8431 | 40.43 | 818 | 827 | 188.1 |
| D | 12 | 2 | 1378651 | 7368.13 | 784 | 768 | 187.0 |
| D | 8 | 195 | 314779 | 1679.15 | 784 | 768 | 187.0 |
| D | 7 | 80 | 308375 | 1644.91 | 784 | 768 | 187.0 |
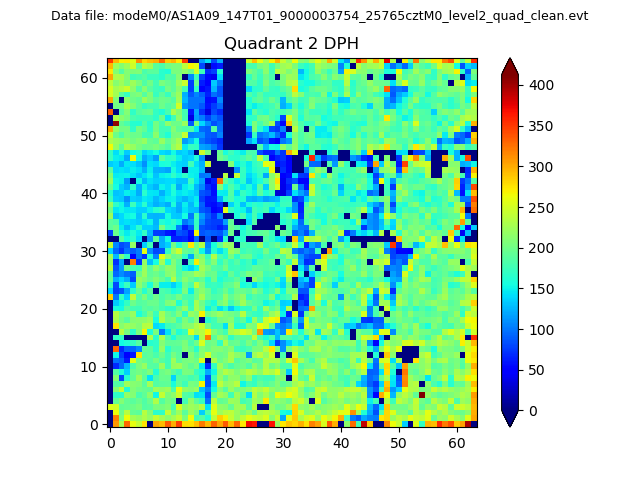
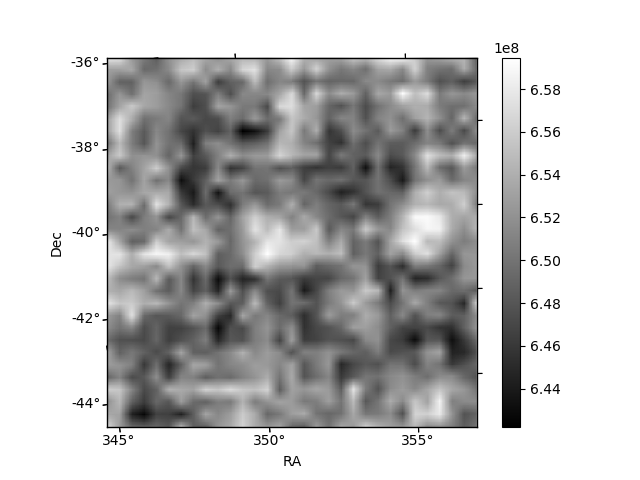
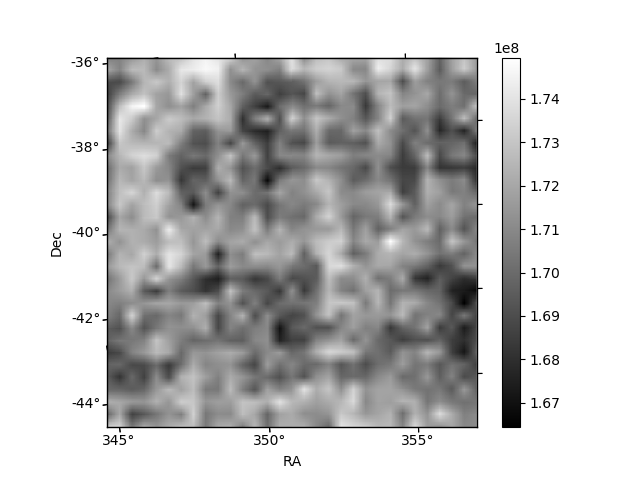
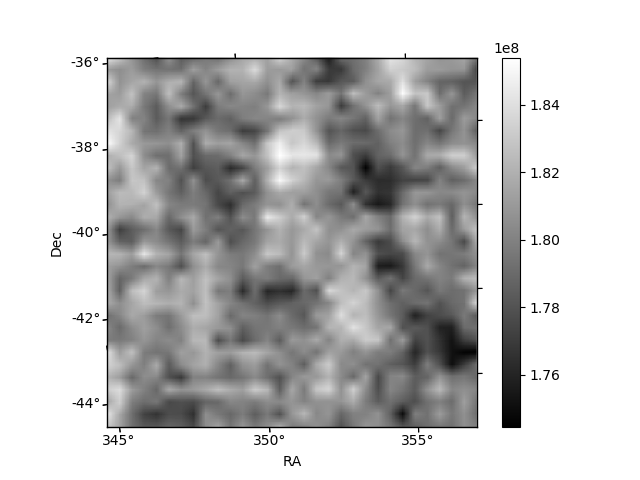
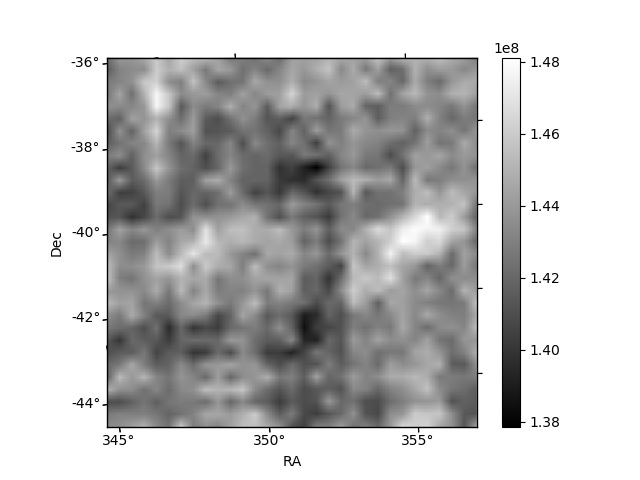
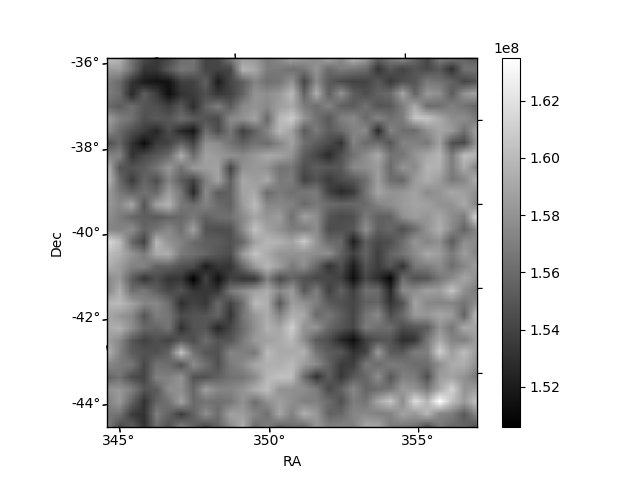
Histogram calculated using DETX and DETY for each event in the final _common_clean file
| Quadrant A | 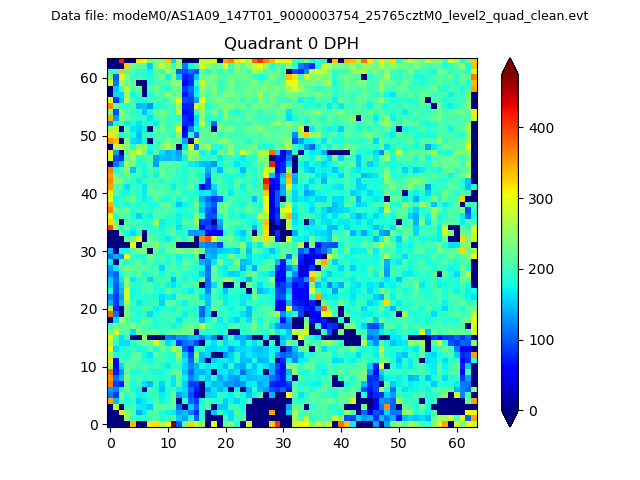 |
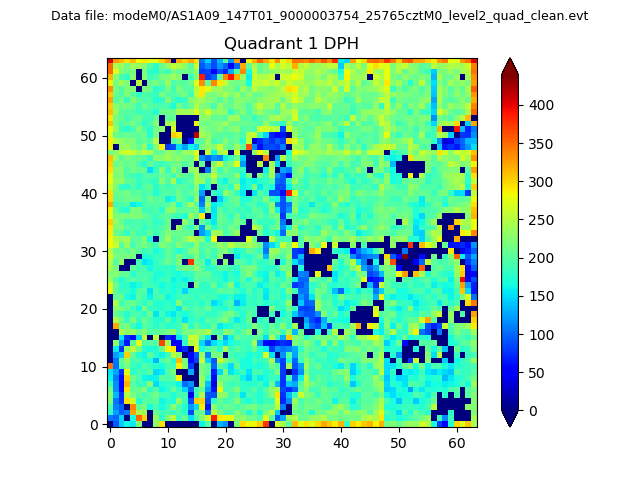 |
Quadrant B |
|---|---|---|---|
| Quadrant D | 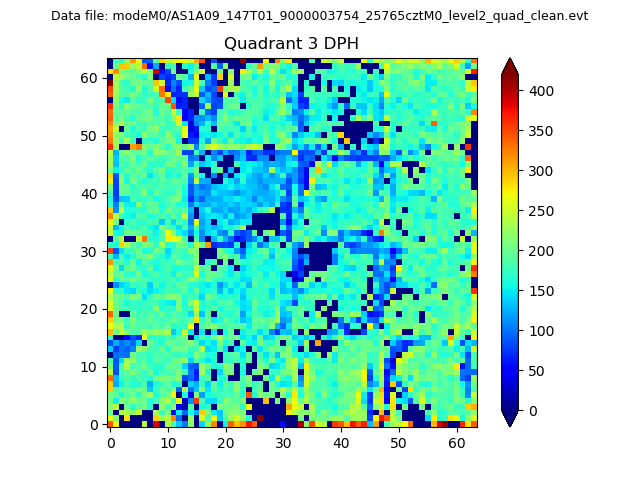 |
 |
Quadrant C |
| Plot type | Count rate plots | Images |
|---|---|---|
| Comparison with Poisson distribution Blue bars denote a histogram of data divided into 1 sec bins. Red curve is a Poisson curve with rate = median count rate of data. |
 |
 |
| Quadrant-wise count rates Data is divided into 100 sec bins |
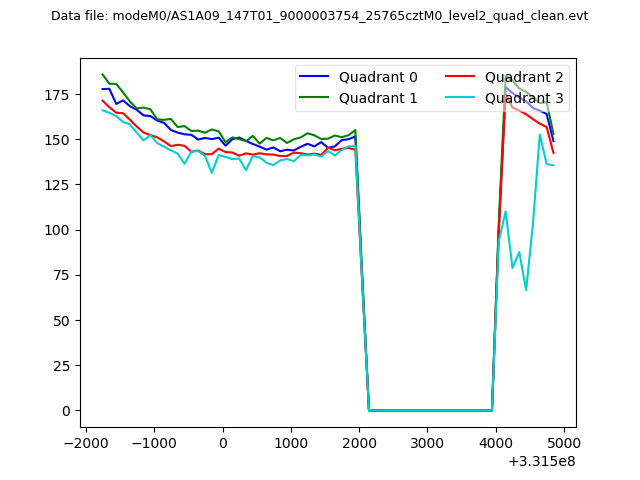 |
|
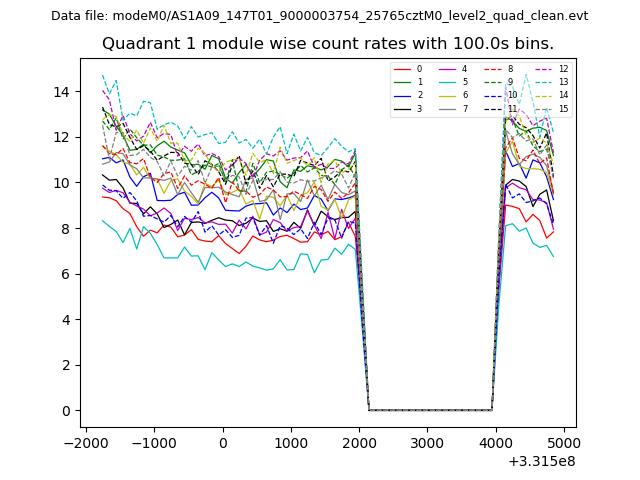
| Module-wise count rates for Quadrant A Data is divided into 100 sec bins |
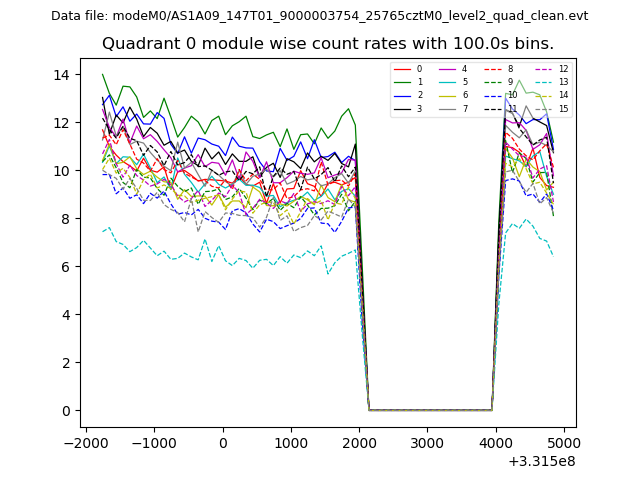 |
 |
| Module-wise count rates for Quadrant B Data is divided into 100 sec bins |
 |
 |
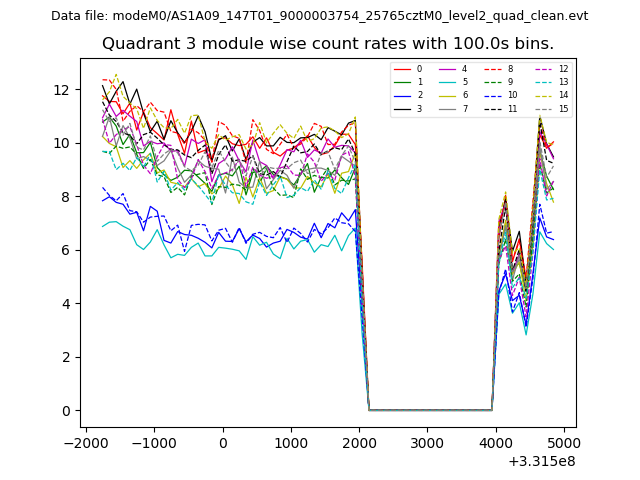
| Module-wise count rates for Quadrant C Data is divided into 100 sec bins |
 |
 |
| Module-wise count rates for Quadrant D Data is divided into 100 sec bins |
 |
 |
| Parameter | Plot |
|---|---|
| CZT HV Monitor | 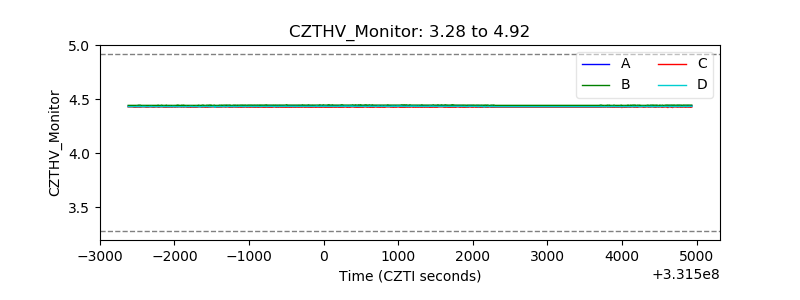 |
| D_VDD | 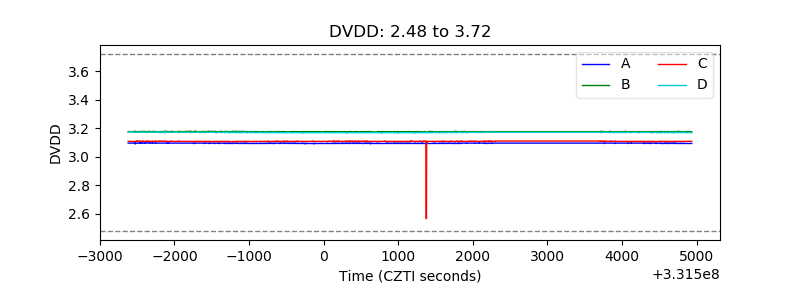 |
| Temperature 1 | 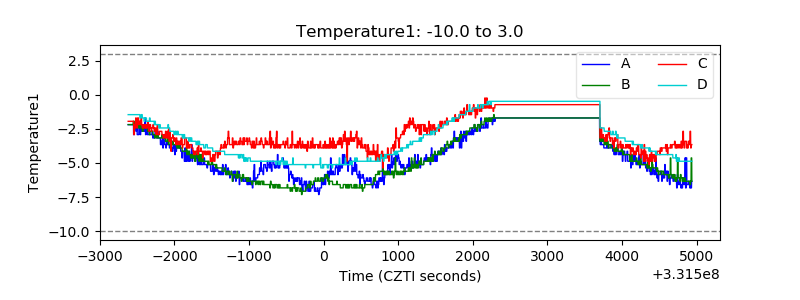 |
| Veto HV Monitor | 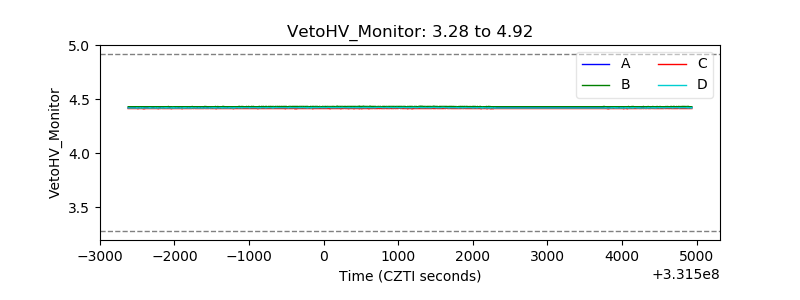 |
| Veto LLD |  |
| Alpha Counter | 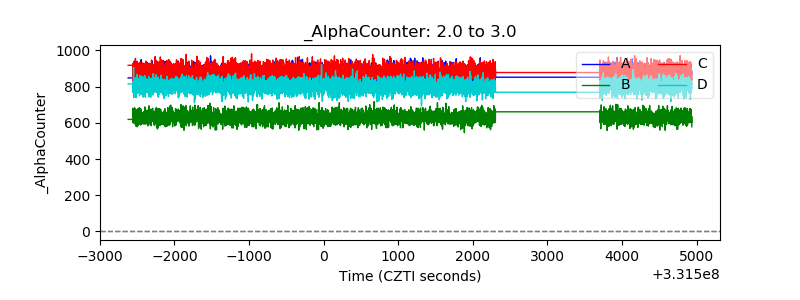 |
| _CPM_Rate | 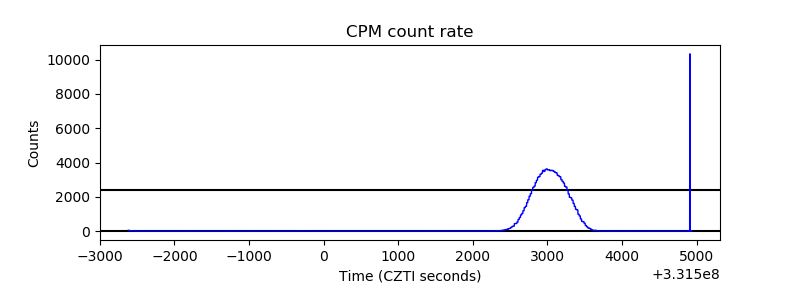 |
| CZT Counter | 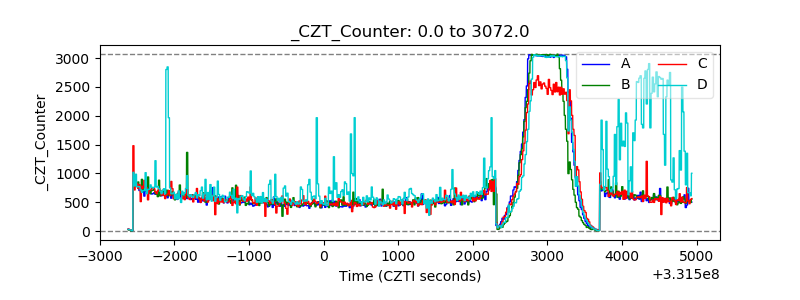 |
| +2.5 Volts monitor |  |
| +5 Volts monitor |  |
| _ROLL_ROT | 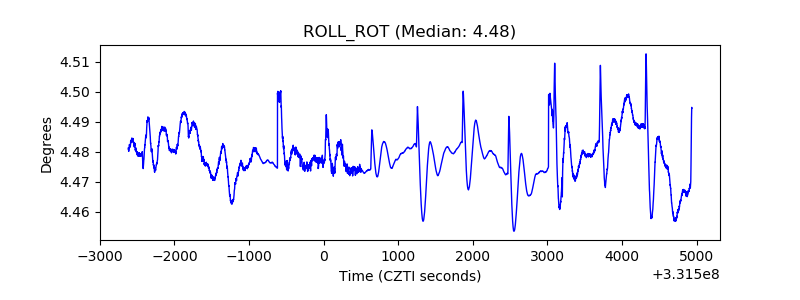 |
| _Roll_DEC | 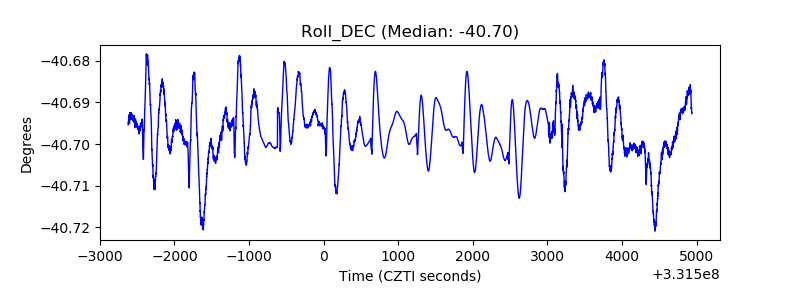 |
| _Roll_RA | 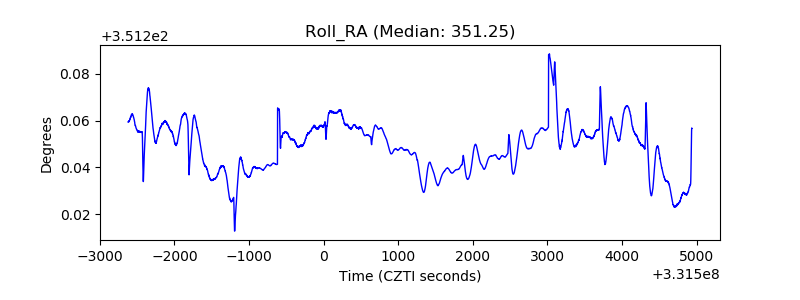 |
| Veto Counter | 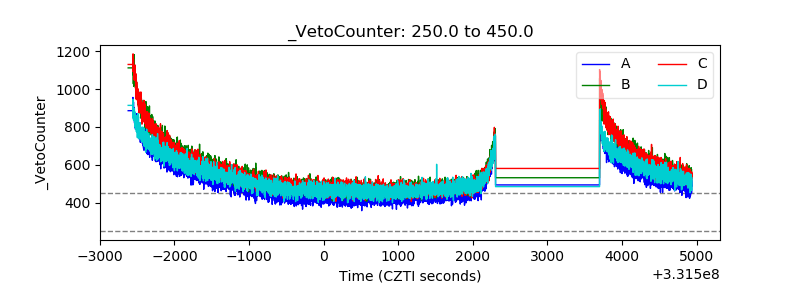 |