| Param | Original file | Final file |
|---|---|---|
| Filename | modeM0/AS1A09_147T01_9000003754_25766cztM0_level2.evt | modeM0/AS1A09_147T01_9000003754_25766cztM0_level2_quad_clean.evt |
| Size (bytes) | 708,249,600 | 106,974,720 |
| Size | 675.4 MB | 102.0 MB |
| Events in quadrant A | 3,193,942 | 778,586 |
| Events in quadrant B | 3,332,310 | 801,909 |
| Events in quadrant C | 3,309,799 | 759,093 |
| Events in quadrant D | 11,197,993 | 470,498 |
| Mode M9 | |||
|---|---|---|---|
| Quadrant | BADHDUFLAG | Total packets | Discarded packets |
| A | 0 | 28 | 0 |
| B | 0 | 28 | 0 |
| C | 0 | 28 | 0 |
| D | 0 | 28 | 0 |
| Mode M0 | |||
|---|---|---|---|
| Quadrant | BADHDUFLAG | Total packets | Discarded packets |
| A | 0 | 13241 | 0 |
| B | 0 | 13642 | 0 |
| C | 0 | 13451 | 0 |
| D | 0 | 37564 | 0 |
| Quadrant | Total seconds | Saturated seconds | Saturation percentage |
|---|---|---|---|
| A | 6137 | 86 | 1.401336% |
| B | 6138 | 124 | 2.020202% |
| C | 6138 | 127 | 2.069078% |
| D | 6137 | 3390 | 55.238716% |
Noise dominated data is calculated using 1-second bins in cleaned event files. If a bin has >2000 counts, and if more than 50% of those come from <1% of pixels, then it is considered to be noise-dominated and hence unusable.
| Quadrant | # 1 sec bins | Bins with >0 counts | Bins with >2000 counts | High rate bins dominated by noise | Noise dominated (total time) | Noise dominated (detector-on time) | Marked lightcurve |
|---|---|---|---|---|---|---|---|
| A | 8907 | 6138 | 0 | 0 | 0.00% | 0.00% | 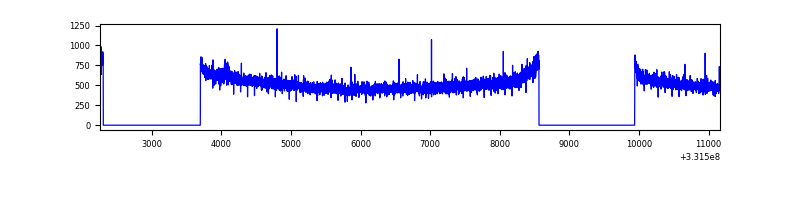 |
| B | 8908 | 6139 | 1 | 1 | 0.01% | 0.02% | 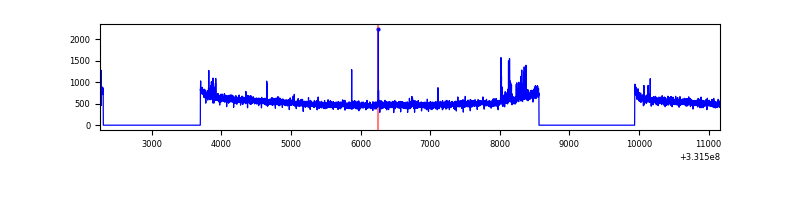 |
| C | 8908 | 6139 | 3 | 3 | 0.03% | 0.05% | 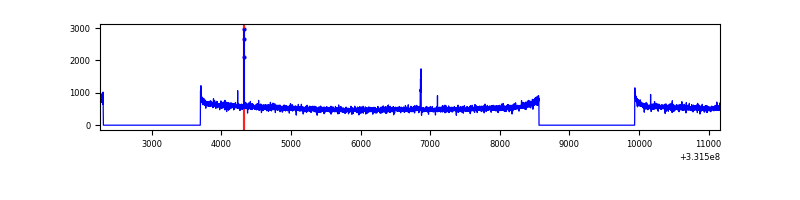 |
| D | 8907 | 6137 | 3279 | 3279 | 36.81% | 53.43% | 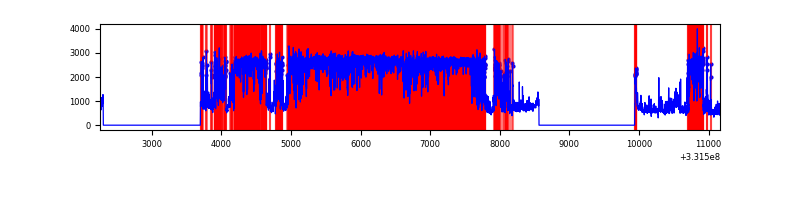 |
Top three noisy pixels from each quadrant. If the there are fewer than three noisy pixels in the level2.evt file, extra rows are filled as -1
| Pixel properties | Quadrant properties | ||||||
|---|---|---|---|---|---|---|---|
| Quadrant | DetID | PixID | Counts | Sigma | Mean | Median | Sigma |
| A | 13 | 254 | 9763 | 54.31 | 827 | 812 | 164.8 |
| A | 0 | 226 | 7047 | 37.83 | 827 | 812 | 164.8 |
| A | 3 | 137 | 6990 | 37.49 | 827 | 812 | 164.8 |
| B | 0 | 190 | 61311 | 391.0 | 830 | 812 | 154.7 |
| B | 12 | 111 | 17724 | 109.3 | 830 | 812 | 154.7 |
| B | 11 | 111 | 16038 | 98.4 | 830 | 812 | 154.7 |
| C | 14 | 238 | 131828 | 702.76 | 803 | 808 | 186.4 |
| C | 3 | 233 | 32290 | 168.86 | 803 | 808 | 186.4 |
| C | 15 | 127 | 20605 | 106.19 | 803 | 808 | 186.4 |
| D | 12 | 2 | 7232379 | 50597.63 | 602 | 588 | 142.9 |
| D | 1 | 52 | 761817 | 5325.98 | 602 | 588 | 142.9 |
| D | 7 | 80 | 495496 | 3462.65 | 602 | 588 | 142.9 |
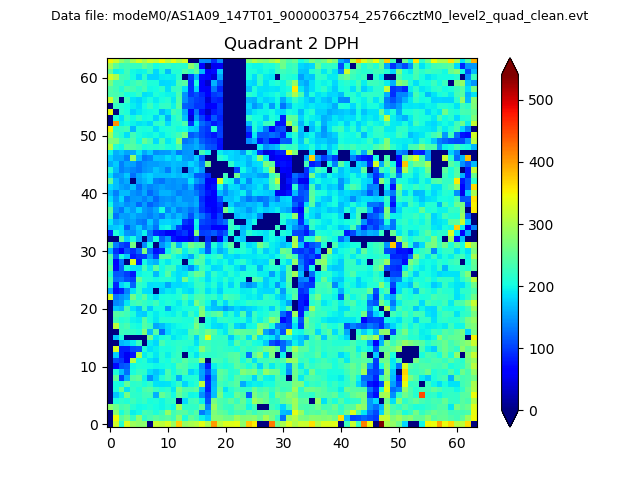
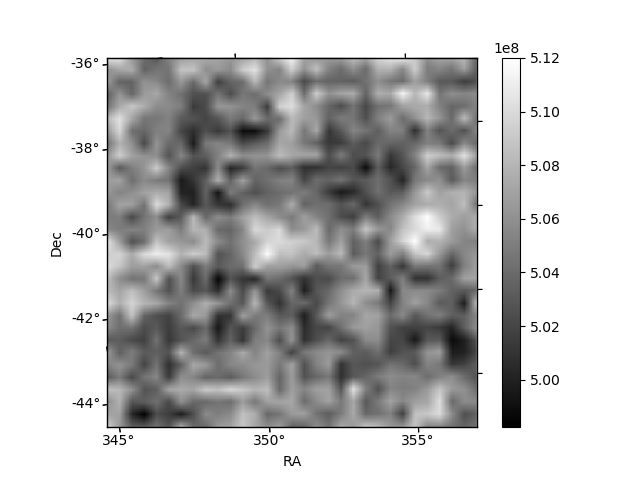
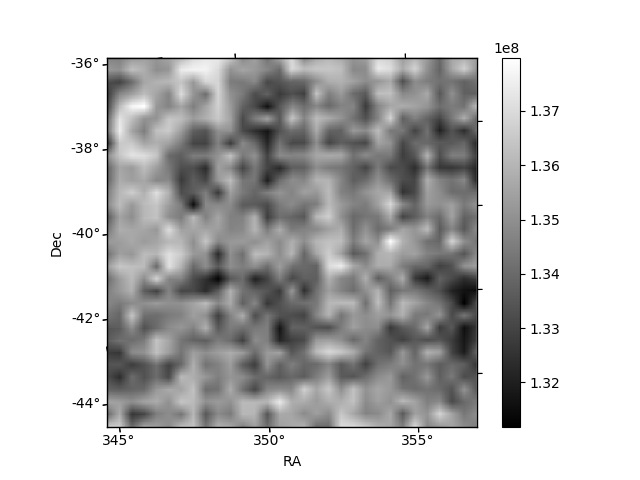
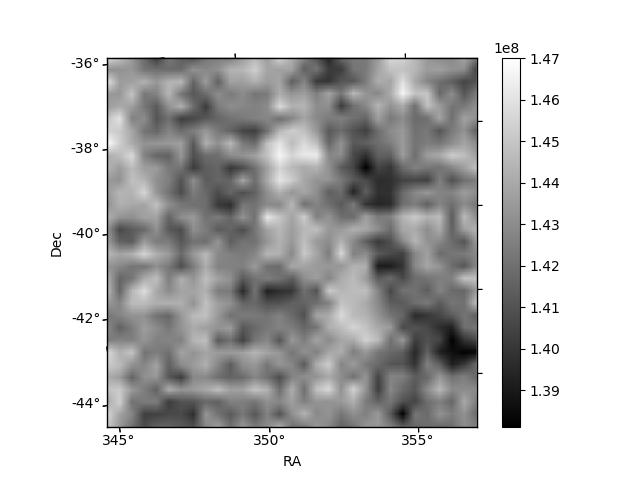
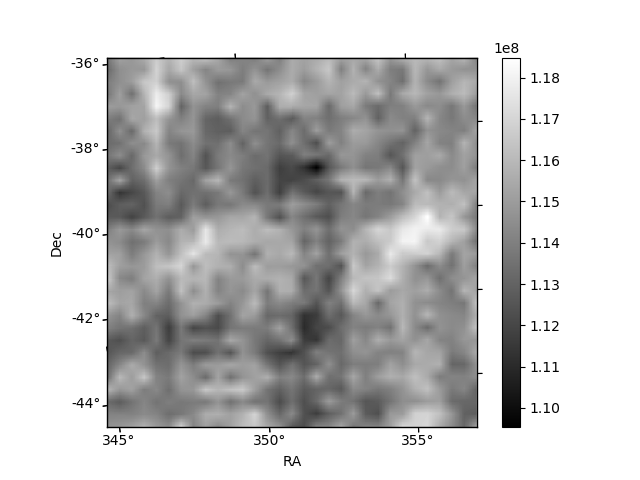
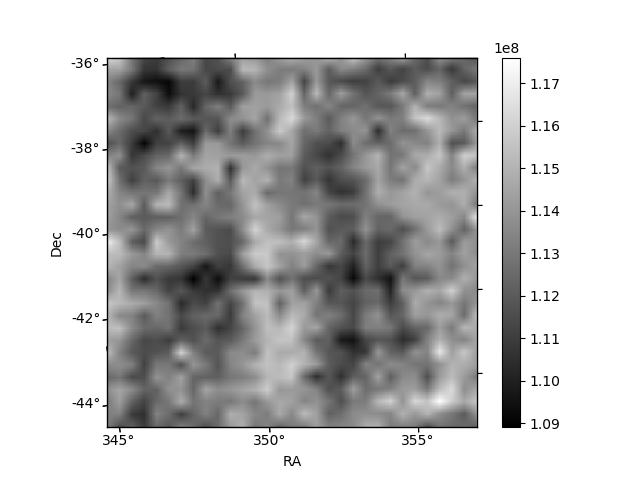
Histogram calculated using DETX and DETY for each event in the final _common_clean file
| Quadrant A | 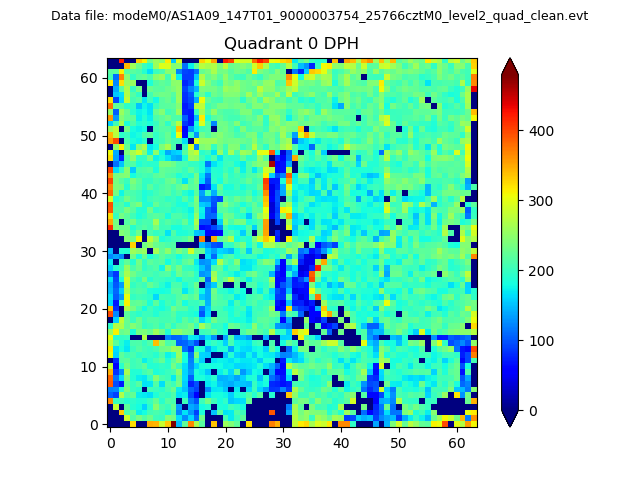 |
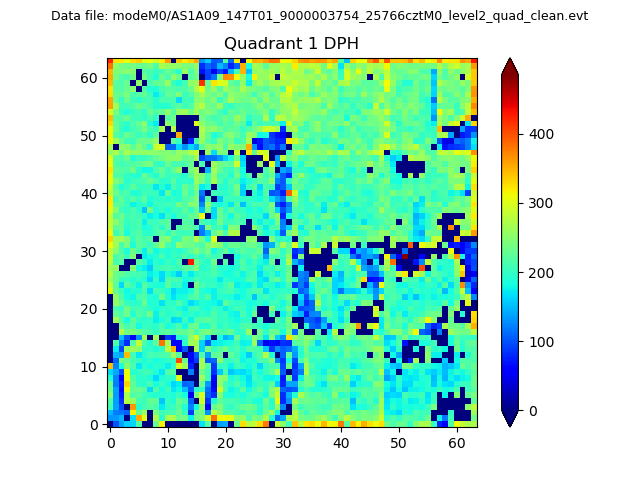 |
Quadrant B |
|---|---|---|---|
| Quadrant D | 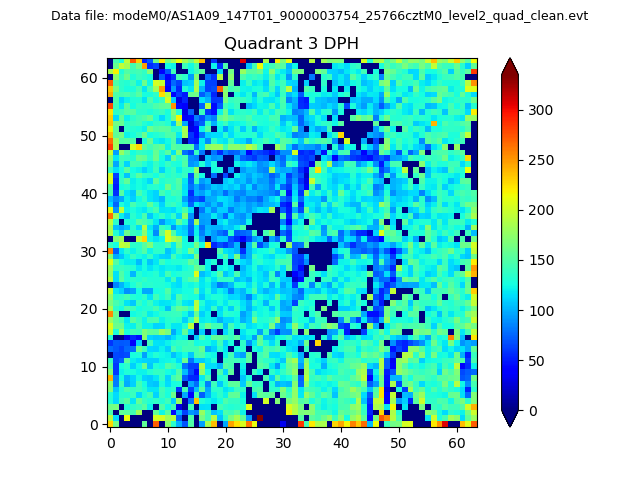 |
 |
Quadrant C |
| Plot type | Count rate plots | Images |
|---|---|---|
| Comparison with Poisson distribution Blue bars denote a histogram of data divided into 1 sec bins. Red curve is a Poisson curve with rate = median count rate of data. |
 |
 |
| Quadrant-wise count rates Data is divided into 100 sec bins |
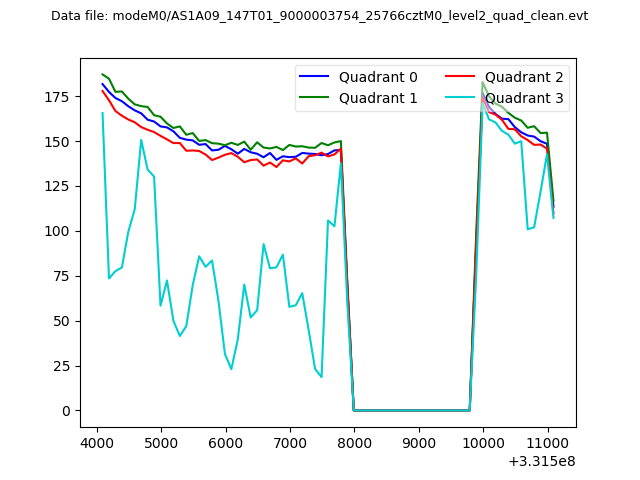 |
|
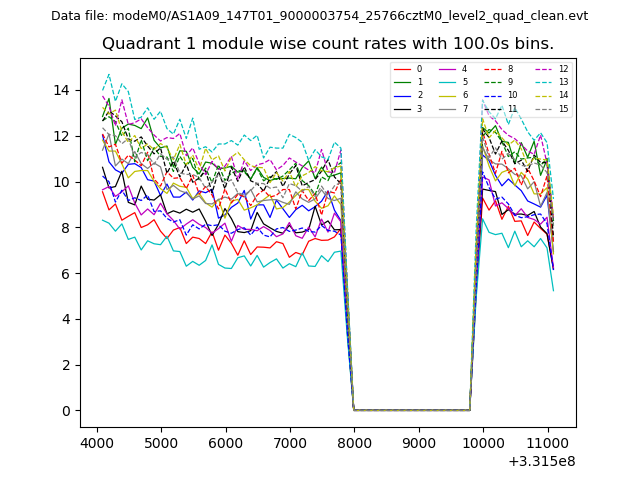
| Module-wise count rates for Quadrant A Data is divided into 100 sec bins |
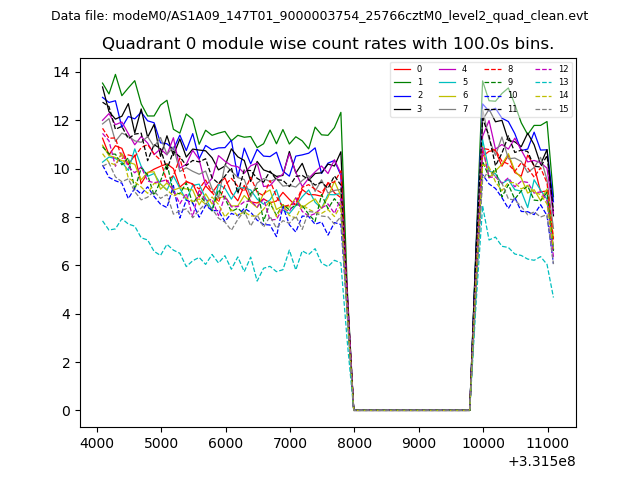 |
 |
| Module-wise count rates for Quadrant B Data is divided into 100 sec bins |
 |
 |
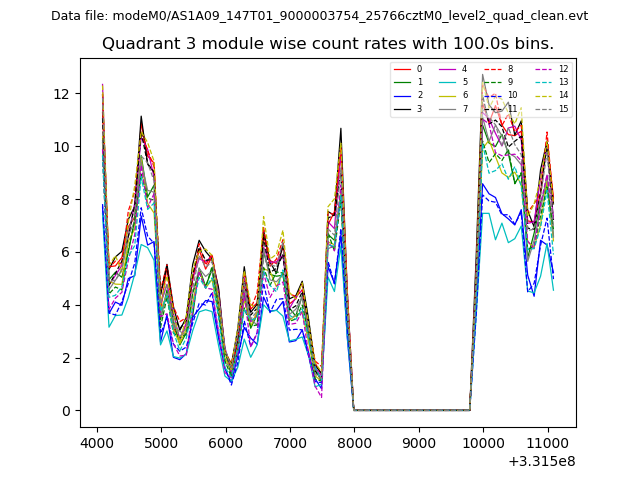
| Module-wise count rates for Quadrant C Data is divided into 100 sec bins |
 |
 |
| Module-wise count rates for Quadrant D Data is divided into 100 sec bins |
 |
 |
| Parameter | Plot |
|---|---|
| CZT HV Monitor |  |
| D_VDD | 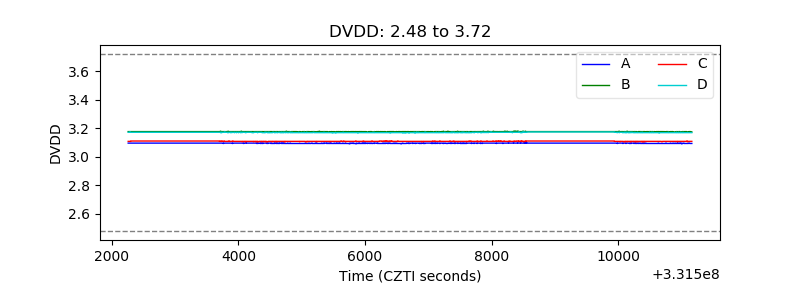 |
| Temperature 1 | 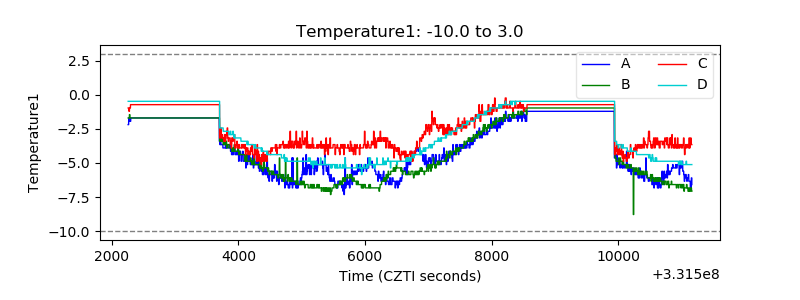 |
| Veto HV Monitor | 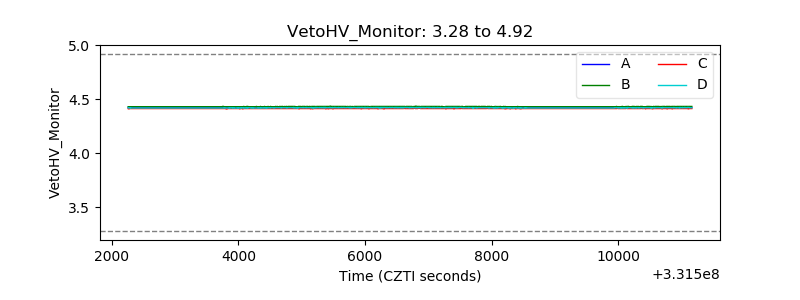 |
| Veto LLD | 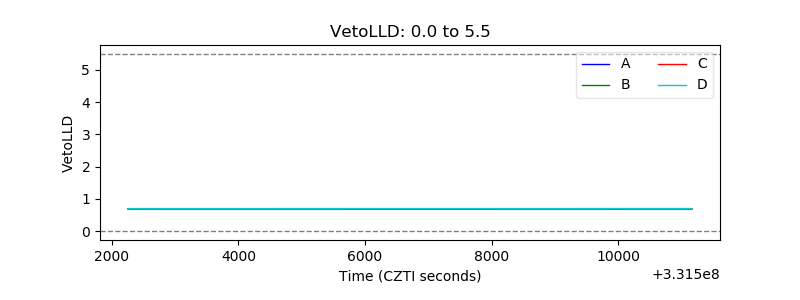 |
| Alpha Counter |  |
| _CPM_Rate | 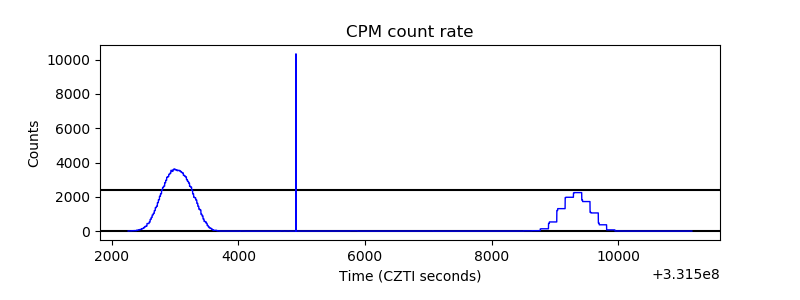 |
| CZT Counter | 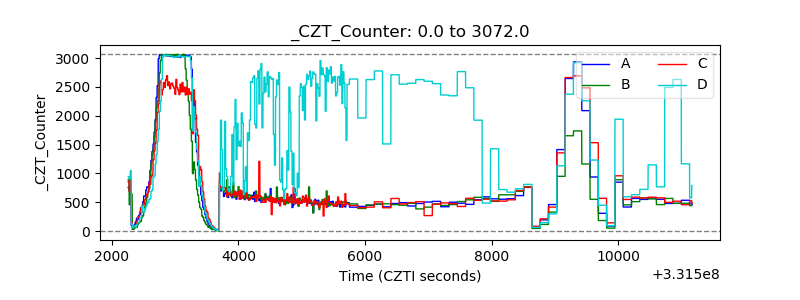 |
| +2.5 Volts monitor |  |
| +5 Volts monitor |  |
| _ROLL_ROT |  |
| _Roll_DEC | 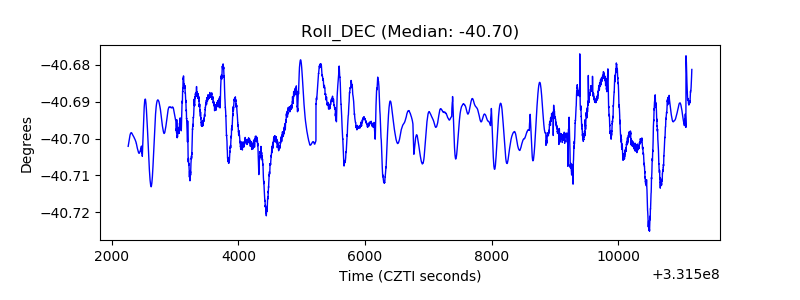 |
| _Roll_RA | 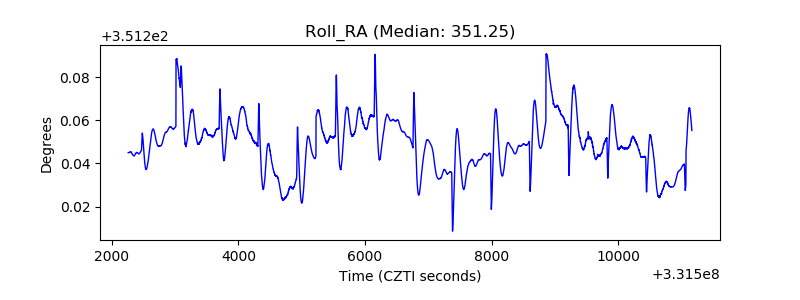 |
| Veto Counter |  |