| Param | Original file | Final file |
|---|---|---|
| Filename | modeM0/AS1A09_147T01_9000003754_25767cztM0_level2.evt | modeM0/AS1A09_147T01_9000003754_25767cztM0_level2_quad_clean.evt |
| Size (bytes) | 502,718,400 | 112,360,320 |
| Size | 479.4 MB | 107.2 MB |
| Events in quadrant A | 3,163,412 | 748,230 |
| Events in quadrant B | 3,297,775 | 770,255 |
| Events in quadrant C | 3,313,511 | 736,123 |
| Events in quadrant D | 5,015,807 | 701,784 |
| Mode M9 | |||
|---|---|---|---|
| Quadrant | BADHDUFLAG | Total packets | Discarded packets |
| A | 0 | 25 | 0 |
| B | 0 | 25 | 0 |
| C | 0 | 25 | 0 |
| D | 0 | 25 | 0 |
| Mode M0 | |||
|---|---|---|---|
| Quadrant | BADHDUFLAG | Total packets | Discarded packets |
| A | 0 | 13402 | 0 |
| B | 0 | 13721 | 0 |
| C | 0 | 13614 | 0 |
| D | 0 | 19341 | 0 |
| Quadrant | Total seconds | Saturated seconds | Saturation percentage |
|---|---|---|---|
| A | 6401 | 49 | 0.765505% |
| B | 6402 | 101 | 1.577632% |
| C | 6402 | 104 | 1.624492% |
| D | 6402 | 302 | 4.717276% |
Noise dominated data is calculated using 1-second bins in cleaned event files. If a bin has >2000 counts, and if more than 50% of those come from <1% of pixels, then it is considered to be noise-dominated and hence unusable.
| Quadrant | # 1 sec bins | Bins with >0 counts | Bins with >2000 counts | High rate bins dominated by noise | Noise dominated (total time) | Noise dominated (detector-on time) | Marked lightcurve |
|---|---|---|---|---|---|---|---|
| A | 8921 | 6404 | 0 | 0 | 0.00% | 0.00% | 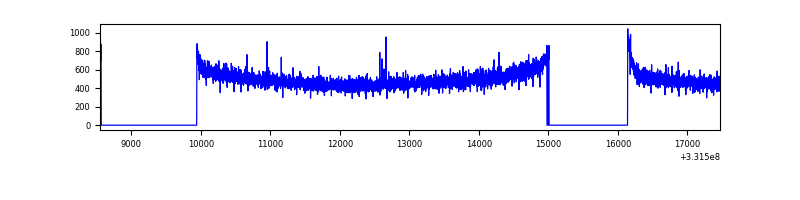 |
| B | 8922 | 6404 | 5 | 5 | 0.06% | 0.08% | 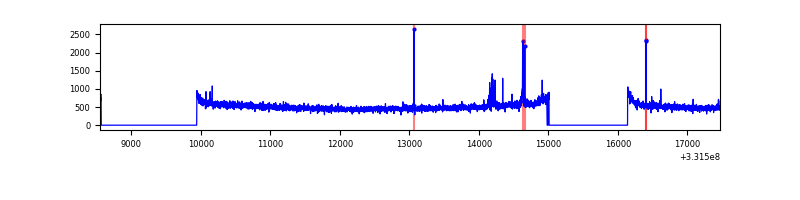 |
| C | 8922 | 6404 | 0 | 0 | 0.00% | 0.00% | 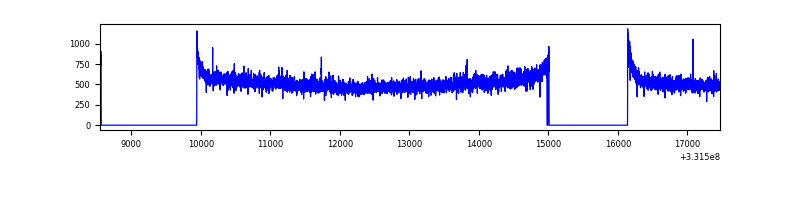 |
| D | 8922 | 6404 | 225 | 225 | 2.52% | 3.51% | 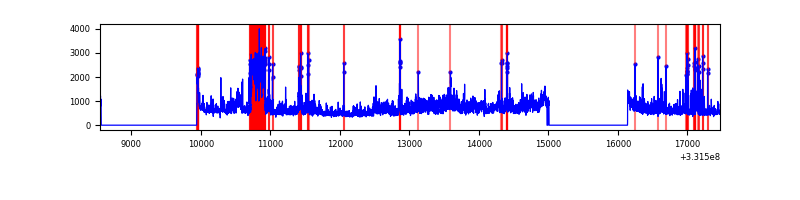 |
Top three noisy pixels from each quadrant. If the there are fewer than three noisy pixels in the level2.evt file, extra rows are filled as -1
| Pixel properties | Quadrant properties | ||||||
|---|---|---|---|---|---|---|---|
| Quadrant | DetID | PixID | Counts | Sigma | Mean | Median | Sigma |
| A | 13 | 254 | 9249 | 51.48 | 821 | 803 | 164.1 |
| A | 3 | 137 | 7313 | 39.68 | 821 | 803 | 164.1 |
| A | 0 | 226 | 6824 | 36.7 | 821 | 803 | 164.1 |
| B | 10 | 247 | 27184 | 171.81 | 824 | 804 | 153.5 |
| B | 0 | 190 | 21466 | 134.57 | 824 | 804 | 153.5 |
| B | 12 | 111 | 18525 | 115.41 | 824 | 804 | 153.5 |
| C | 14 | 238 | 130044 | 687.24 | 805 | 811 | 188.0 |
| C | 3 | 233 | 47313 | 247.29 | 805 | 811 | 188.0 |
| C | 13 | 61 | 5450 | 24.67 | 805 | 811 | 188.0 |
| D | 8 | 195 | 1038054 | 5537.2 | 792 | 774 | 187.3 |
| D | 7 | 80 | 586195 | 3125.09 | 792 | 774 | 187.3 |
| D | 13 | 104 | 139563 | 740.88 | 792 | 774 | 187.3 |
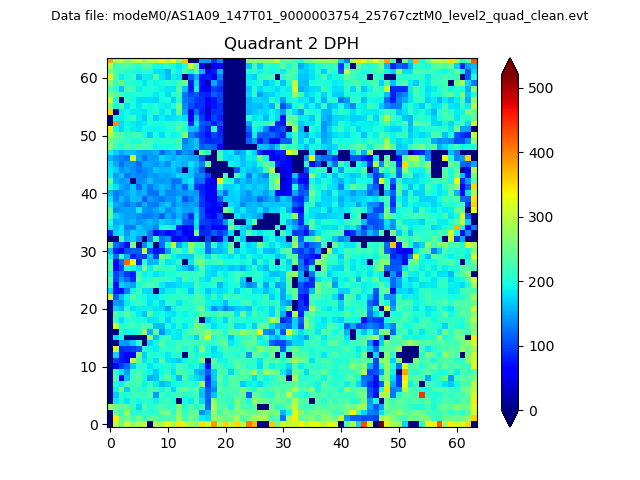
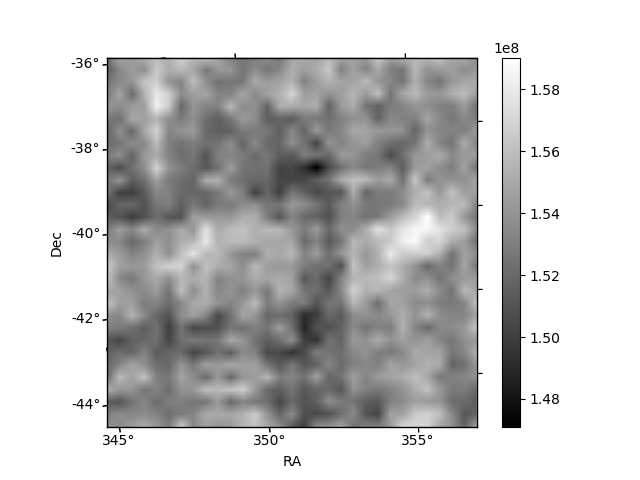
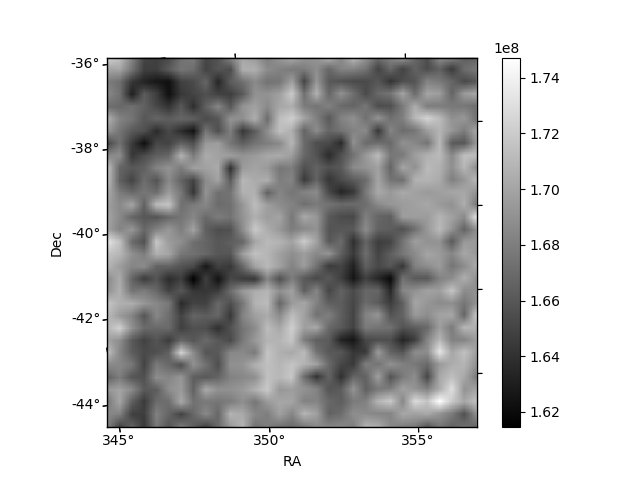
Histogram calculated using DETX and DETY for each event in the final _common_clean file
| Quadrant A | 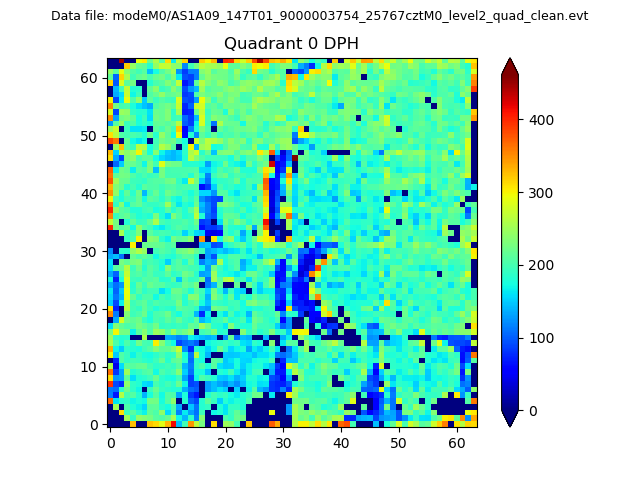 |
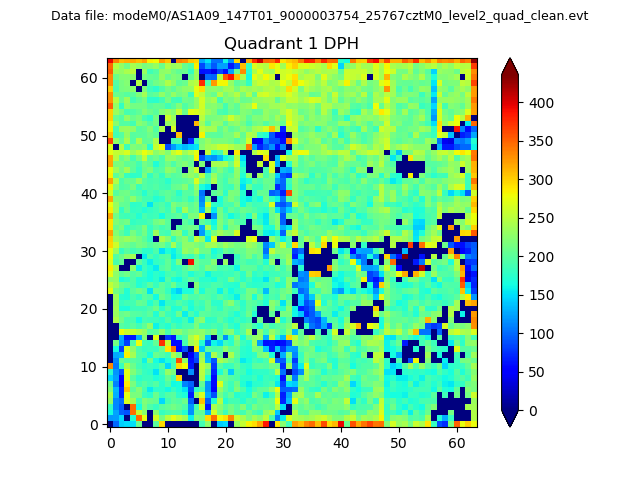 |
Quadrant B |
|---|---|---|---|
| Quadrant D | 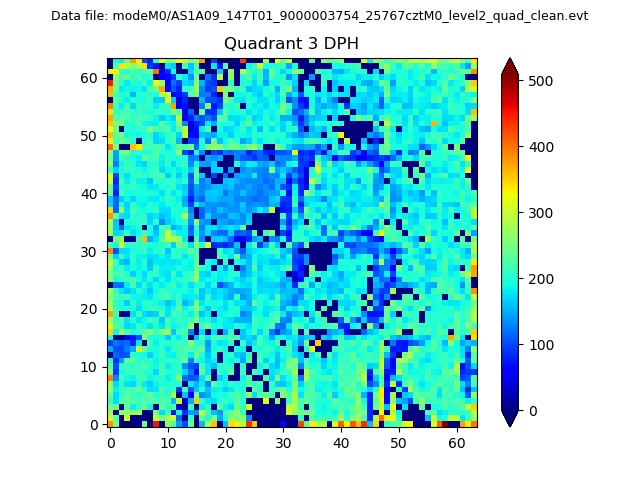 |
 |
Quadrant C |
| Plot type | Count rate plots | Images |
|---|---|---|
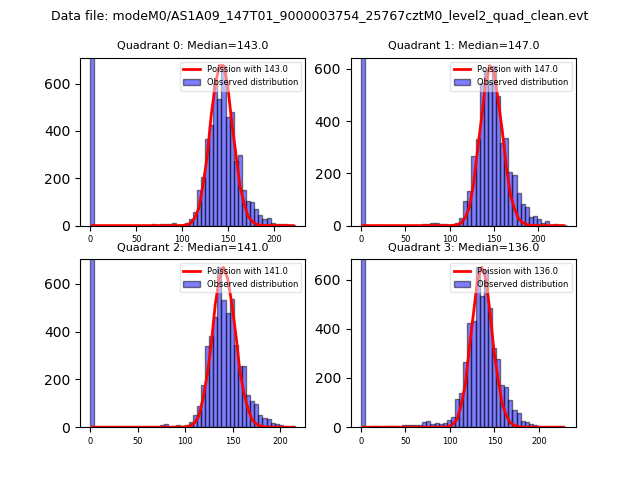
| Comparison with Poisson distribution Blue bars denote a histogram of data divided into 1 sec bins. Red curve is a Poisson curve with rate = median count rate of data. |
 |
 |
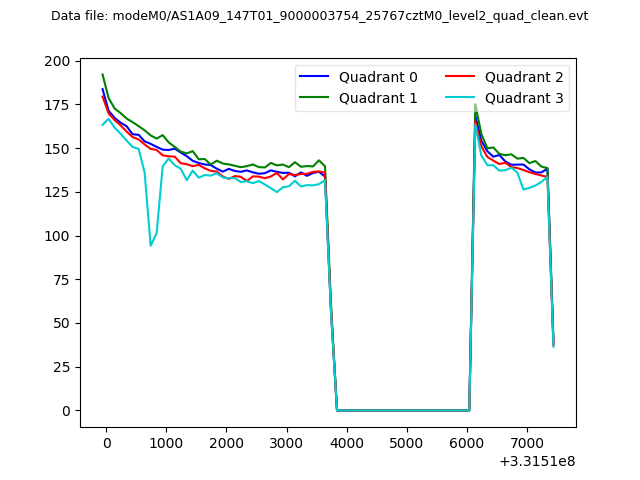
| Quadrant-wise count rates Data is divided into 100 sec bins |
 |
|
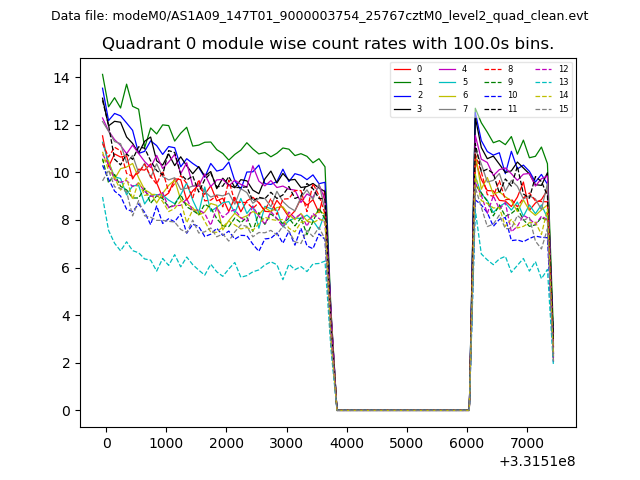
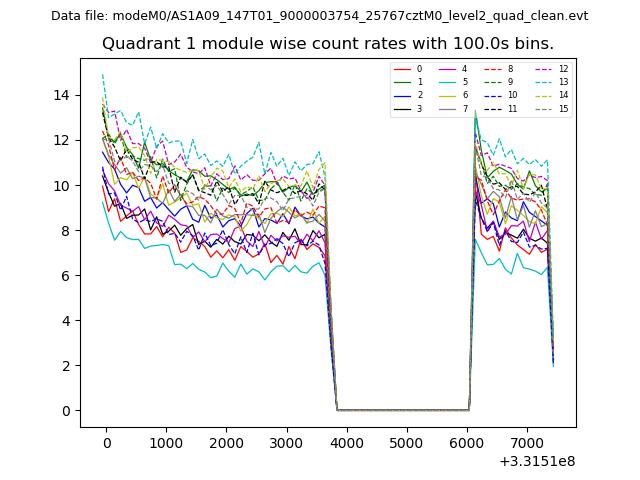
| Module-wise count rates for Quadrant A Data is divided into 100 sec bins |
 |
 |
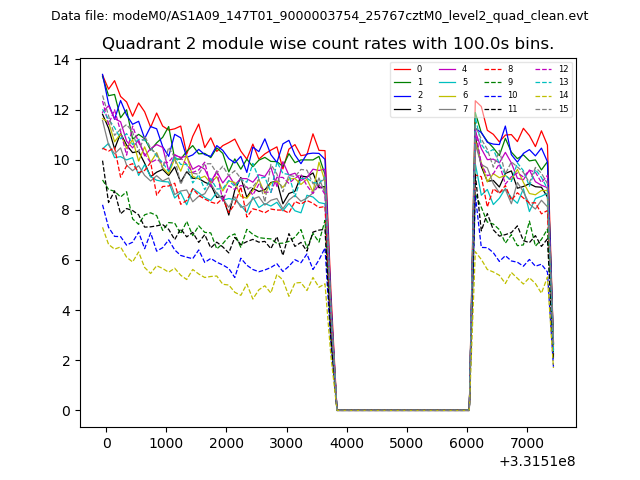
| Module-wise count rates for Quadrant B Data is divided into 100 sec bins |
 |
 |
| Module-wise count rates for Quadrant C Data is divided into 100 sec bins |
 |
 |
| Module-wise count rates for Quadrant D Data is divided into 100 sec bins |
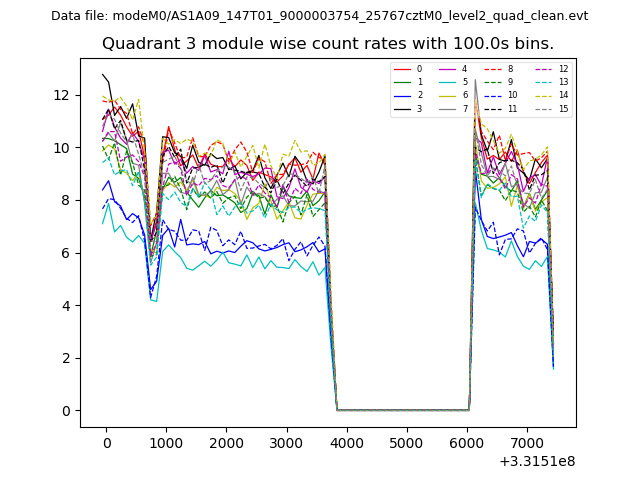 |
 |
| Parameter | Plot |
|---|---|
| CZT HV Monitor | 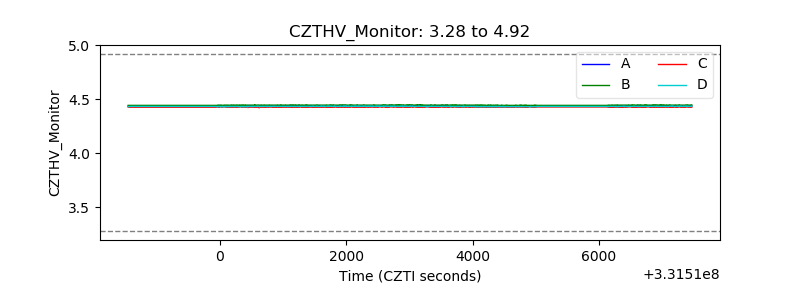 |
| D_VDD | 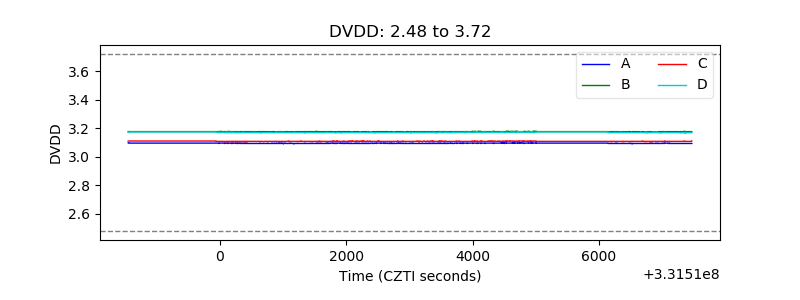 |
| Temperature 1 | 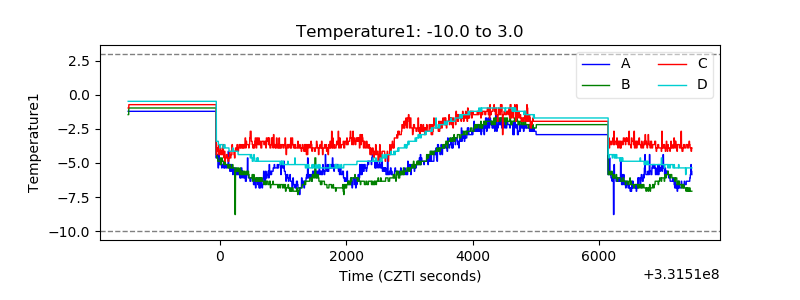 |
| Veto HV Monitor | 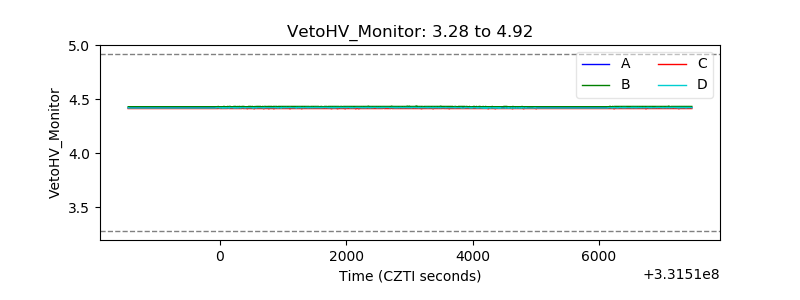 |
| Veto LLD | 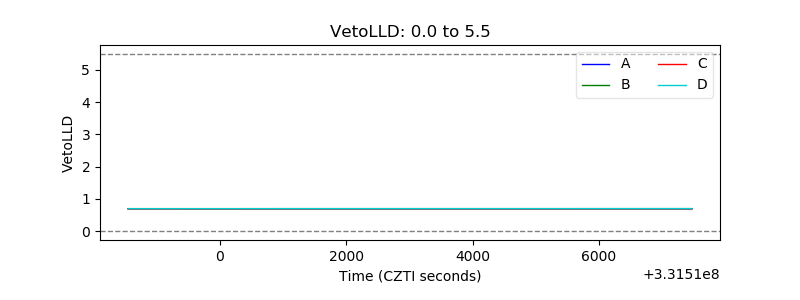 |
| Alpha Counter | 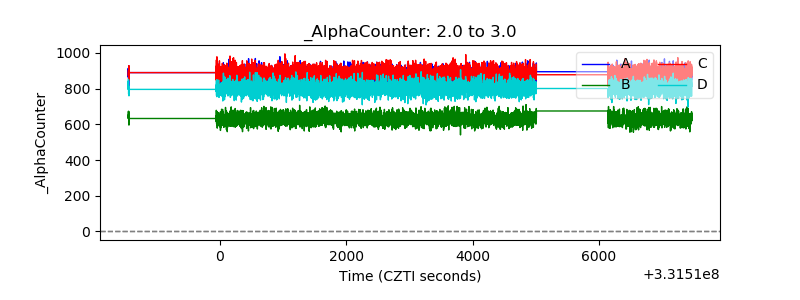 |
| _CPM_Rate | 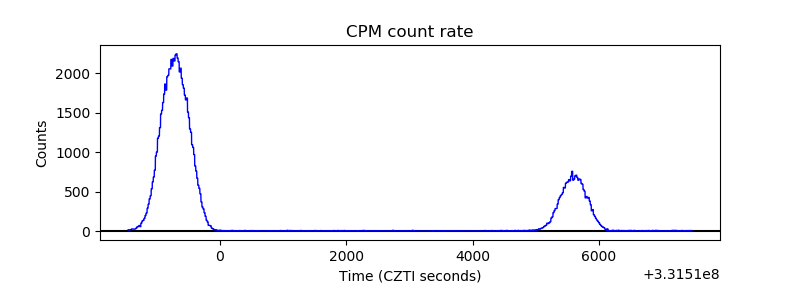 |
| CZT Counter | 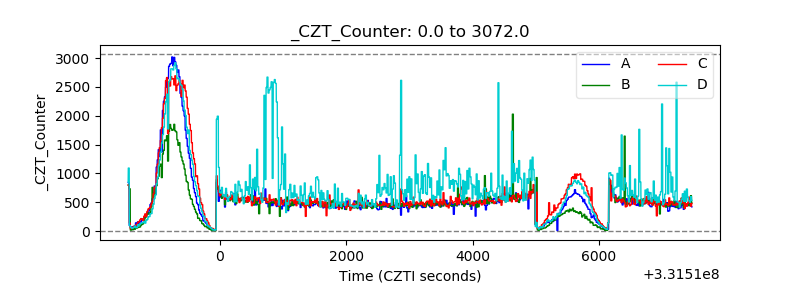 |
| +2.5 Volts monitor |  |
| +5 Volts monitor |  |
| _ROLL_ROT | 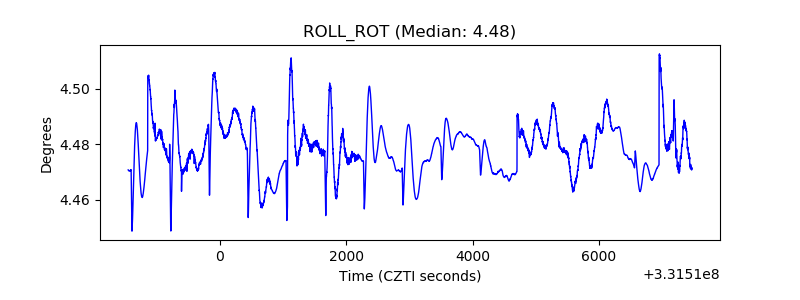 |
| _Roll_DEC | 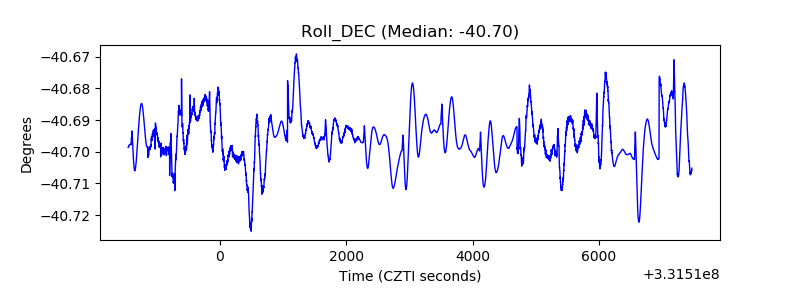 |
| _Roll_RA | 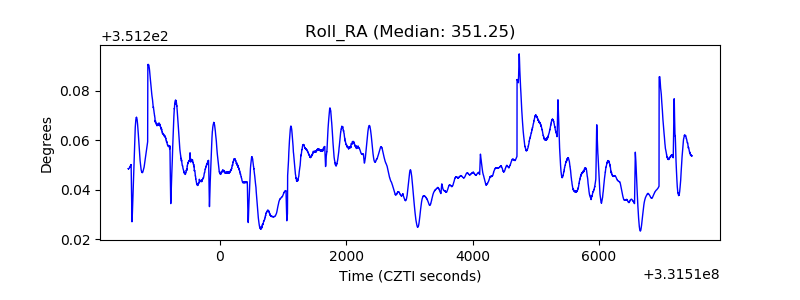 |
| Veto Counter | 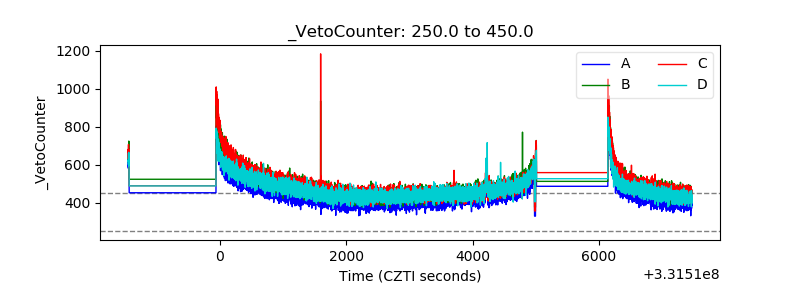 |