| Param | Original file | Final file |
|---|---|---|
| Filename | modeM0/AS1A09_147T01_9000003754_25768cztM0_level2.evt | modeM0/AS1A09_147T01_9000003754_25768cztM0_level2_quad_clean.evt |
| Size (bytes) | 485,864,640 | 102,712,320 |
| Size | 463.4 MB | 98.0 MB |
| Events in quadrant A | 3,288,211 | 662,705 |
| Events in quadrant B | 3,447,396 | 679,087 |
| Events in quadrant C | 3,477,047 | 651,393 |
| Events in quadrant D | 4,034,002 | 637,562 |
| Mode M9 | |||
|---|---|---|---|
| Quadrant | BADHDUFLAG | Total packets | Discarded packets |
| A | 0 | 12 | 0 |
| B | 0 | 13 | 0 |
| C | 0 | 13 | 0 |
| D | 0 | 13 | 0 |
| Mode M0 | |||
|---|---|---|---|
| Quadrant | BADHDUFLAG | Total packets | Discarded packets |
| A | 0 | 14179 | 0 |
| B | 0 | 14533 | 0 |
| C | 0 | 14483 | 0 |
| D | 0 | 16475 | 0 |
| Quadrant | Total seconds | Saturated seconds | Saturation percentage |
|---|---|---|---|
| A | 6881 | 45 | 0.653975% |
| B | 6880 | 99 | 1.438953% |
| C | 6880 | 118 | 1.715116% |
| D | 6880 | 100 | 1.453488% |
Noise dominated data is calculated using 1-second bins in cleaned event files. If a bin has >2000 counts, and if more than 50% of those come from <1% of pixels, then it is considered to be noise-dominated and hence unusable.
| Quadrant | # 1 sec bins | Bins with >0 counts | Bins with >2000 counts | High rate bins dominated by noise | Noise dominated (total time) | Noise dominated (detector-on time) | Marked lightcurve |
|---|---|---|---|---|---|---|---|
| A | 7656 | 6882 | 0 | 0 | 0.00% | 0.00% | 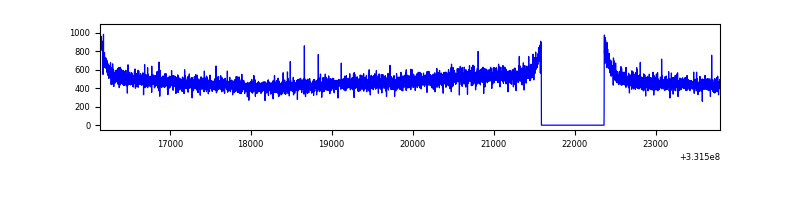 |
| B | 7655 | 6880 | 13 | 13 | 0.17% | 0.19% | 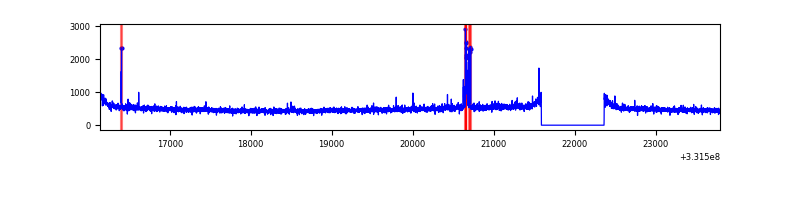 |
| C | 7655 | 6881 | 0 | 0 | 0.00% | 0.00% | 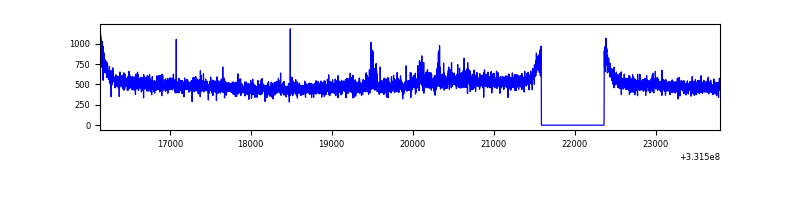 |
| D | 7655 | 6881 | 50 | 50 | 0.65% | 0.73% | 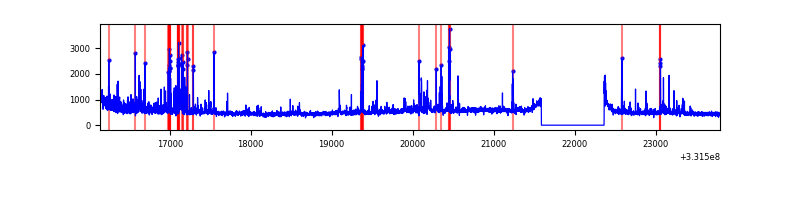 |
Top three noisy pixels from each quadrant. If the there are fewer than three noisy pixels in the level2.evt file, extra rows are filled as -1
| Pixel properties | Quadrant properties | ||||||
|---|---|---|---|---|---|---|---|
| Quadrant | DetID | PixID | Counts | Sigma | Mean | Median | Sigma |
| A | 13 | 254 | 9426 | 50.21 | 852 | 835 | 171.1 |
| A | 3 | 137 | 7839 | 40.93 | 852 | 835 | 171.1 |
| A | 0 | 226 | 7164 | 36.99 | 852 | 835 | 171.1 |
| B | 10 | 247 | 66327 | 403.56 | 853 | 830 | 162.3 |
| B | 12 | 111 | 19669 | 116.08 | 853 | 830 | 162.3 |
| B | 11 | 111 | 18033 | 106.0 | 853 | 830 | 162.3 |
| C | 14 | 238 | 135213 | 687.95 | 833 | 839 | 195.3 |
| C | 3 | 233 | 96995 | 492.29 | 833 | 839 | 195.3 |
| C | 13 | 61 | 5627 | 24.51 | 833 | 839 | 195.3 |
| D | 8 | 195 | 367797 | 1852.23 | 833 | 814 | 198.1 |
| D | 13 | 104 | 194674 | 978.45 | 833 | 814 | 198.1 |
| D | 7 | 80 | 121169 | 607.45 | 833 | 814 | 198.1 |
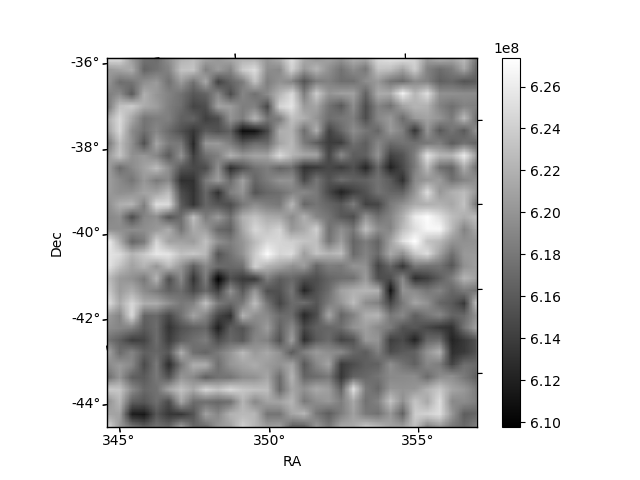
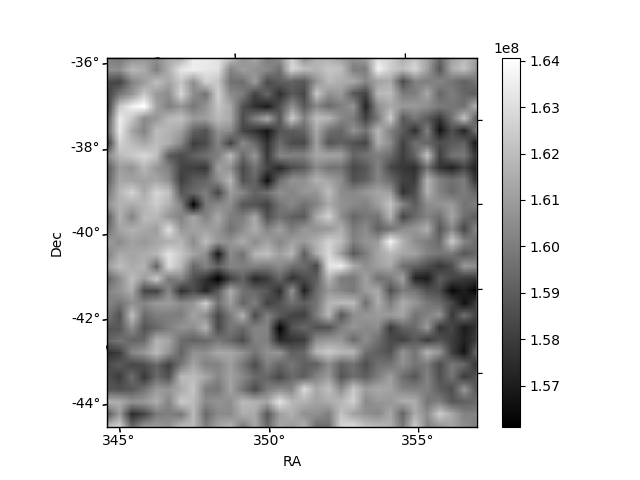
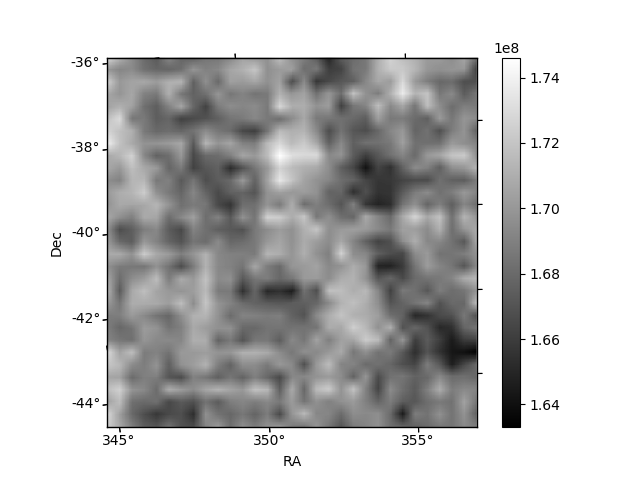
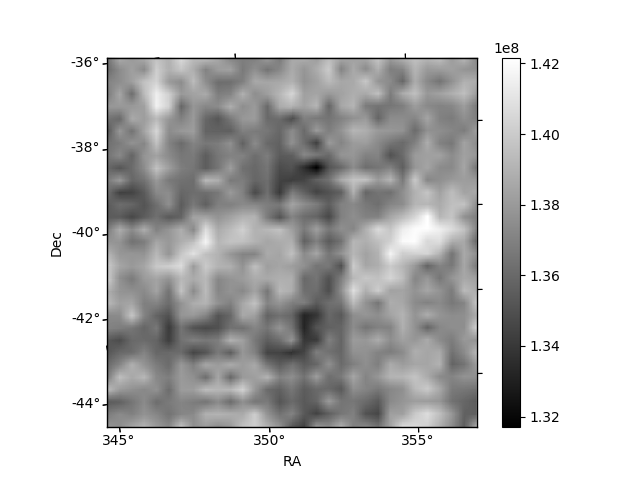
Histogram calculated using DETX and DETY for each event in the final _common_clean file
| Quadrant A | 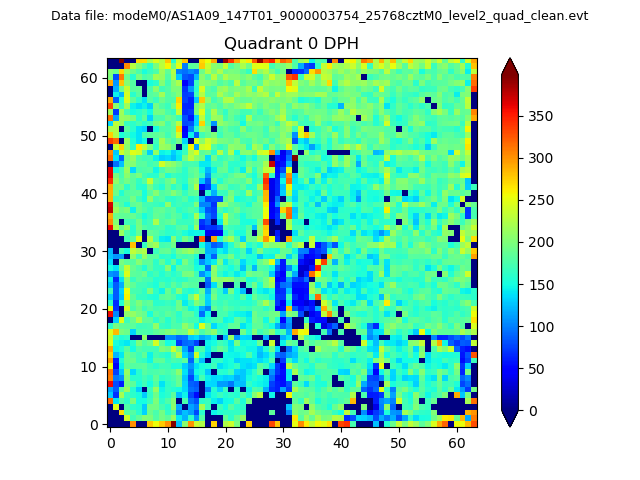 |
 |
Quadrant B |
|---|---|---|---|
| Quadrant D | 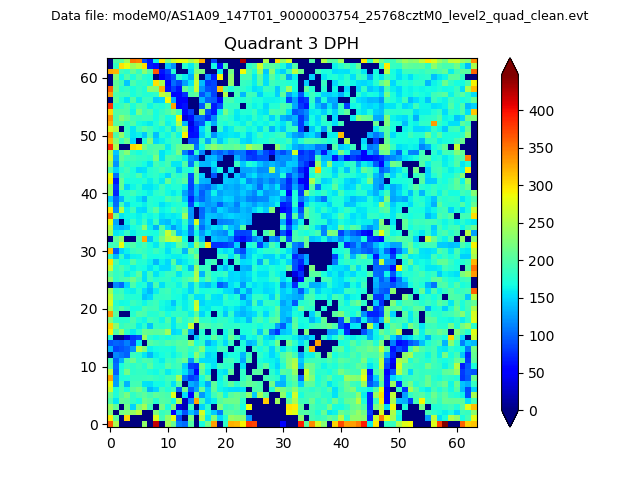 |
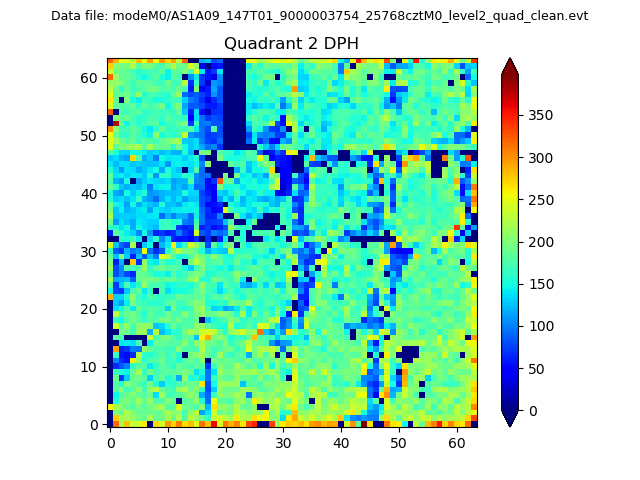 |
Quadrant C |
| Plot type | Count rate plots | Images |
|---|---|---|
| Comparison with Poisson distribution Blue bars denote a histogram of data divided into 1 sec bins. Red curve is a Poisson curve with rate = median count rate of data. |
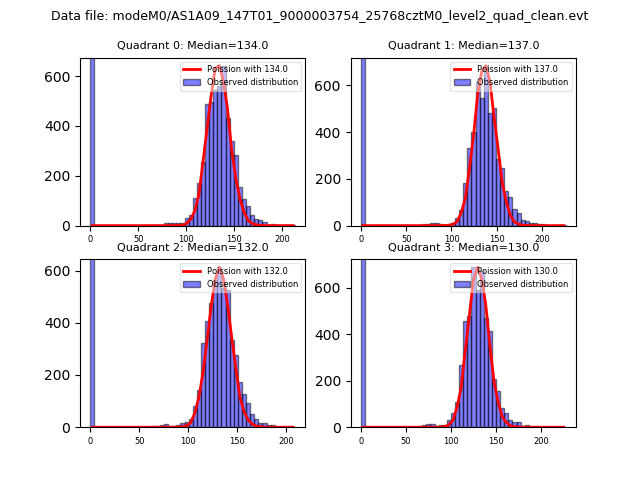 |
 |
| Quadrant-wise count rates Data is divided into 100 sec bins |
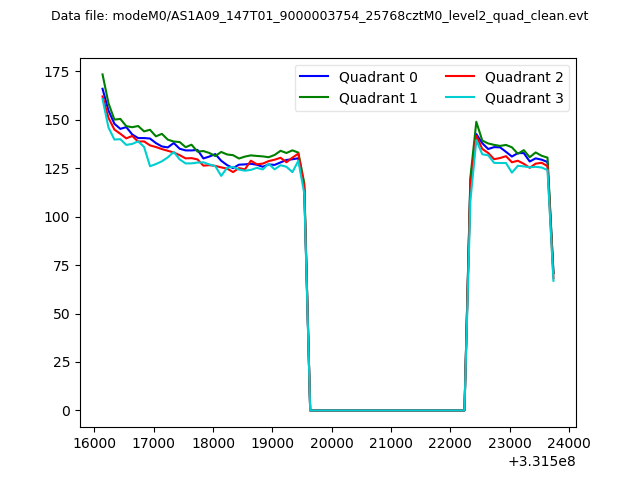 |
|
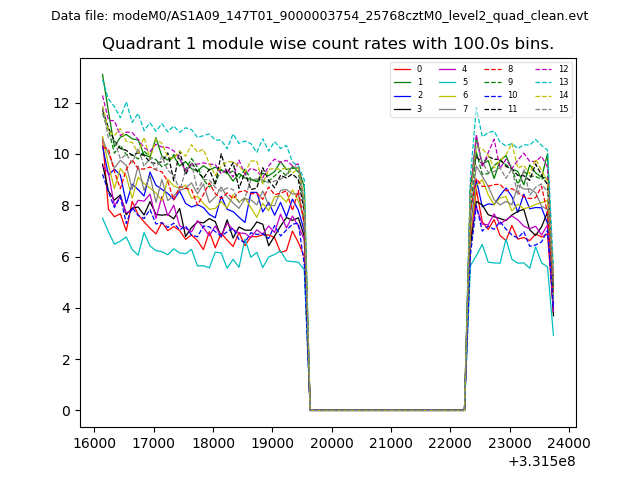
| Module-wise count rates for Quadrant A Data is divided into 100 sec bins |
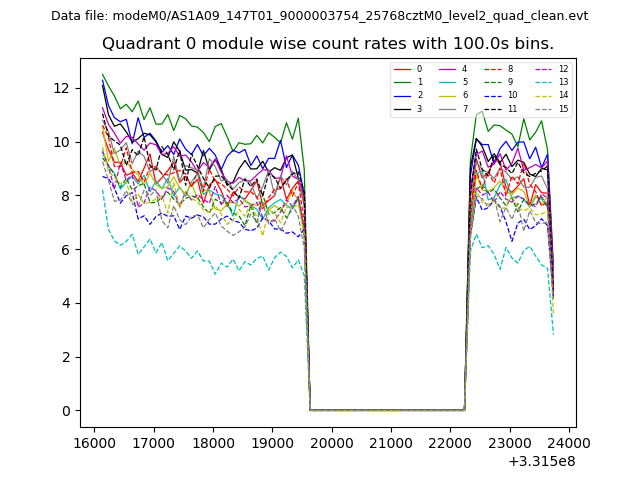 |
 |
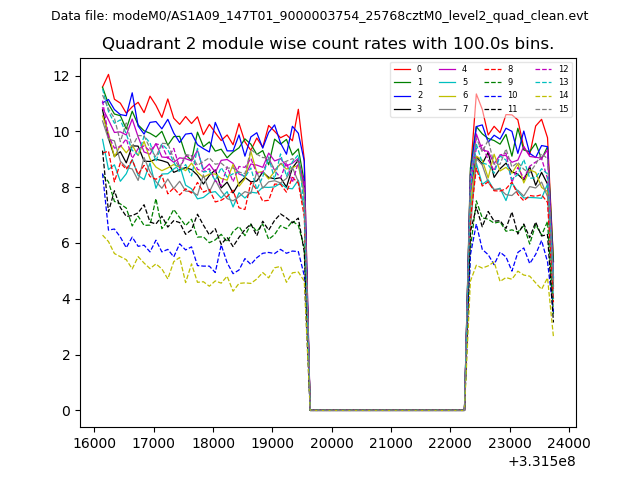
| Module-wise count rates for Quadrant B Data is divided into 100 sec bins |
 |
 |
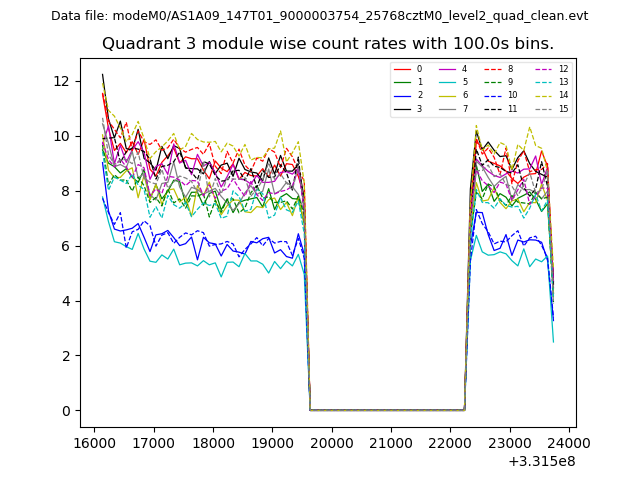
| Module-wise count rates for Quadrant C Data is divided into 100 sec bins |
 |
 |
| Module-wise count rates for Quadrant D Data is divided into 100 sec bins |
 |
 |
| Parameter | Plot |
|---|---|
| CZT HV Monitor | 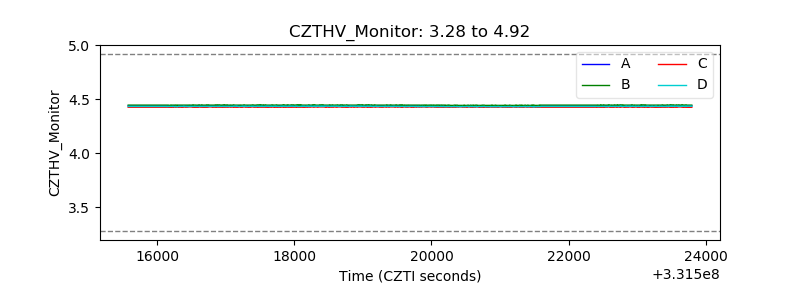 |
| D_VDD | 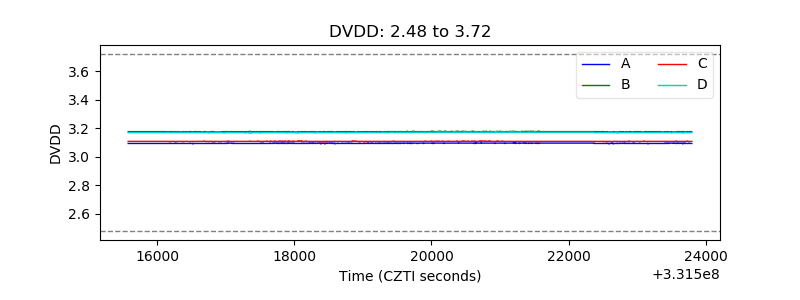 |
| Temperature 1 | 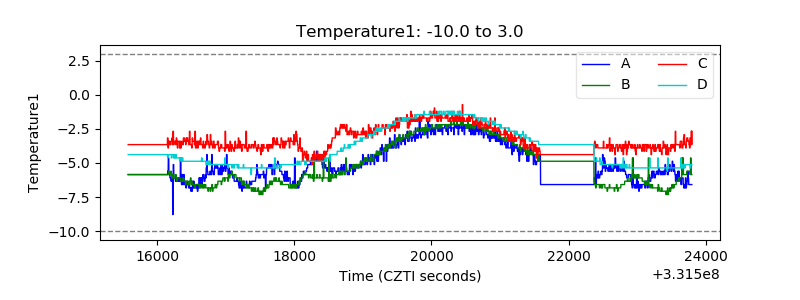 |
| Veto HV Monitor | 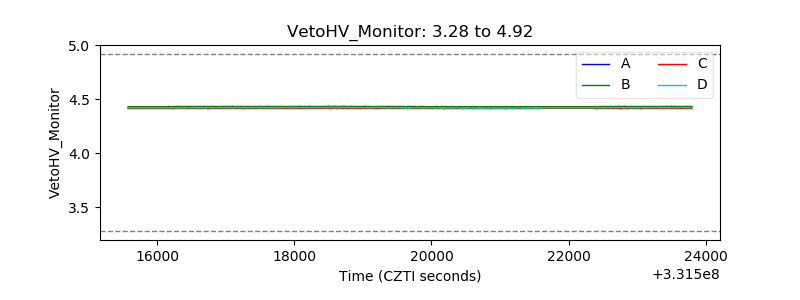 |
| Veto LLD | 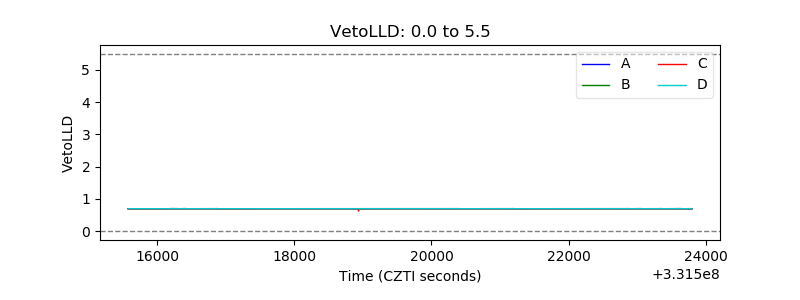 |
| Alpha Counter | 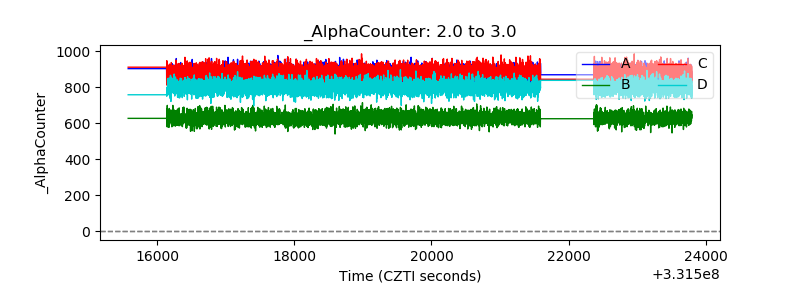 |
| _CPM_Rate | 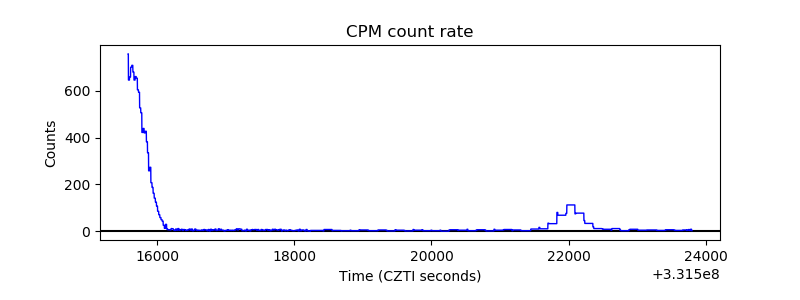 |
| CZT Counter | 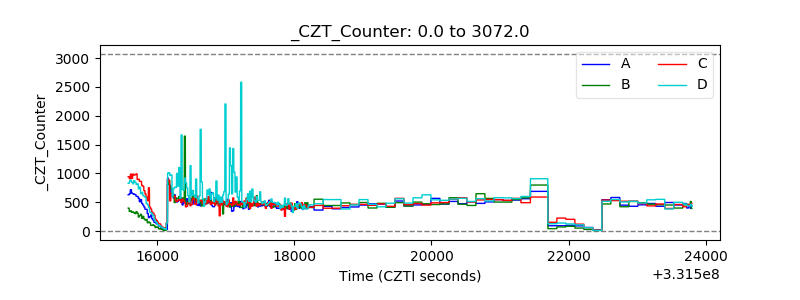 |
| +2.5 Volts monitor |  |
| +5 Volts monitor | 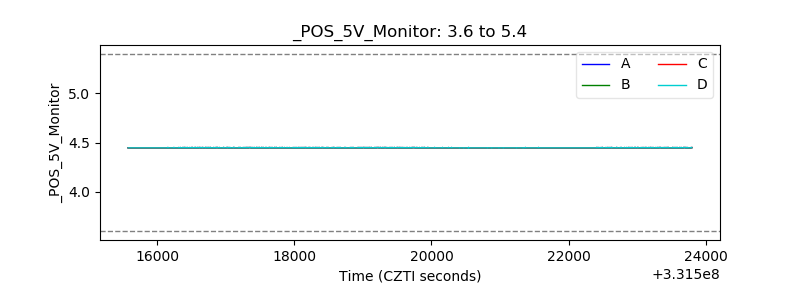 |
| _ROLL_ROT | 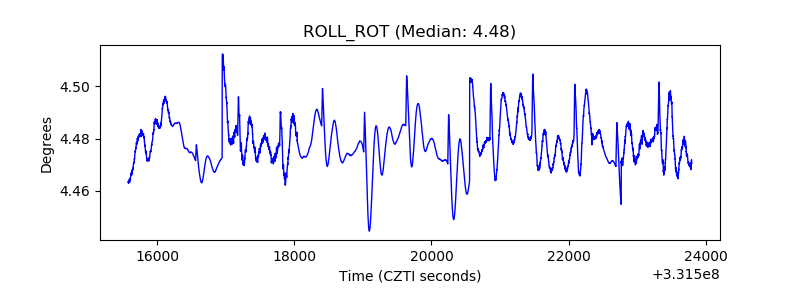 |
| _Roll_DEC | 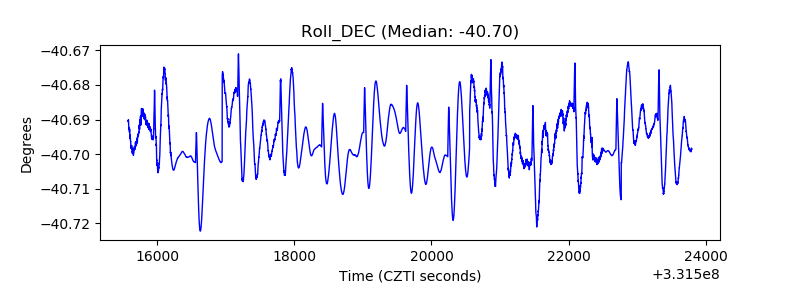 |
| _Roll_RA | 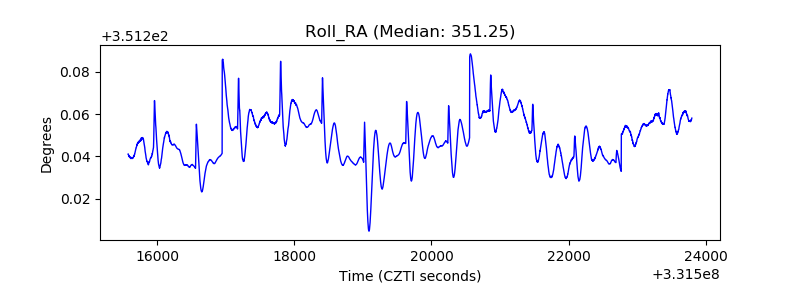 |
| Veto Counter | 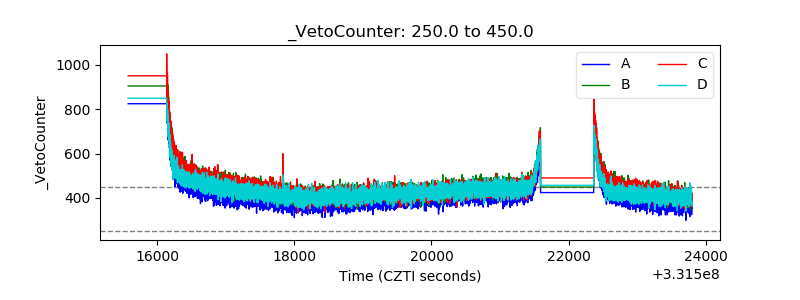 |