| Param | Original file | Final file |
|---|---|---|
| Filename | modeM0/AS1A09_147T01_9000003754_25773cztM0_level2.evt | modeM0/AS1A09_147T01_9000003754_25773cztM0_level2_quad_clean.evt |
| Size (bytes) | 1,210,233,600 | 217,103,040 |
| Size | 1.1 GB | 207.0 MB |
| Events in quadrant A | 8,082,152 | 1,362,668 |
| Events in quadrant B | 8,288,436 | 1,391,928 |
| Events in quadrant C | 8,422,996 | 1,334,350 |
| Events in quadrant D | 10,698,556 | 1,303,661 |
| Mode M9 | |||
|---|---|---|---|
| Quadrant | BADHDUFLAG | Total packets | Discarded packets |
| A | 0 | 10 | 0 |
| B | 0 | 10 | 0 |
| C | 0 | 10 | 0 |
| D | 0 | 10 | 0 |
| Mode M0 | |||
|---|---|---|---|
| Quadrant | BADHDUFLAG | Total packets | Discarded packets |
| A | 0 | 35240 | 0 |
| B | 0 | 35603 | 0 |
| C | 0 | 35710 | 0 |
| D | 0 | 42757 | 0 |
| Quadrant | Total seconds | Saturated seconds | Saturation percentage |
|---|---|---|---|
| A | 17141 | 267 | 1.557669% |
| B | 17140 | 350 | 2.042007% |
| C | 17141 | 423 | 2.467767% |
| D | 17141 | 627 | 3.657896% |
Noise dominated data is calculated using 1-second bins in cleaned event files. If a bin has >2000 counts, and if more than 50% of those come from <1% of pixels, then it is considered to be noise-dominated and hence unusable.
| Quadrant | # 1 sec bins | Bins with >0 counts | Bins with >2000 counts | High rate bins dominated by noise | Noise dominated (total time) | Noise dominated (detector-on time) | Marked lightcurve |
|---|---|---|---|---|---|---|---|
| A | 18286 | 17144 | 0 | 0 | 0.00% | 0.00% | 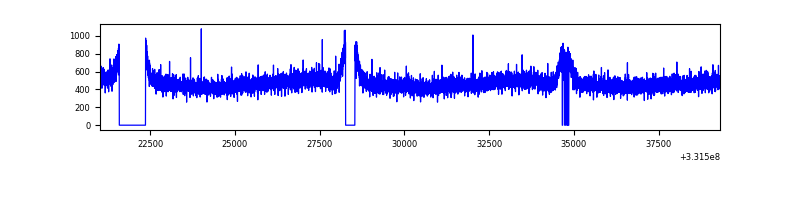 |
| B | 18285 | 17143 | 1 | 1 | 0.01% | 0.01% | 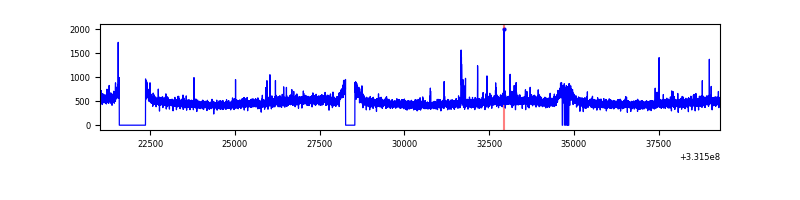 |
| C | 18286 | 17143 | 0 | 0 | 0.00% | 0.00% | 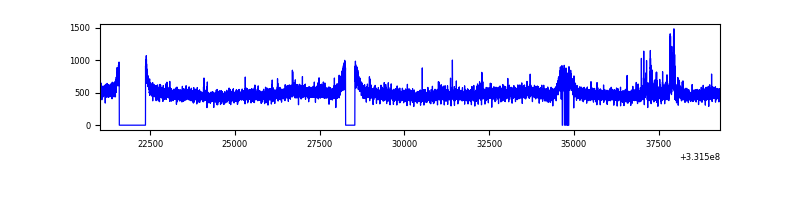 |
| D | 18286 | 17142 | 328 | 328 | 1.79% | 1.91% | 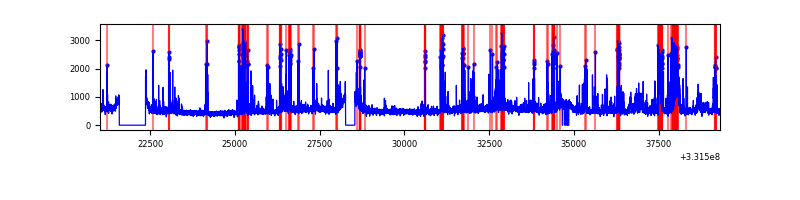 |
Top three noisy pixels from each quadrant. If the there are fewer than three noisy pixels in the level2.evt file, extra rows are filled as -1
| Pixel properties | Quadrant properties | ||||||
|---|---|---|---|---|---|---|---|
| Quadrant | DetID | PixID | Counts | Sigma | Mean | Median | Sigma |
| A | 13 | 254 | 21503 | 46.28 | 2095 | 2047 | 420.4 |
| A | 3 | 137 | 19920 | 42.51 | 2095 | 2047 | 420.4 |
| A | 0 | 226 | 18035 | 38.03 | 2095 | 2047 | 420.4 |
| B | 0 | 190 | 73207 | 181.41 | 2079 | 2023 | 392.4 |
| B | 12 | 111 | 49191 | 120.21 | 2079 | 2023 | 392.4 |
| B | 11 | 111 | 44870 | 109.19 | 2079 | 2023 | 392.4 |
| C | 14 | 238 | 322335 | 677.59 | 2026 | 2035 | 472.7 |
| C | 3 | 233 | 210491 | 440.99 | 2026 | 2035 | 472.7 |
| C | 13 | 61 | 13803 | 24.9 | 2026 | 2035 | 472.7 |
| D | 7 | 80 | 1031977 | 2126.75 | 2035 | 1989 | 484.3 |
| D | 8 | 195 | 754978 | 1554.79 | 2035 | 1989 | 484.3 |
| D | 13 | 104 | 605755 | 1246.67 | 2035 | 1989 | 484.3 |
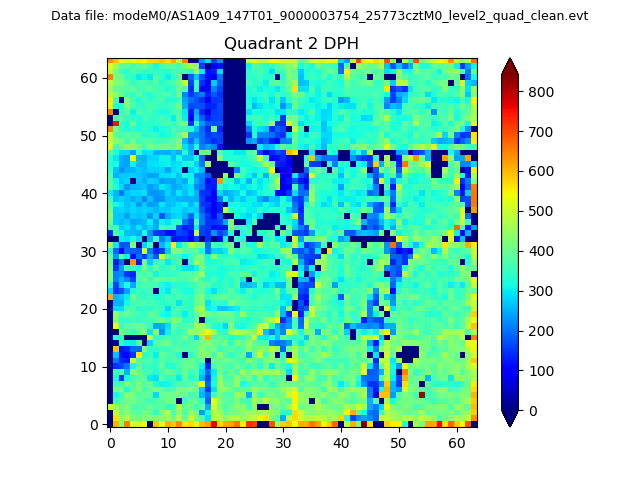
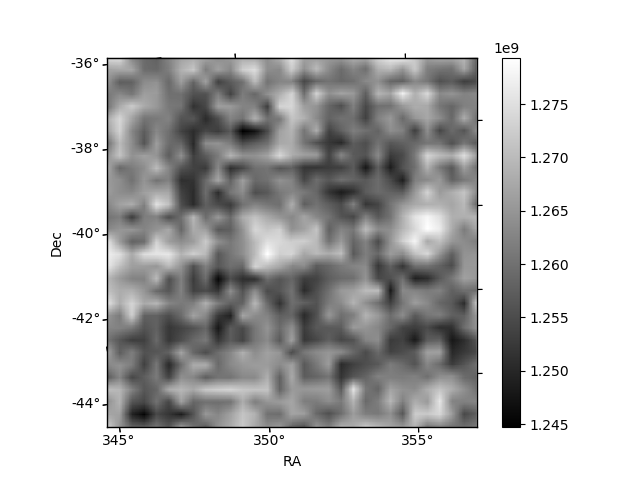
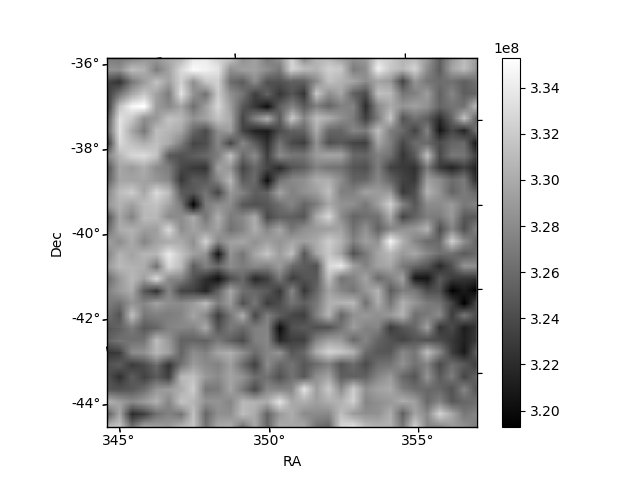
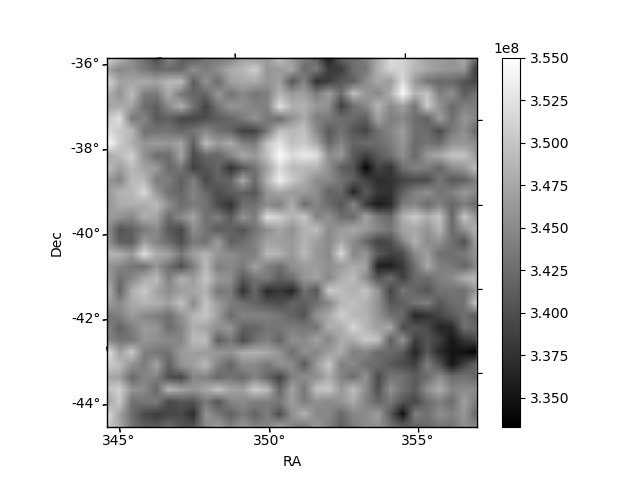
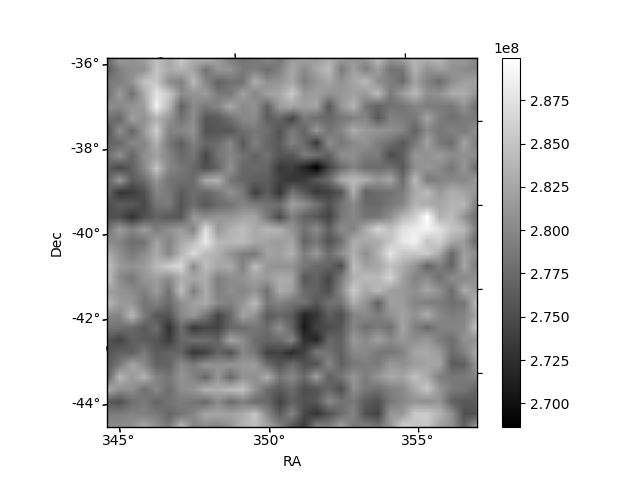
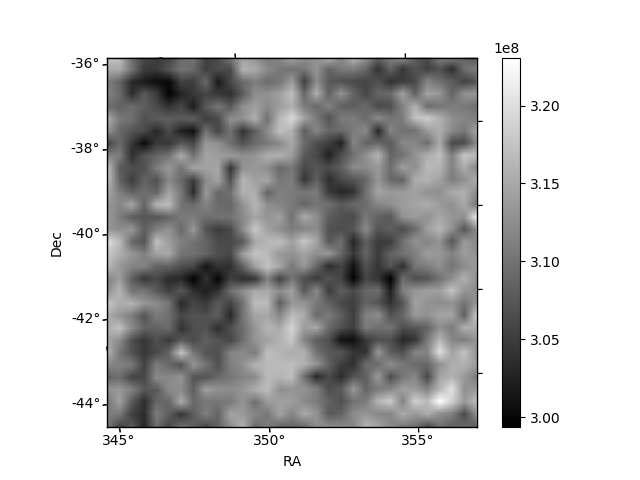
Histogram calculated using DETX and DETY for each event in the final _common_clean file
| Quadrant A | 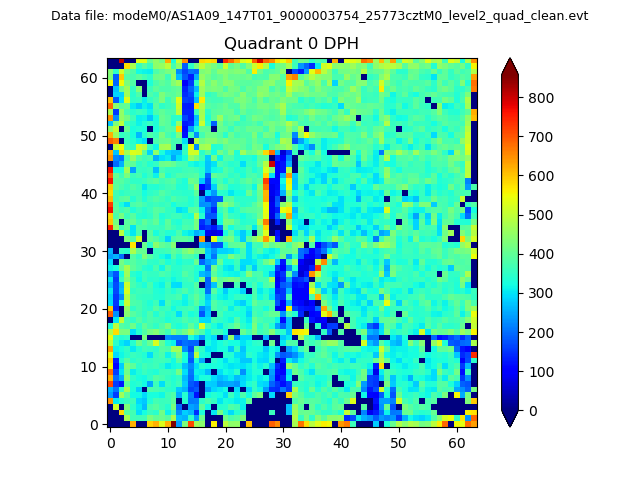 |
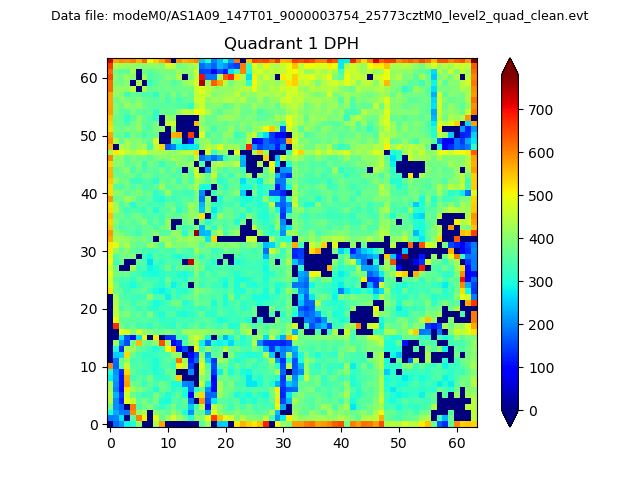 |
Quadrant B |
|---|---|---|---|
| Quadrant D | 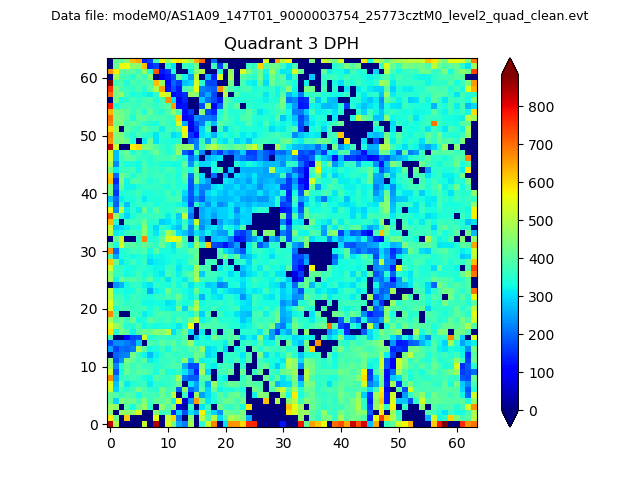 |
 |
Quadrant C |
| Plot type | Count rate plots | Images |
|---|---|---|
| Comparison with Poisson distribution Blue bars denote a histogram of data divided into 1 sec bins. Red curve is a Poisson curve with rate = median count rate of data. |
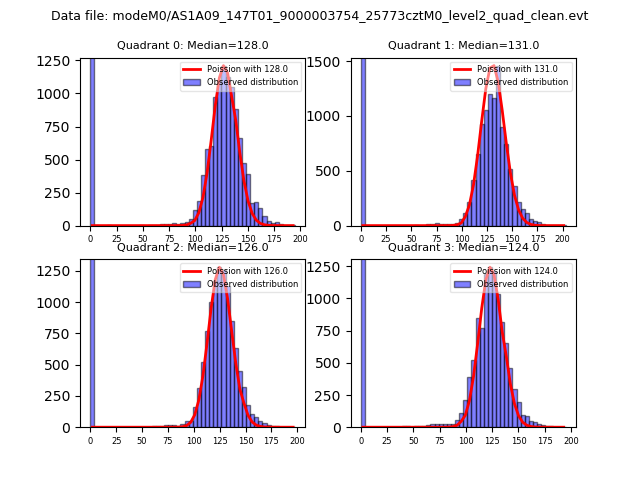 |
 |
| Quadrant-wise count rates Data is divided into 100 sec bins |
 |
|
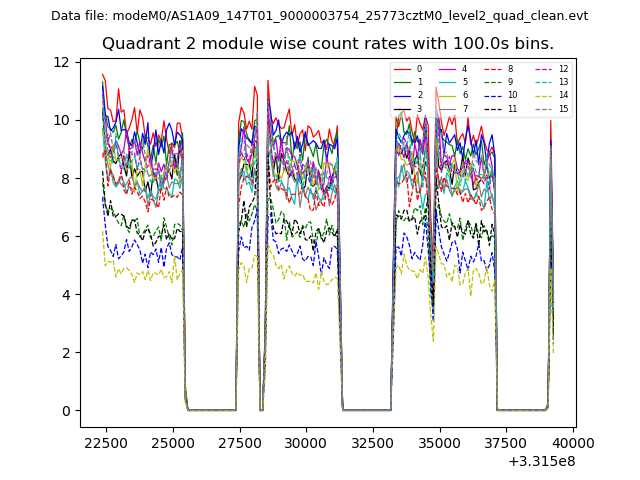
| Module-wise count rates for Quadrant A Data is divided into 100 sec bins |
 |
 |
| Module-wise count rates for Quadrant B Data is divided into 100 sec bins |
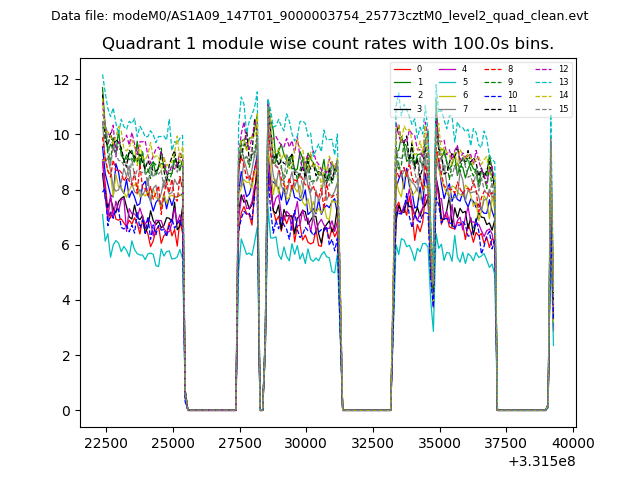 |
 |
| Module-wise count rates for Quadrant C Data is divided into 100 sec bins |
 |
 |
| Module-wise count rates for Quadrant D Data is divided into 100 sec bins |
 |
 |
| Parameter | Plot |
|---|---|
| CZT HV Monitor | 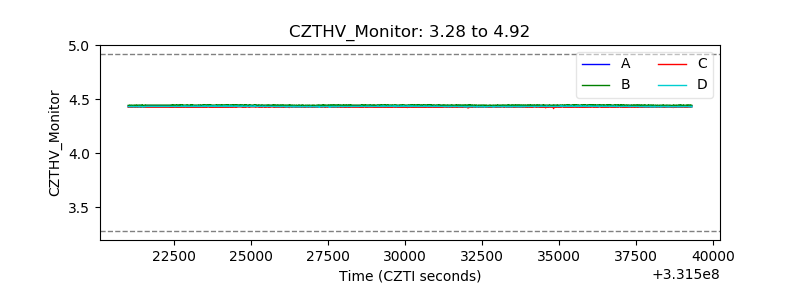 |
| D_VDD | 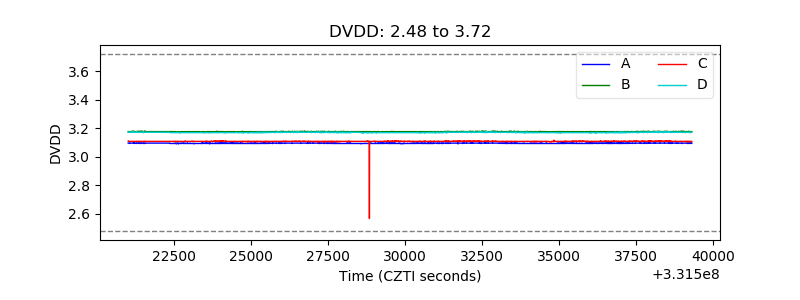 |
| Temperature 1 | 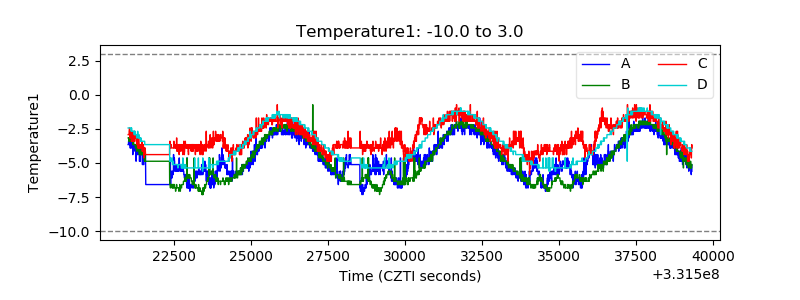 |
| Veto HV Monitor | 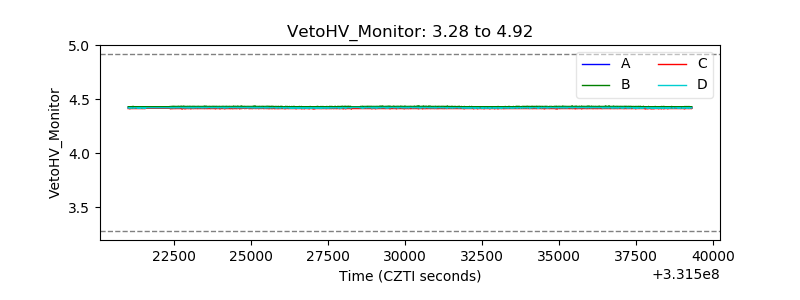 |
| Veto LLD | 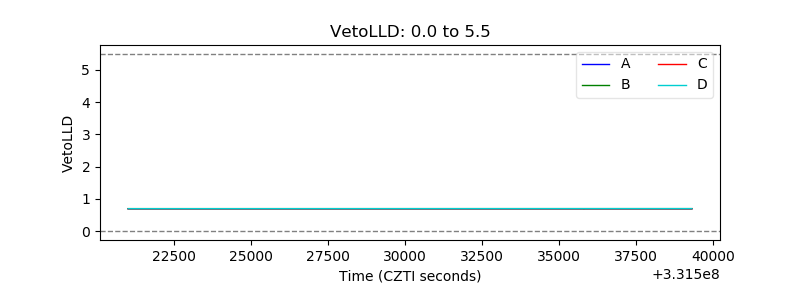 |
| Alpha Counter | 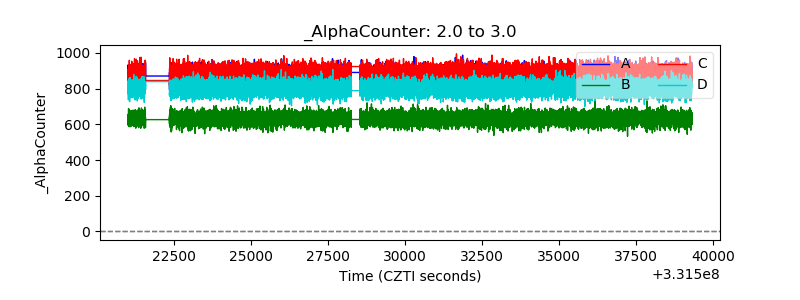 |
| _CPM_Rate | 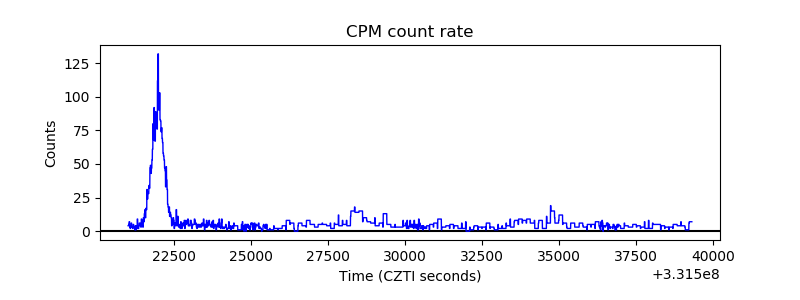 |
| CZT Counter | 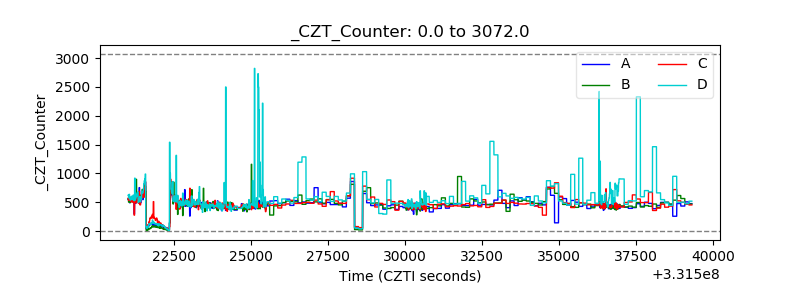 |
| +2.5 Volts monitor |  |
| +5 Volts monitor |  |
| _ROLL_ROT | 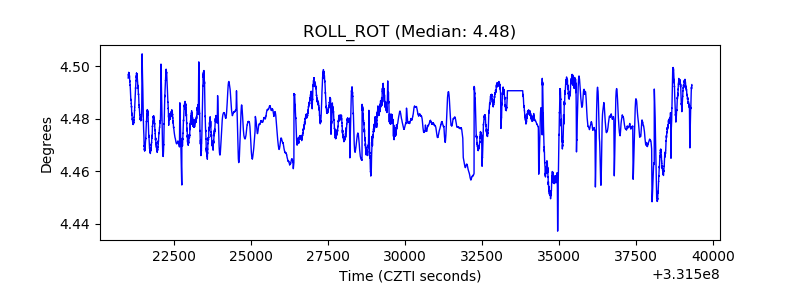 |
| _Roll_DEC | 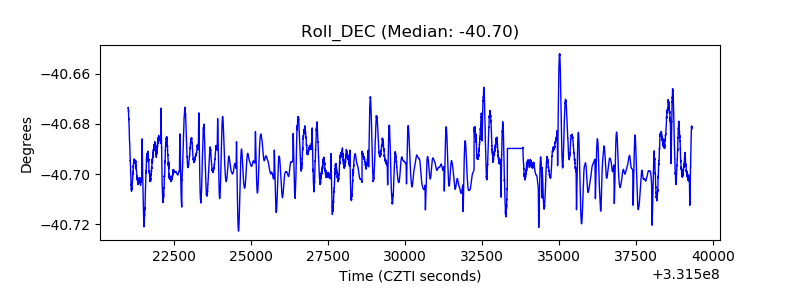 |
| _Roll_RA | 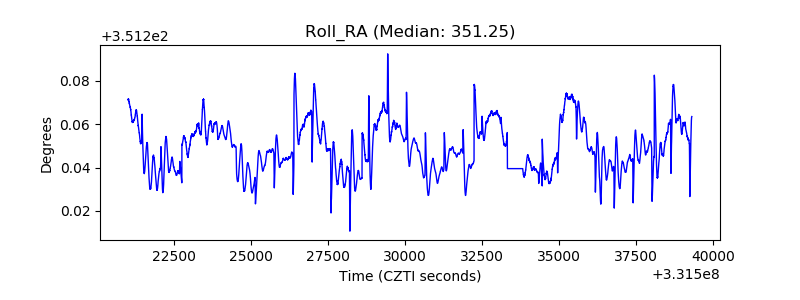 |
| Veto Counter | 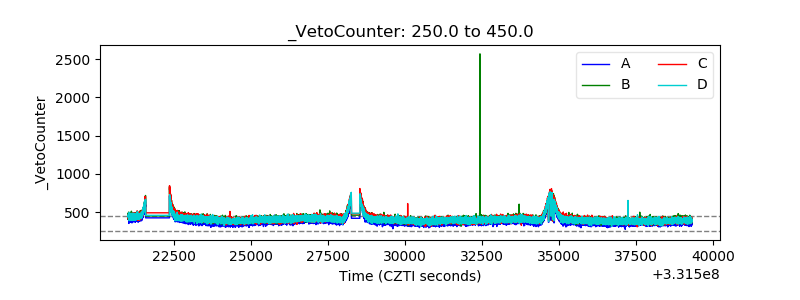 |