| Param | Original file | Final file |
|---|---|---|
| Filename | modeM0/AS1A09_147T01_9000003754_25774cztM0_level2.evt | modeM0/AS1A09_147T01_9000003754_25774cztM0_level2_quad_clean.evt |
| Size (bytes) | 1,741,080,960 | 260,231,040 |
| Size | 1.6 GB | 248.2 MB |
| Events in quadrant A | 10,368,489 | 1,674,043 |
| Events in quadrant B | 9,667,876 | 1,698,922 |
| Events in quadrant C | 9,629,178 | 1,633,321 |
| Events in quadrant D | 21,713,400 | 1,495,985 |
| Mode M9 | |||
|---|---|---|---|
| Quadrant | BADHDUFLAG | Total packets | Discarded packets |
| A | 0 | 26 | 0 |
| B | 0 | 26 | 0 |
| C | 0 | 26 | 0 |
| D | 0 | 26 | 0 |
| Mode M0 | |||
|---|---|---|---|
| Quadrant | BADHDUFLAG | Total packets | Discarded packets |
| A | 0 | 43754 | 0 |
| B | 0 | 41185 | 0 |
| C | 0 | 41064 | 0 |
| D | 0 | 77926 | 0 |
| Quadrant | Total seconds | Saturated seconds | Saturation percentage |
|---|---|---|---|
| A | 20023 | 248 | 1.238576% |
| B | 20023 | 267 | 1.333467% |
| C | 20024 | 351 | 1.752897% |
| D | 20024 | 3781 | 18.882341% |
Noise dominated data is calculated using 1-second bins in cleaned event files. If a bin has >2000 counts, and if more than 50% of those come from <1% of pixels, then it is considered to be noise-dominated and hence unusable.
| Quadrant | # 1 sec bins | Bins with >0 counts | Bins with >2000 counts | High rate bins dominated by noise | Noise dominated (total time) | Noise dominated (detector-on time) | Marked lightcurve |
|---|---|---|---|---|---|---|---|
| A | 22543 | 20023 | 1 | 1 | 0.00% | 0.00% | 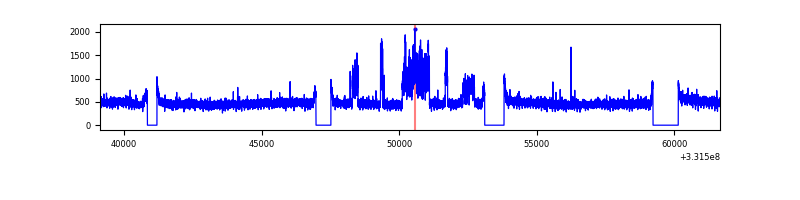 |
| B | 22543 | 20023 | 3 | 3 | 0.01% | 0.01% | 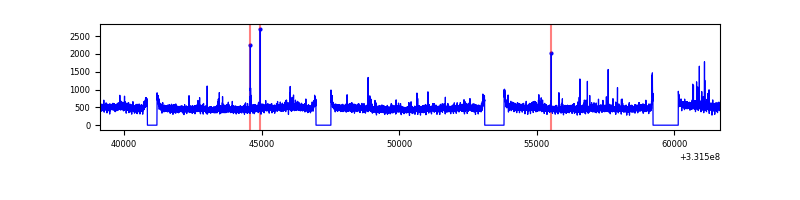 |
| C | 22544 | 20024 | 4 | 4 | 0.02% | 0.02% | 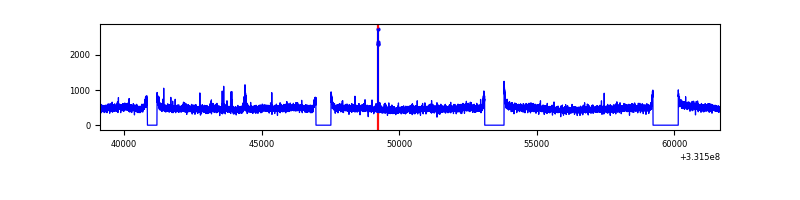 |
| D | 22544 | 20024 | 3304 | 3304 | 14.66% | 16.50% | 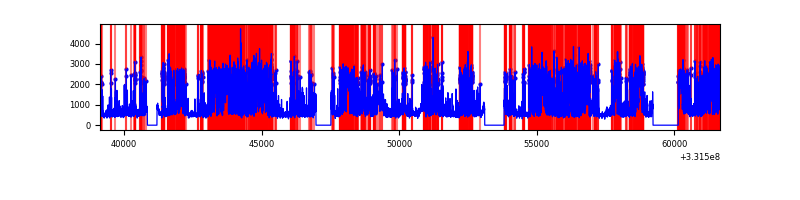 |
Top three noisy pixels from each quadrant. If the there are fewer than three noisy pixels in the level2.evt file, extra rows are filled as -1
| Pixel properties | Quadrant properties | ||||||
|---|---|---|---|---|---|---|---|
| Quadrant | DetID | PixID | Counts | Sigma | Mean | Median | Sigma |
| A | 11 | 29 | 957265 | 1959.06 | 2434 | 2378 | 487.4 |
| A | 13 | 254 | 27549 | 51.64 | 2434 | 2378 | 487.4 |
| A | 3 | 137 | 22957 | 42.22 | 2434 | 2378 | 487.4 |
| B | 12 | 111 | 57360 | 118.07 | 2424 | 2356 | 465.9 |
| B | 11 | 111 | 51843 | 106.23 | 2424 | 2356 | 465.9 |
| B | 0 | 190 | 51192 | 104.83 | 2424 | 2356 | 465.9 |
| C | 14 | 238 | 374250 | 682.09 | 2344 | 2360 | 545.2 |
| C | 3 | 233 | 103237 | 185.02 | 2344 | 2360 | 545.2 |
| C | 10 | 23 | 20079 | 32.5 | 2344 | 2360 | 545.2 |
| D | 1 | 52 | 4535586 | 8702.55 | 2197 | 2142 | 520.9 |
| D | 7 | 80 | 4259684 | 8172.92 | 2197 | 2142 | 520.9 |
| D | 12 | 2 | 2784783 | 5341.65 | 2197 | 2142 | 520.9 |
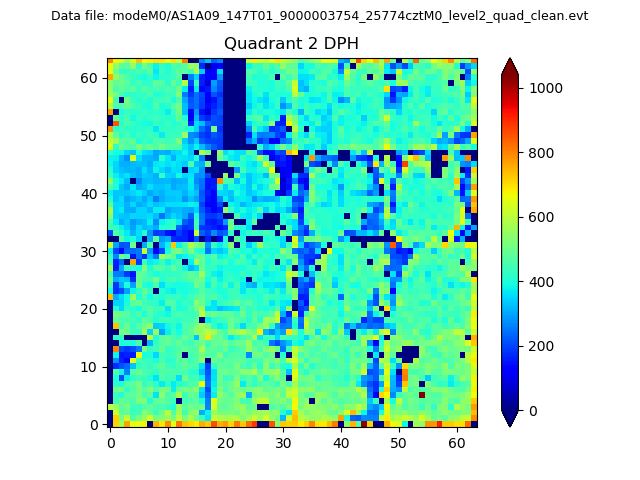
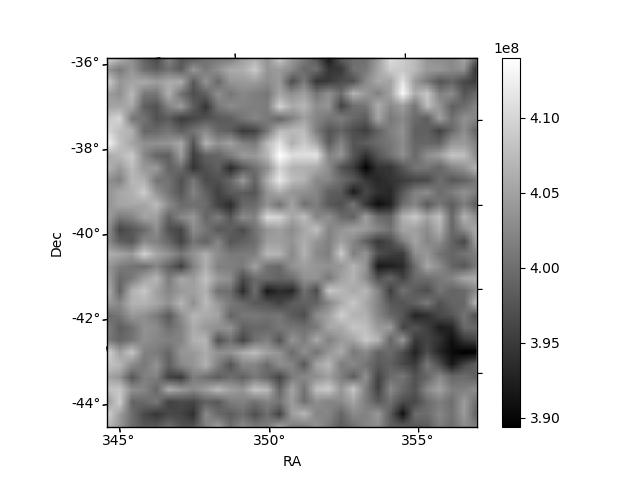
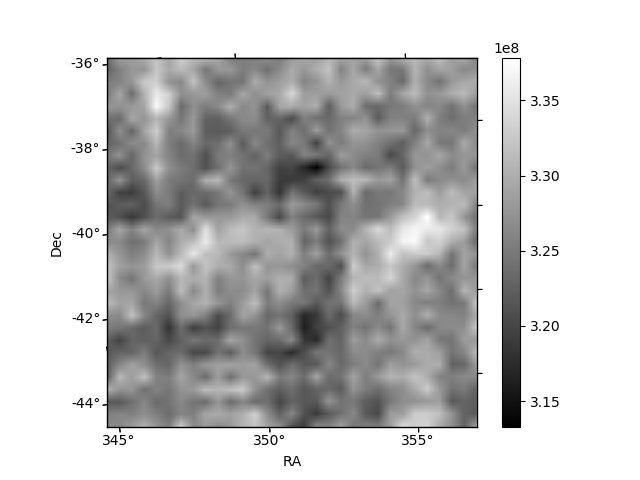
Histogram calculated using DETX and DETY for each event in the final _common_clean file
| Quadrant A | 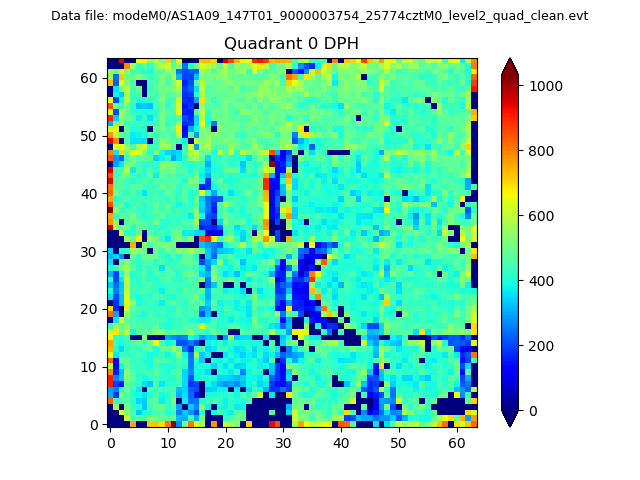 |
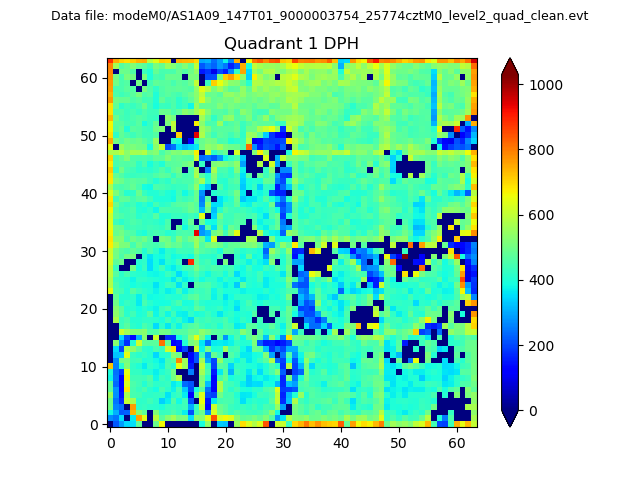 |
Quadrant B |
|---|---|---|---|
| Quadrant D | 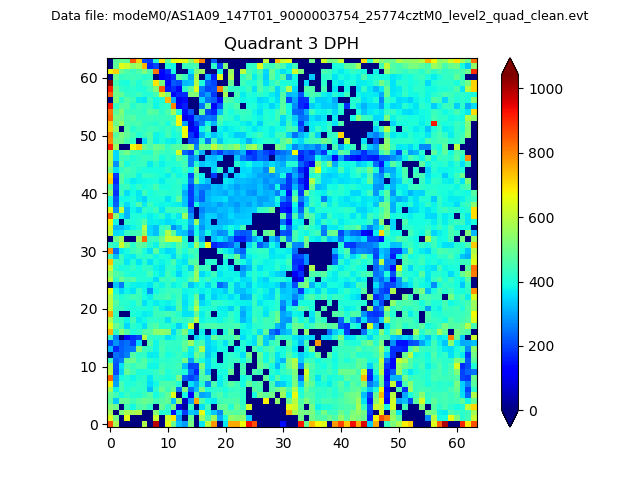 |
 |
Quadrant C |
| Plot type | Count rate plots | Images |
|---|---|---|
| Comparison with Poisson distribution Blue bars denote a histogram of data divided into 1 sec bins. Red curve is a Poisson curve with rate = median count rate of data. |
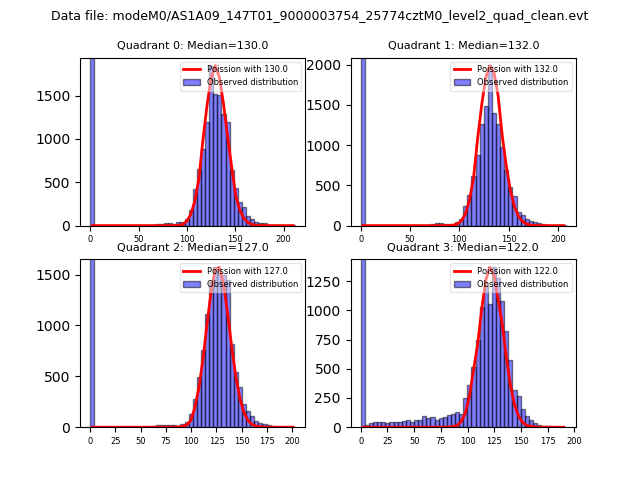 |
 |
| Quadrant-wise count rates Data is divided into 100 sec bins |
 |
|
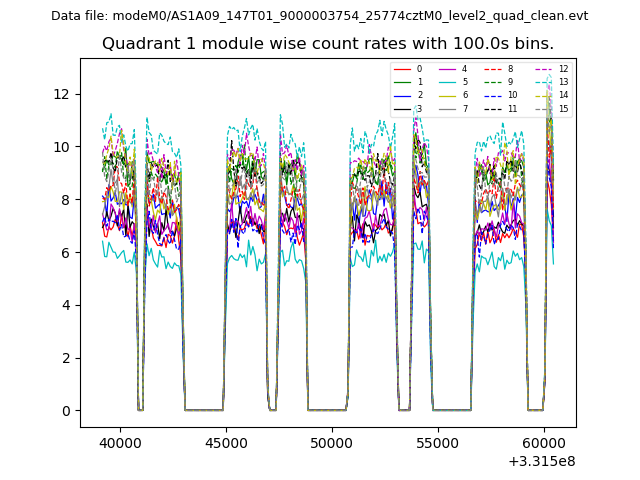
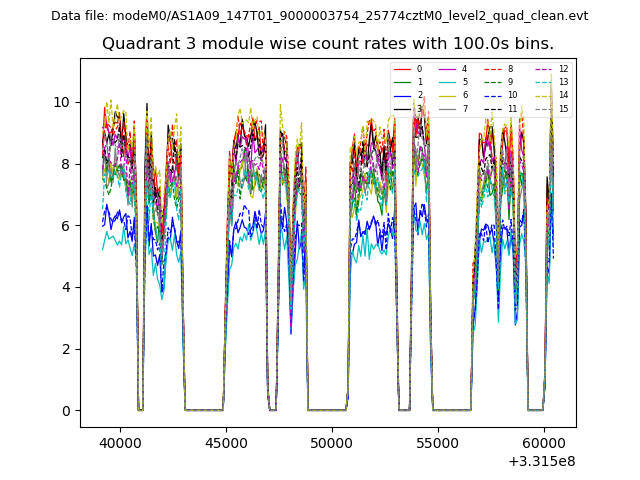
| Module-wise count rates for Quadrant A Data is divided into 100 sec bins |
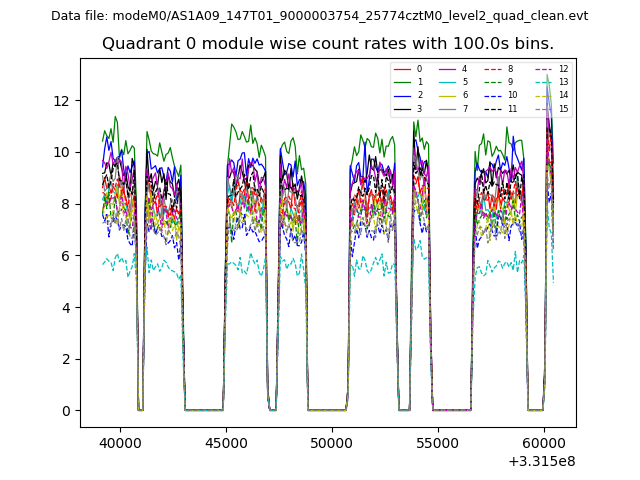 |
 |
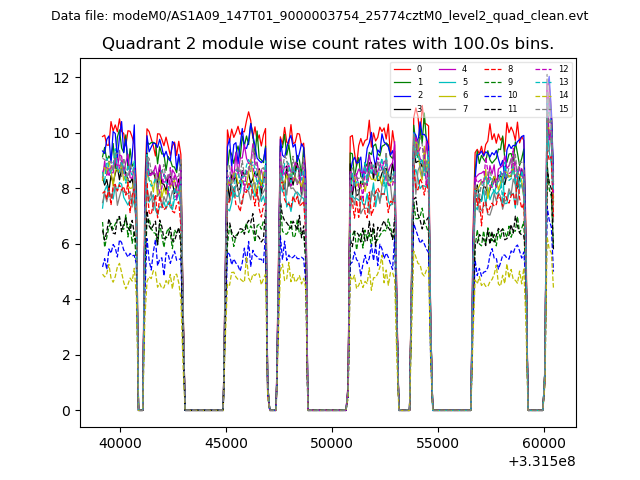
| Module-wise count rates for Quadrant B Data is divided into 100 sec bins |
 |
 |
| Module-wise count rates for Quadrant C Data is divided into 100 sec bins |
 |
 |
| Module-wise count rates for Quadrant D Data is divided into 100 sec bins |
 |
 |
| Parameter | Plot |
|---|---|
| CZT HV Monitor | 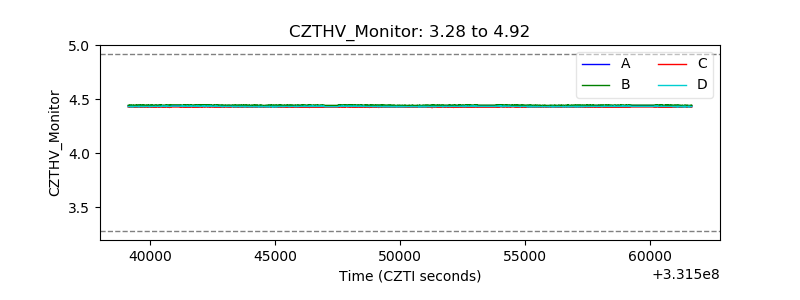 |
| D_VDD | 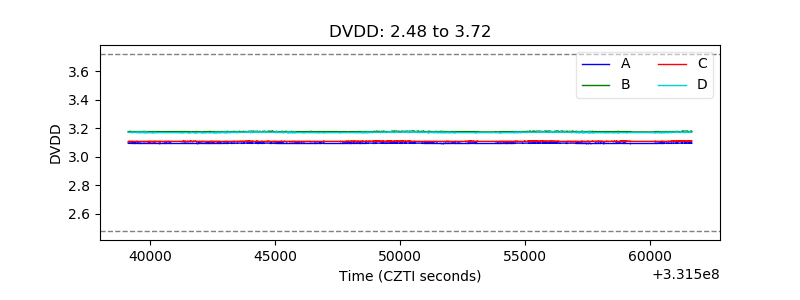 |
| Temperature 1 | 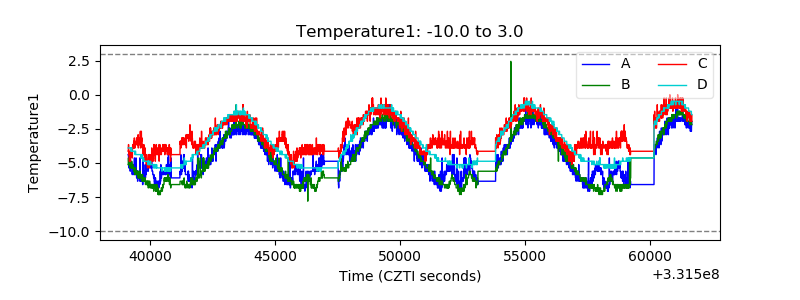 |
| Veto HV Monitor | 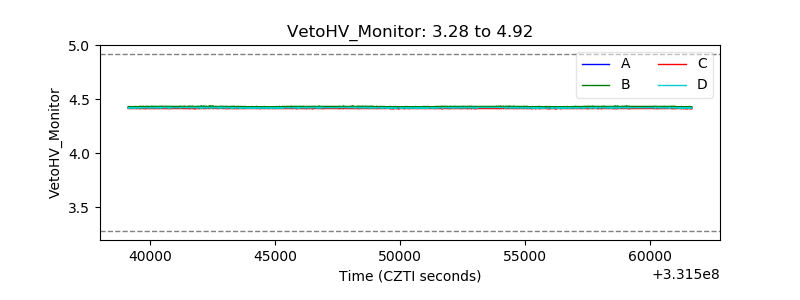 |
| Veto LLD | 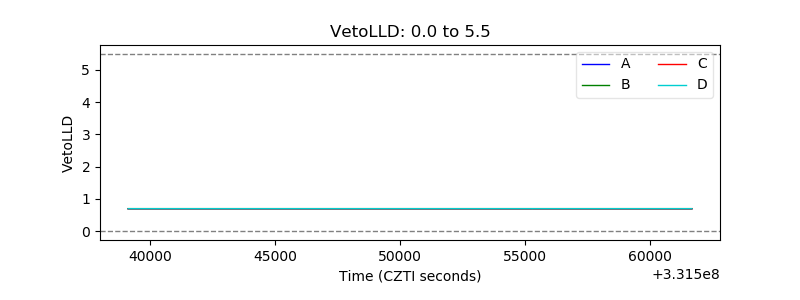 |
| Alpha Counter | 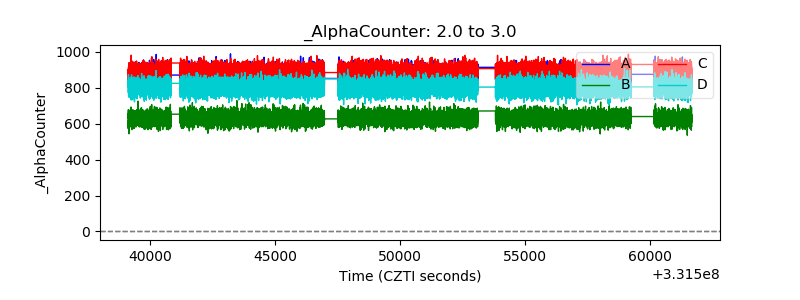 |
| _CPM_Rate |  |
| CZT Counter | 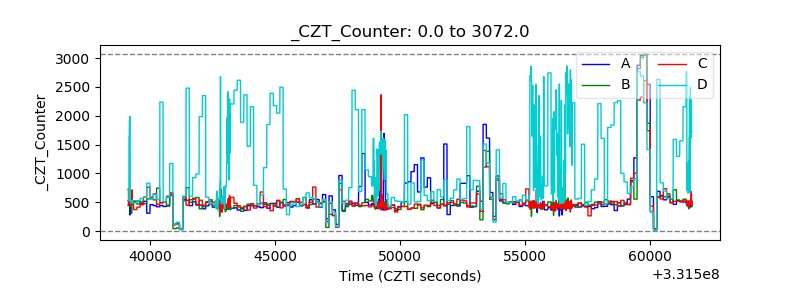 |
| +2.5 Volts monitor | 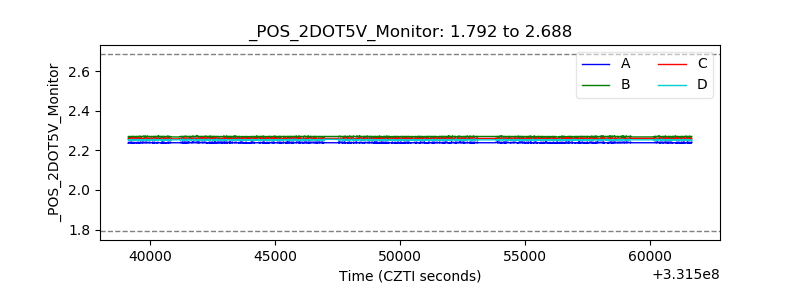 |
| +5 Volts monitor |  |
| _ROLL_ROT |  |
| _Roll_DEC | 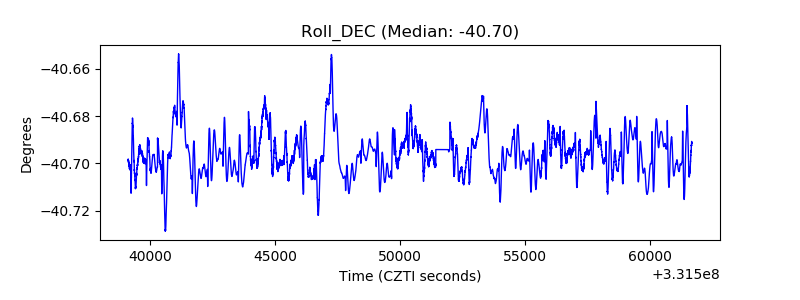 |
| _Roll_RA | 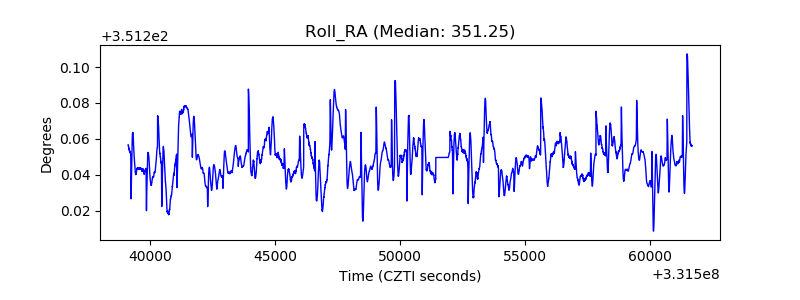 |
| Veto Counter |  |