| Param | Original file | Final file |
|---|---|---|
| Filename | modeM0/AS1A09_147T01_9000003754_25775cztM0_level2.evt | modeM0/AS1A09_147T01_9000003754_25775cztM0_level2_quad_clean.evt |
| Size (bytes) | 583,692,480 | 69,894,720 |
| Size | 556.7 MB | 66.7 MB |
| Events in quadrant A | 3,518,276 | 432,540 |
| Events in quadrant B | 3,394,863 | 438,499 |
| Events in quadrant C | 3,286,876 | 416,115 |
| Events in quadrant D | 7,027,931 | 366,571 |
| Mode M9 | |||
|---|---|---|---|
| Quadrant | BADHDUFLAG | Total packets | Discarded packets |
| A | 0 | 12 | 0 |
| B | 0 | 13 | 0 |
| C | 0 | 13 | 0 |
| D | 0 | 13 | 0 |
| Mode M0 | |||
|---|---|---|---|
| Quadrant | BADHDUFLAG | Total packets | Discarded packets |
| A | 0 | 14721 | 0 |
| B | 0 | 14292 | 0 |
| C | 0 | 13928 | 0 |
| D | 0 | 25438 | 0 |
| Quadrant | Total seconds | Saturated seconds | Saturation percentage |
|---|---|---|---|
| A | 6625 | 72 | 1.086792% |
| B | 6625 | 73 | 1.101887% |
| C | 6625 | 85 | 1.283019% |
| D | 6625 | 1129 | 17.041509% |
Noise dominated data is calculated using 1-second bins in cleaned event files. If a bin has >2000 counts, and if more than 50% of those come from <1% of pixels, then it is considered to be noise-dominated and hence unusable.
| Quadrant | # 1 sec bins | Bins with >0 counts | Bins with >2000 counts | High rate bins dominated by noise | Noise dominated (total time) | Noise dominated (detector-on time) | Marked lightcurve |
|---|---|---|---|---|---|---|---|
| A | 7680 | 6625 | 2 | 2 | 0.03% | 0.03% | 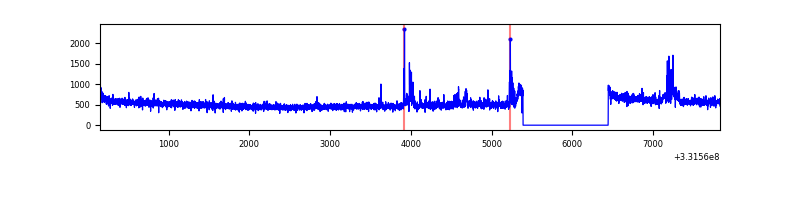 |
| B | 7680 | 6625 | 0 | 0 | 0.00% | 0.00% | 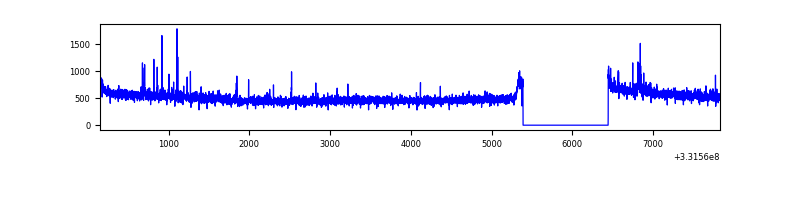 |
| C | 7680 | 6625 | 0 | 0 | 0.00% | 0.00% | 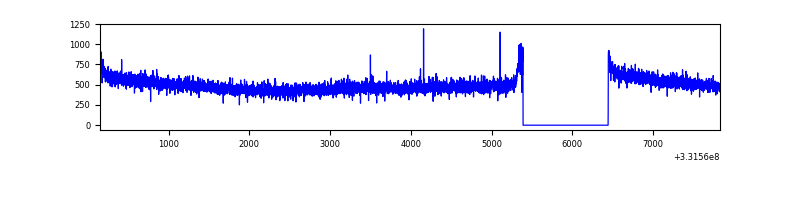 |
| D | 7680 | 6625 | 1001 | 1001 | 13.03% | 15.11% | 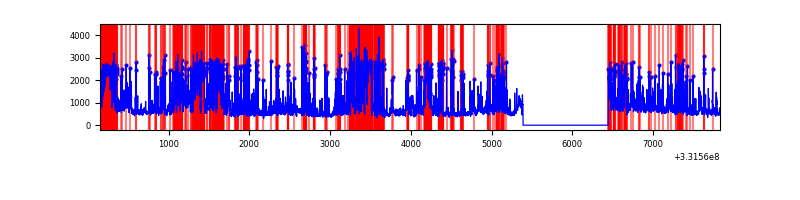 |
Top three noisy pixels from each quadrant. If the there are fewer than three noisy pixels in the level2.evt file, extra rows are filled as -1
| Pixel properties | Quadrant properties | ||||||
|---|---|---|---|---|---|---|---|
| Quadrant | DetID | PixID | Counts | Sigma | Mean | Median | Sigma |
| A | 0 | 13 | 200557 | 1171.88 | 852 | 834 | 170.4 |
| A | 0 | 143 | 17652 | 98.68 | 852 | 834 | 170.4 |
| A | 13 | 254 | 9916 | 53.29 | 852 | 834 | 170.4 |
| B | 0 | 190 | 33284 | 204.15 | 844 | 824 | 159.0 |
| B | 0 | 219 | 33249 | 203.93 | 844 | 824 | 159.0 |
| B | 12 | 111 | 18894 | 113.65 | 844 | 824 | 159.0 |
| C | 14 | 238 | 131037 | 700.57 | 807 | 815 | 185.9 |
| C | 3 | 233 | 5658 | 26.05 | 807 | 815 | 185.9 |
| C | 13 | 61 | 5459 | 24.98 | 807 | 815 | 185.9 |
| D | 1 | 52 | 2499969 | 13635.4 | 764 | 745 | 183.3 |
| D | 7 | 80 | 1330623 | 7255.62 | 764 | 745 | 183.3 |
| D | 8 | 195 | 196446 | 1067.71 | 764 | 745 | 183.3 |
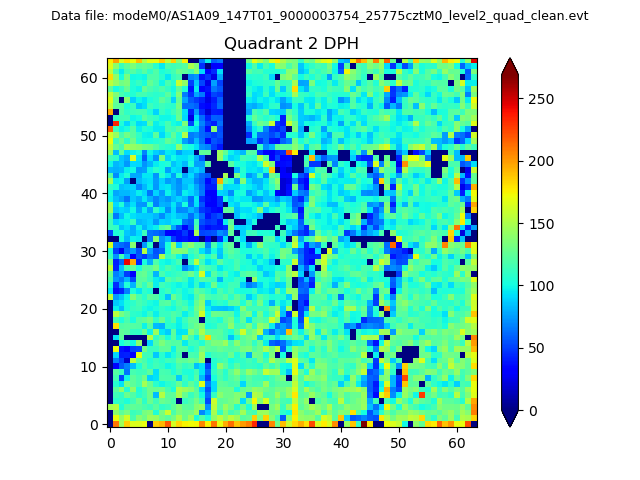
Histogram calculated using DETX and DETY for each event in the final _common_clean file
| Quadrant A | 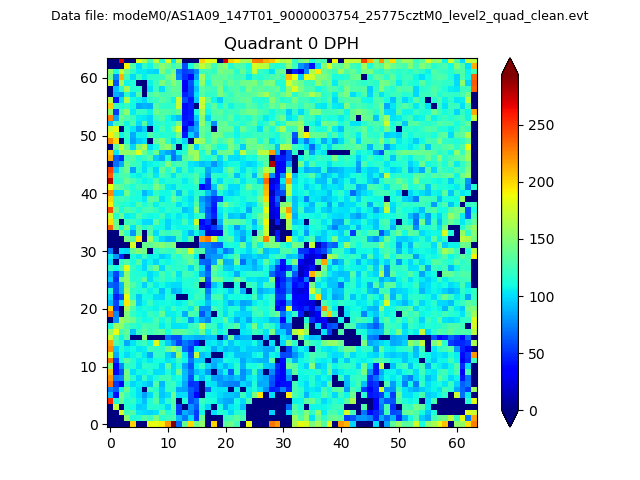 |
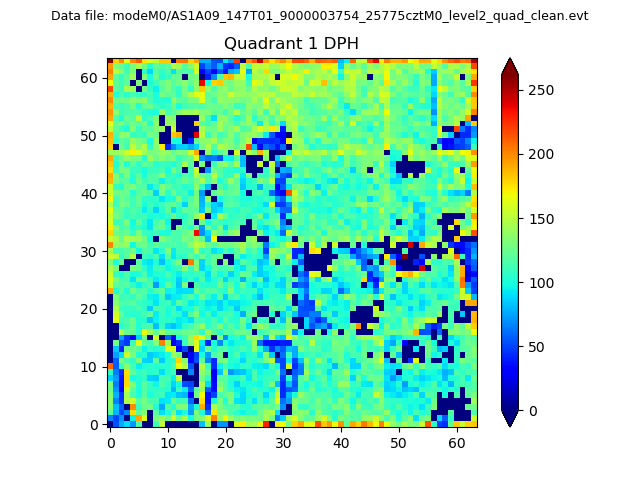 |
Quadrant B |
|---|---|---|---|
| Quadrant D | 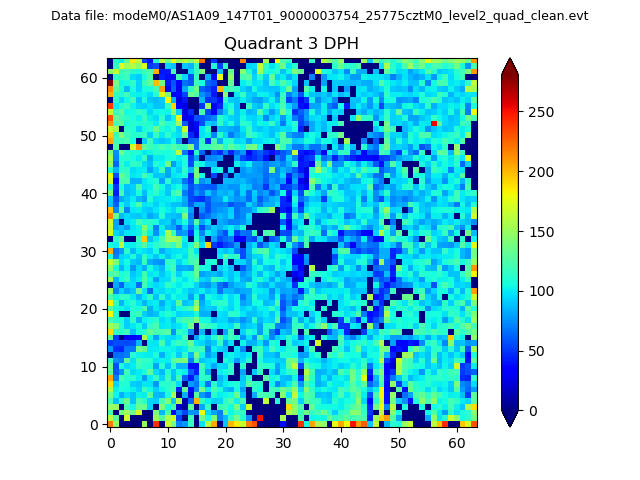 |
 |
Quadrant C |
| Plot type | Count rate plots | Images |
|---|---|---|
| Comparison with Poisson distribution Blue bars denote a histogram of data divided into 1 sec bins. Red curve is a Poisson curve with rate = median count rate of data. |
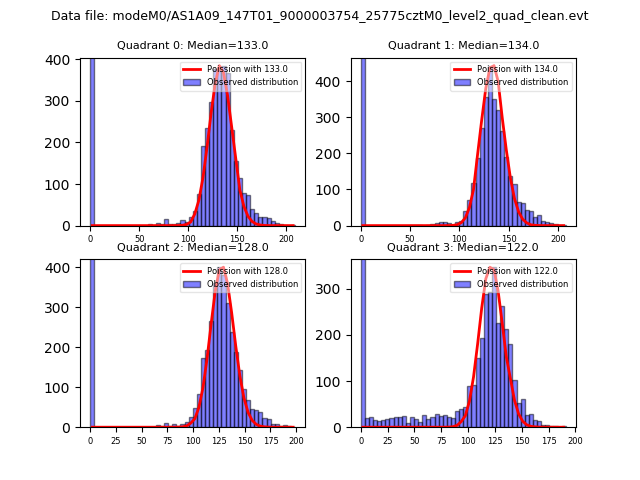 |
 |
| Quadrant-wise count rates Data is divided into 100 sec bins |
 |
|
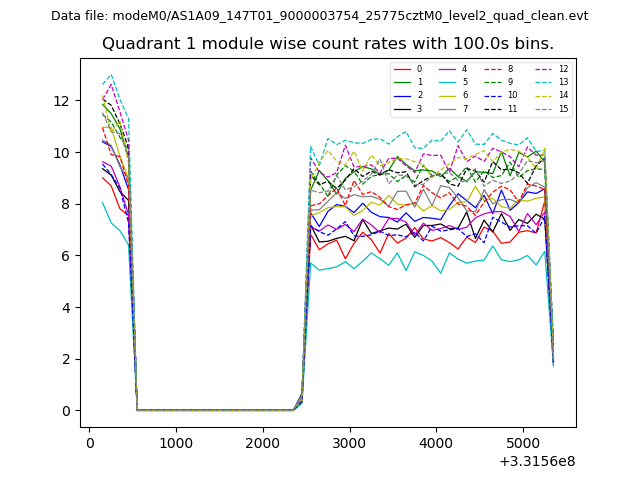
| Module-wise count rates for Quadrant A Data is divided into 100 sec bins |
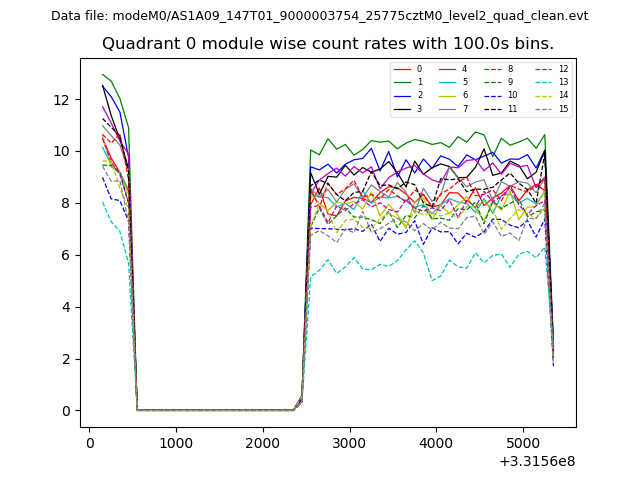 |
 |
| Module-wise count rates for Quadrant B Data is divided into 100 sec bins |
 |
 |
| Module-wise count rates for Quadrant C Data is divided into 100 sec bins |
 |
 |
| Module-wise count rates for Quadrant D Data is divided into 100 sec bins |
 |
 |
| Parameter | Plot |
|---|---|
| CZT HV Monitor | 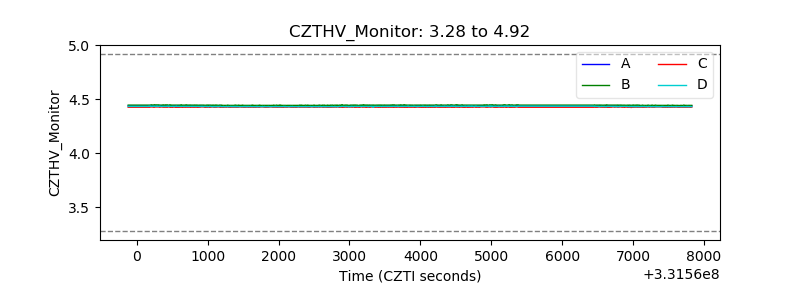 |
| D_VDD | 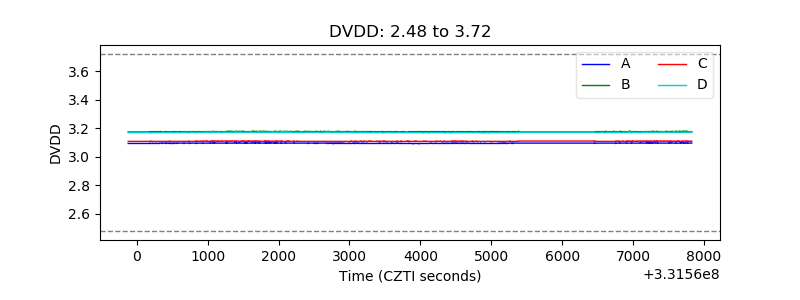 |
| Temperature 1 | 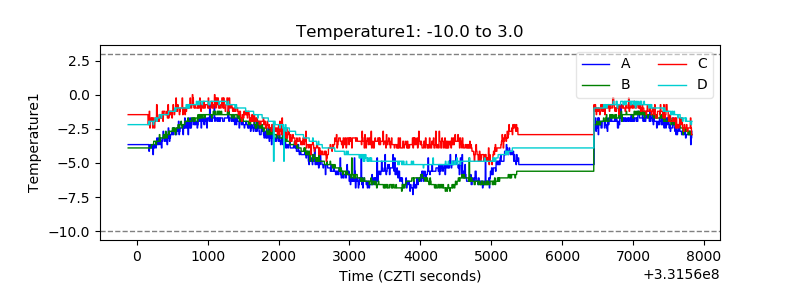 |
| Veto HV Monitor | 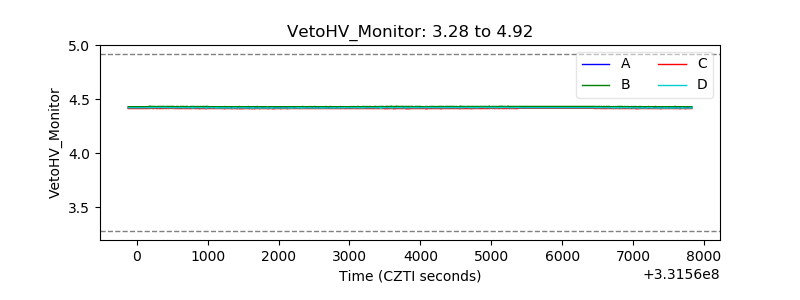 |
| Veto LLD | 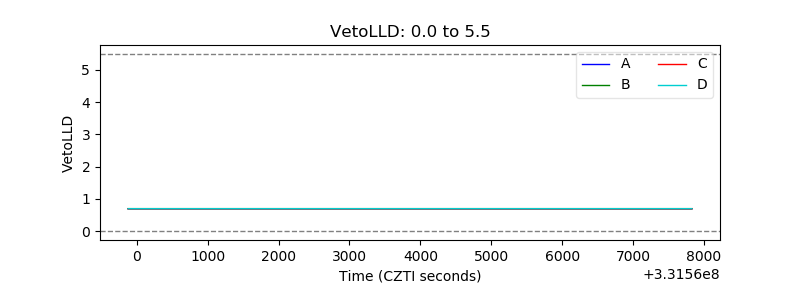 |
| Alpha Counter | 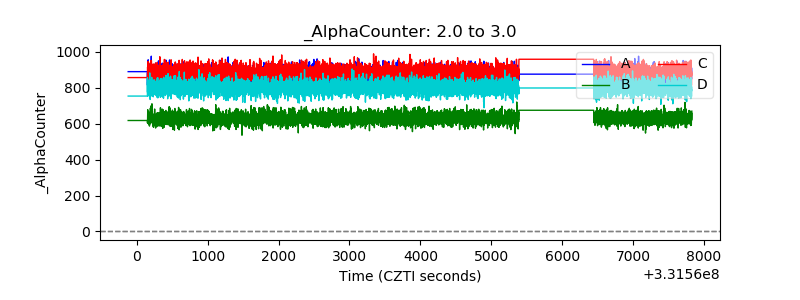 |
| _CPM_Rate | 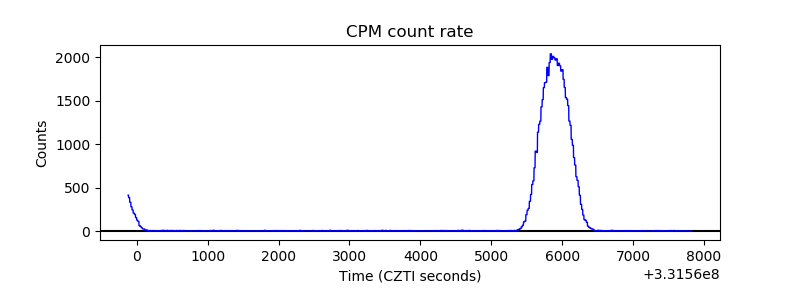 |
| CZT Counter | 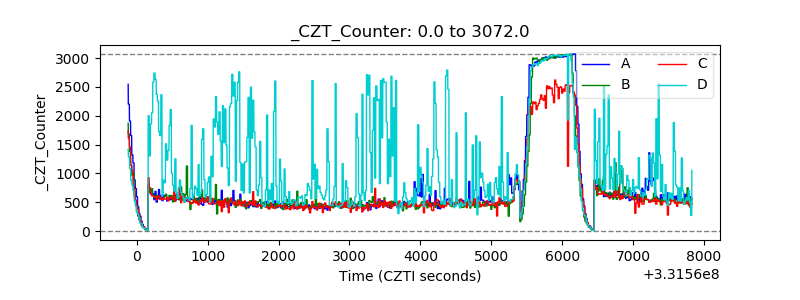 |
| +2.5 Volts monitor |  |
| +5 Volts monitor |  |
| _ROLL_ROT | 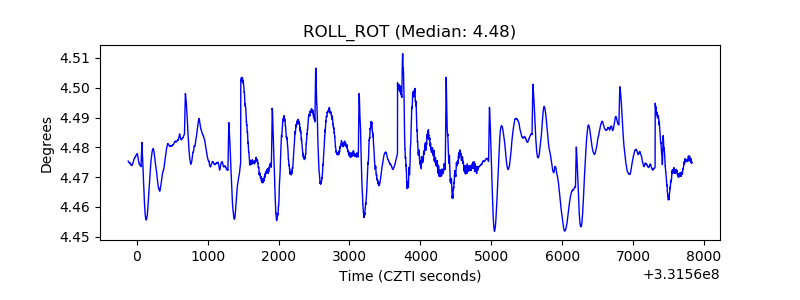 |
| _Roll_DEC | 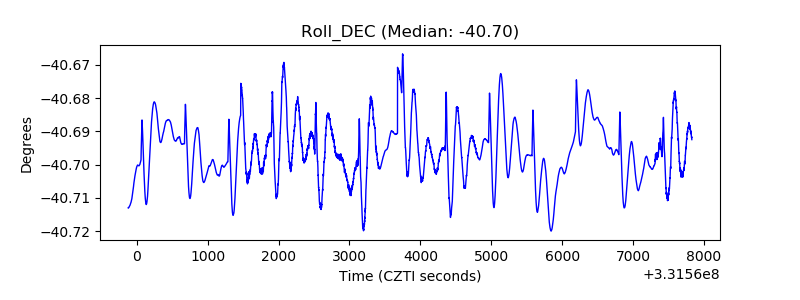 |
| _Roll_RA | 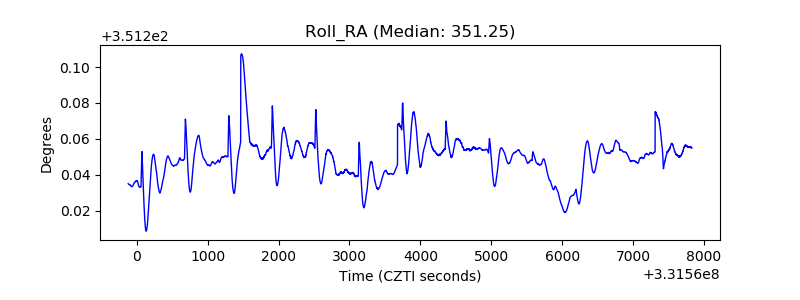 |
| Veto Counter | 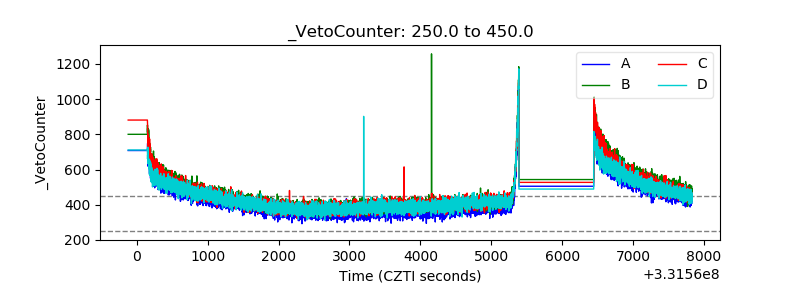 |