| Param | Original file | Final file |
|---|---|---|
| Filename | modeM0/AS1A09_147T01_9000003754_25777cztM0_level2.evt | modeM0/AS1A09_147T01_9000003754_25777cztM0_level2_quad_clean.evt |
| Size (bytes) | 552,381,120 | 69,312,960 |
| Size | 526.8 MB | 66.1 MB |
| Events in quadrant A | 3,698,460 | 426,318 |
| Events in quadrant B | 3,397,312 | 430,386 |
| Events in quadrant C | 3,283,346 | 405,663 |
| Events in quadrant D | 5,918,526 | 391,967 |
| Mode M9 | |||
|---|---|---|---|
| Quadrant | BADHDUFLAG | Total packets | Discarded packets |
| A | 0 | 13 | 0 |
| B | 0 | 14 | 0 |
| C | 0 | 14 | 0 |
| D | 0 | 14 | 0 |
| Mode M0 | |||
|---|---|---|---|
| Quadrant | BADHDUFLAG | Total packets | Discarded packets |
| A | 0 | 15221 | 0 |
| B | 0 | 14298 | 0 |
| C | 0 | 13786 | 0 |
| D | 0 | 21938 | 0 |
| Quadrant | Total seconds | Saturated seconds | Saturation percentage |
|---|---|---|---|
| A | 6364 | 63 | 0.989943% |
| B | 6364 | 57 | 0.895663% |
| C | 6364 | 73 | 1.147077% |
| D | 6364 | 652 | 10.245129% |
Noise dominated data is calculated using 1-second bins in cleaned event files. If a bin has >2000 counts, and if more than 50% of those come from <1% of pixels, then it is considered to be noise-dominated and hence unusable.
| Quadrant | # 1 sec bins | Bins with >0 counts | Bins with >2000 counts | High rate bins dominated by noise | Noise dominated (total time) | Noise dominated (detector-on time) | Marked lightcurve |
|---|---|---|---|---|---|---|---|
| A | 7574 | 6364 | 3 | 3 | 0.04% | 0.05% | 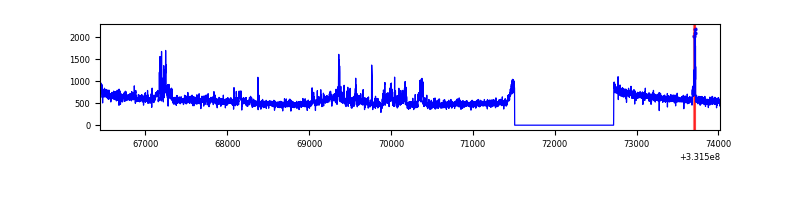 |
| B | 7574 | 6364 | 0 | 0 | 0.00% | 0.00% | 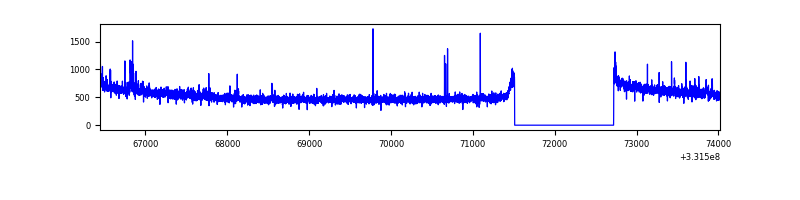 |
| C | 7574 | 6364 | 0 | 0 | 0.00% | 0.00% | 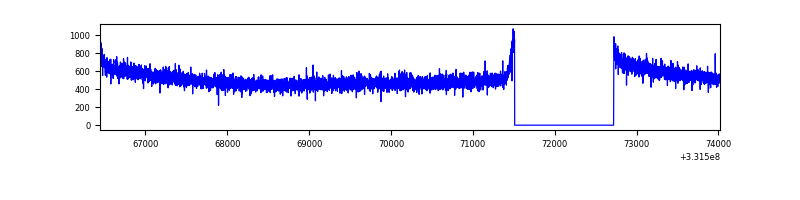 |
| D | 7573 | 6363 | 573 | 573 | 7.57% | 9.01% | 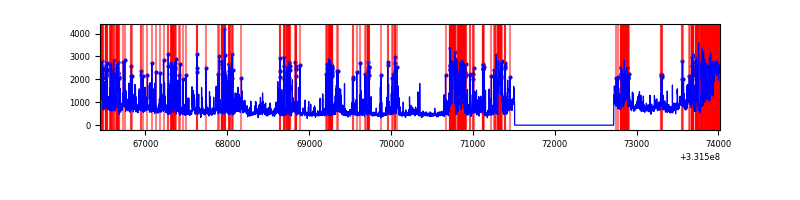 |
Top three noisy pixels from each quadrant. If the there are fewer than three noisy pixels in the level2.evt file, extra rows are filled as -1
| Pixel properties | Quadrant properties | ||||||
|---|---|---|---|---|---|---|---|
| Quadrant | DetID | PixID | Counts | Sigma | Mean | Median | Sigma |
| A | 0 | 13 | 385263 | 2263.7 | 856 | 842 | 169.8 |
| A | 6 | 16 | 11034 | 60.02 | 856 | 842 | 169.8 |
| A | 13 | 254 | 9515 | 51.07 | 856 | 842 | 169.8 |
| B | 0 | 190 | 29386 | 180.88 | 850 | 832 | 157.9 |
| B | 0 | 219 | 26975 | 165.6 | 850 | 832 | 157.9 |
| B | 12 | 111 | 18423 | 111.43 | 850 | 832 | 157.9 |
| C | 14 | 238 | 131910 | 709.57 | 807 | 813 | 184.8 |
| C | 3 | 233 | 7093 | 33.99 | 807 | 813 | 184.8 |
| C | 13 | 61 | 5701 | 26.46 | 807 | 813 | 184.8 |
| D | 7 | 80 | 1859150 | 9908.51 | 788 | 769 | 187.6 |
| D | 1 | 52 | 786571 | 4189.74 | 788 | 769 | 187.6 |
| D | 8 | 195 | 233813 | 1242.54 | 788 | 769 | 187.6 |
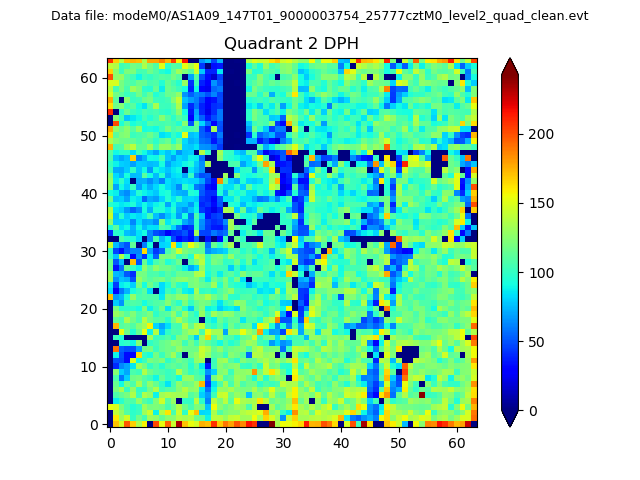
Histogram calculated using DETX and DETY for each event in the final _common_clean file
| Quadrant A | 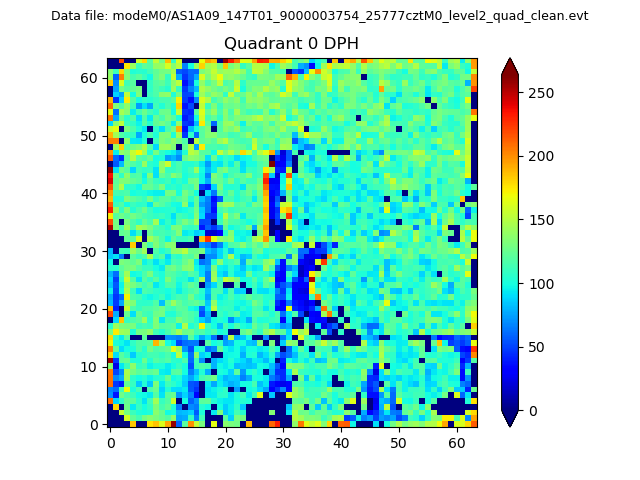 |
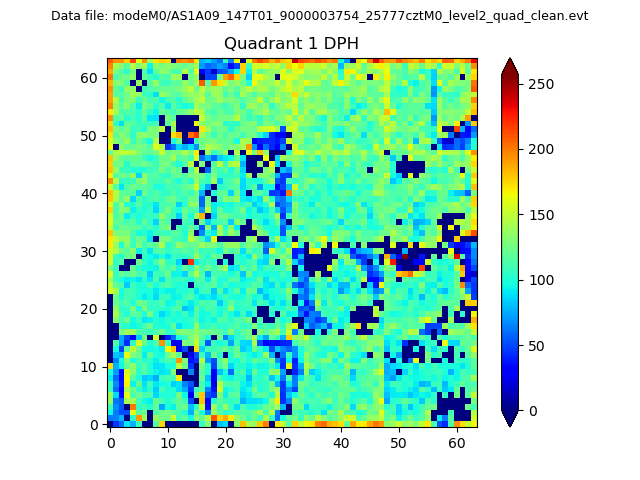 |
Quadrant B |
|---|---|---|---|
| Quadrant D | 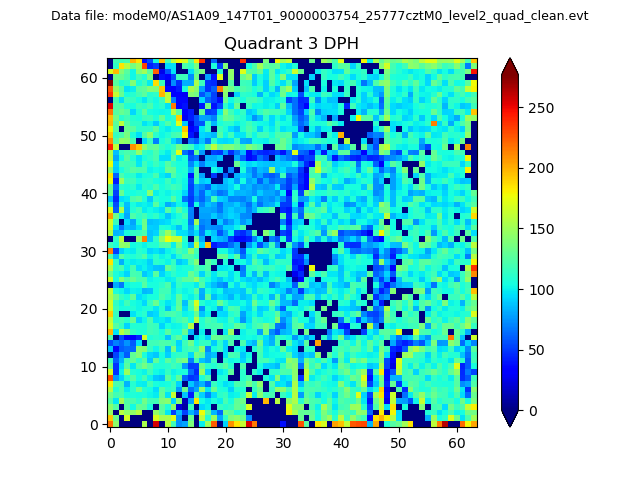 |
 |
Quadrant C |
| Plot type | Count rate plots | Images |
|---|---|---|
| Comparison with Poisson distribution Blue bars denote a histogram of data divided into 1 sec bins. Red curve is a Poisson curve with rate = median count rate of data. |
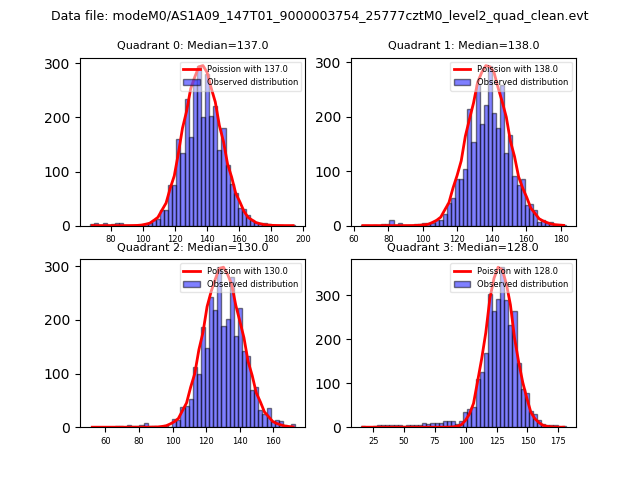 |
 |
| Quadrant-wise count rates Data is divided into 100 sec bins |
 |
|
| Module-wise count rates for Quadrant A Data is divided into 100 sec bins |
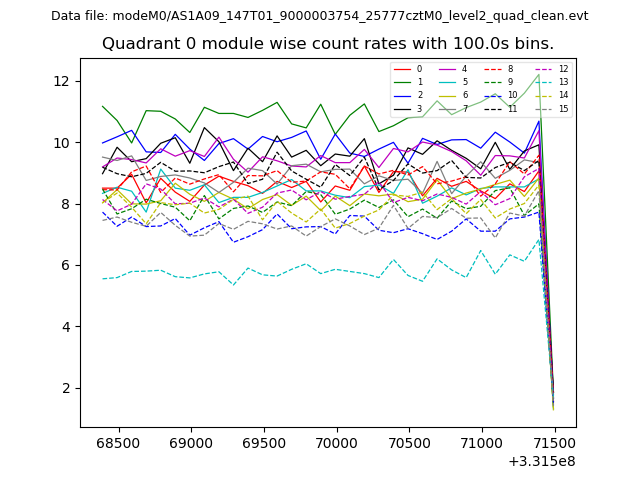 |
 |
| Module-wise count rates for Quadrant B Data is divided into 100 sec bins |
 |
 |
| Module-wise count rates for Quadrant C Data is divided into 100 sec bins |
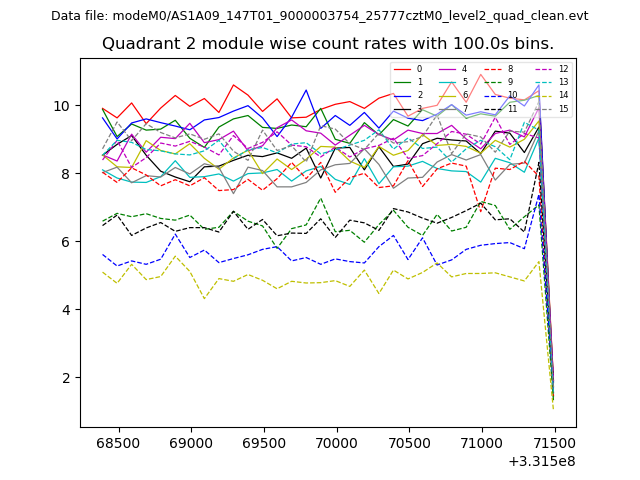 |
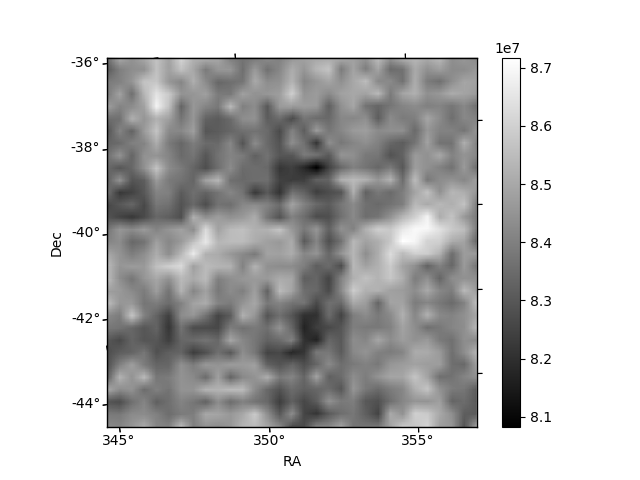 |
| Module-wise count rates for Quadrant D Data is divided into 100 sec bins |
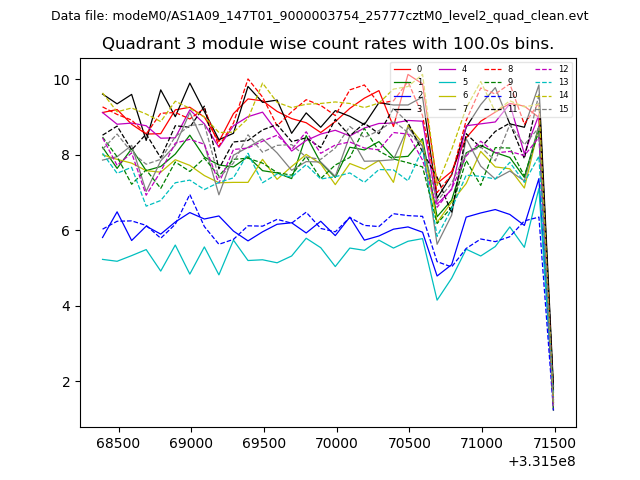 |
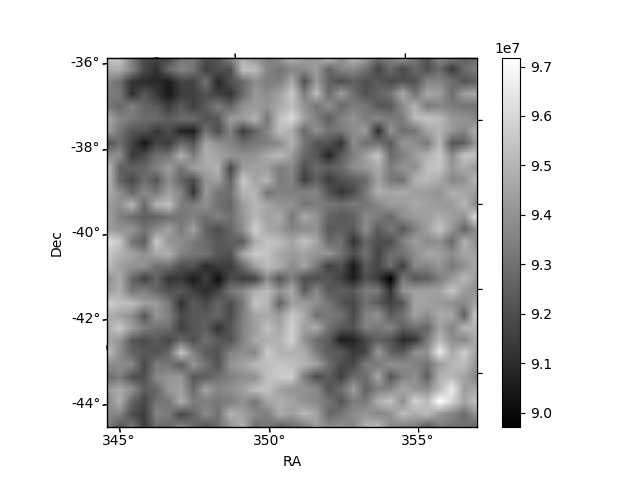 |
| Parameter | Plot |
|---|---|
| CZT HV Monitor |  |
| D_VDD | 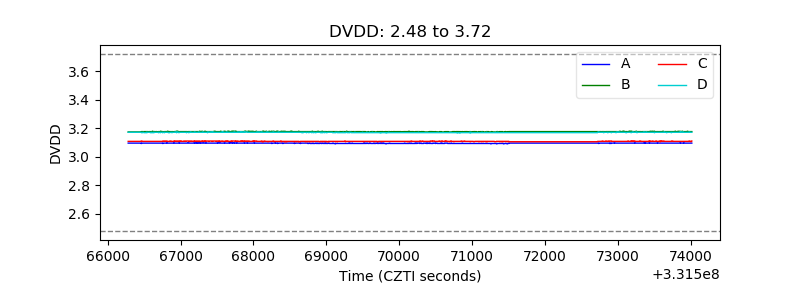 |
| Temperature 1 | 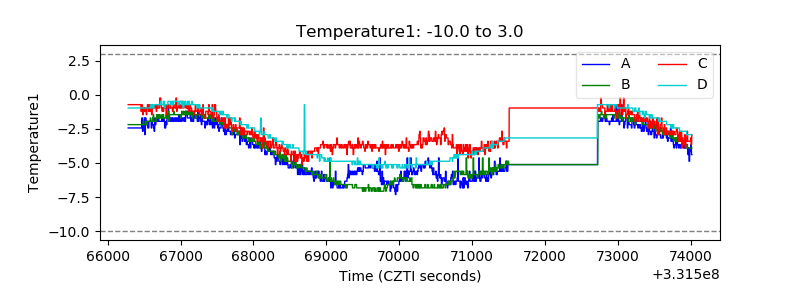 |
| Veto HV Monitor | 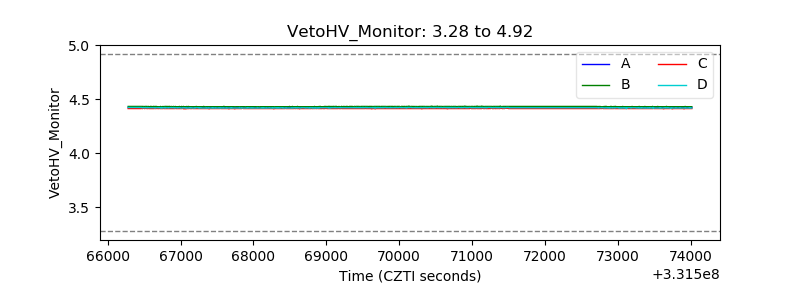 |
| Veto LLD | 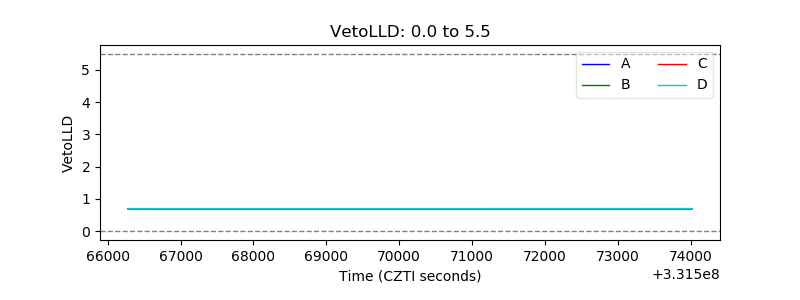 |
| Alpha Counter |  |
| _CPM_Rate |  |
| CZT Counter | 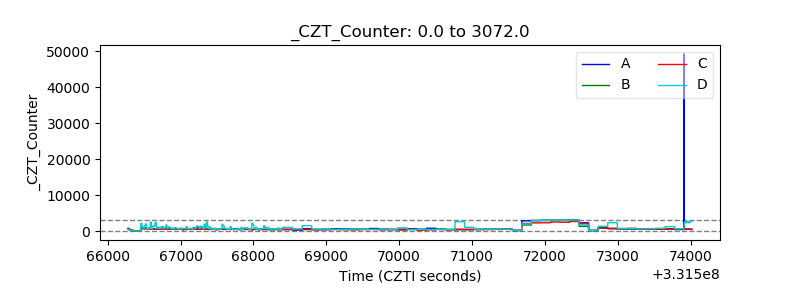 |
| +2.5 Volts monitor |  |
| +5 Volts monitor |  |
| _ROLL_ROT | 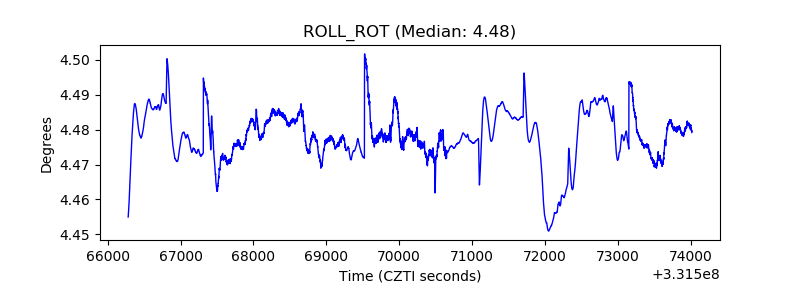 |
| _Roll_DEC | 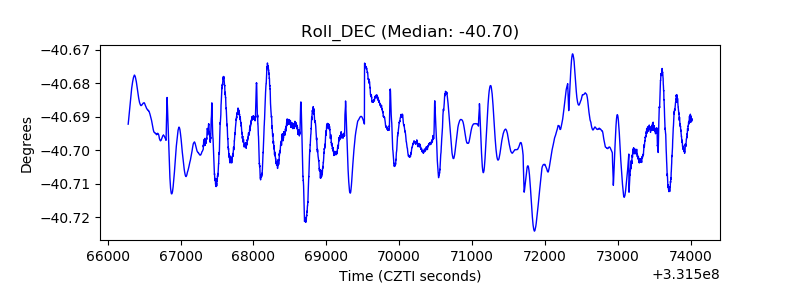 |
| _Roll_RA | 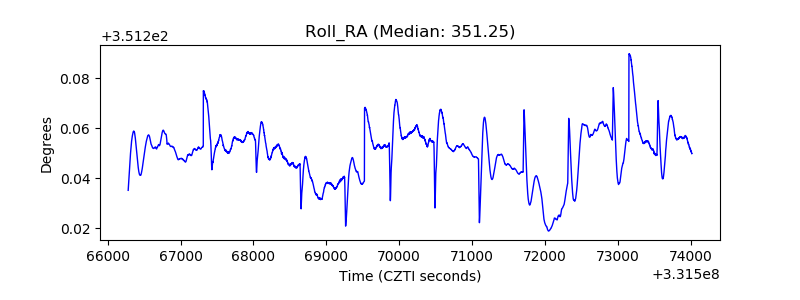 |
| Veto Counter |  |