| Param | Original file | Final file |
|---|---|---|
| Filename | modeM0/AS1A09_147T01_9000003754_25778cztM0_level2.evt | modeM0/AS1A09_147T01_9000003754_25778cztM0_level2_quad_clean.evt |
| Size (bytes) | 469,828,800 | 79,263,360 |
| Size | 448.1 MB | 75.6 MB |
| Events in quadrant A | 3,254,644 | 510,754 |
| Events in quadrant B | 3,030,021 | 524,157 |
| Events in quadrant C | 2,966,728 | 490,989 |
| Events in quadrant D | 4,597,518 | 482,667 |
| Mode M9 | |||
|---|---|---|---|
| Quadrant | BADHDUFLAG | Total packets | Discarded packets |
| A | 0 | 14 | 0 |
| B | 0 | 14 | 0 |
| C | 0 | 14 | 0 |
| D | 0 | 14 | 0 |
| Mode M0 | |||
|---|---|---|---|
| Quadrant | BADHDUFLAG | Total packets | Discarded packets |
| A | 0 | 13256 | 0 |
| B | 0 | 12508 | 0 |
| C | 0 | 12193 | 0 |
| D | 0 | 17381 | 0 |
| Quadrant | Total seconds | Saturated seconds | Saturation percentage |
|---|---|---|---|
| A | 5606 | 108 | 1.926507% |
| B | 5607 | 68 | 1.212770% |
| C | 5607 | 66 | 1.177100% |
| D | 5607 | 443 | 7.900838% |
Noise dominated data is calculated using 1-second bins in cleaned event files. If a bin has >2000 counts, and if more than 50% of those come from <1% of pixels, then it is considered to be noise-dominated and hence unusable.
| Quadrant | # 1 sec bins | Bins with >0 counts | Bins with >2000 counts | High rate bins dominated by noise | Noise dominated (total time) | Noise dominated (detector-on time) | Marked lightcurve |
|---|---|---|---|---|---|---|---|
| A | 6921 | 5606 | 40 | 40 | 0.58% | 0.71% | 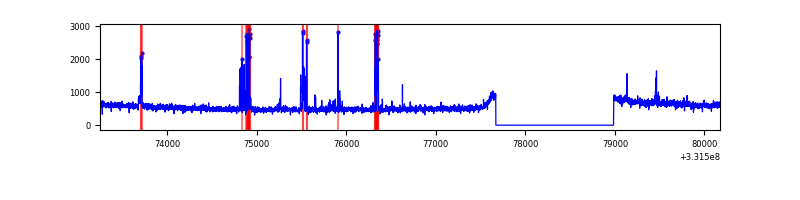 |
| B | 6922 | 5607 | 0 | 0 | 0.00% | 0.00% | 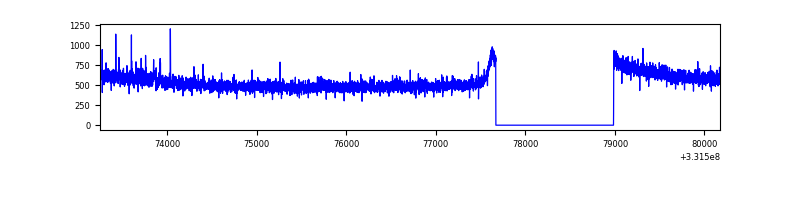 |
| C | 6922 | 5607 | 0 | 0 | 0.00% | 0.00% | 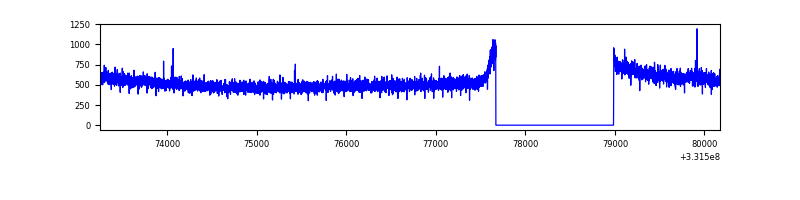 |
| D | 6922 | 5607 | 378 | 378 | 5.46% | 6.74% | 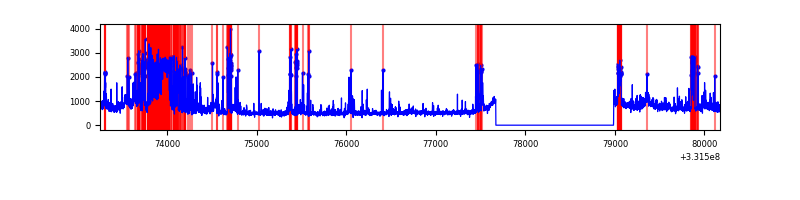 |
Top three noisy pixels from each quadrant. If the there are fewer than three noisy pixels in the level2.evt file, extra rows are filled as -1
| Pixel properties | Quadrant properties | ||||||
|---|---|---|---|---|---|---|---|
| Quadrant | DetID | PixID | Counts | Sigma | Mean | Median | Sigma |
| A | 0 | 13 | 301372 | 1991.0 | 765 | 751 | 151.0 |
| A | 13 | 254 | 7591 | 45.3 | 765 | 751 | 151.0 |
| A | 0 | 226 | 6785 | 39.96 | 765 | 751 | 151.0 |
| B | 12 | 111 | 16077 | 109.22 | 765 | 748 | 140.3 |
| B | 11 | 111 | 14245 | 96.17 | 765 | 748 | 140.3 |
| B | 0 | 219 | 12852 | 86.24 | 765 | 748 | 140.3 |
| C | 14 | 238 | 118775 | 702.02 | 728 | 733 | 168.1 |
| C | 3 | 233 | 10985 | 60.97 | 728 | 733 | 168.1 |
| C | 13 | 61 | 5018 | 25.48 | 728 | 733 | 168.1 |
| D | 7 | 80 | 1287781 | 7494.35 | 714 | 697 | 171.7 |
| D | 1 | 52 | 331718 | 1927.45 | 714 | 697 | 171.7 |
| D | 8 | 195 | 199528 | 1157.74 | 714 | 697 | 171.7 |
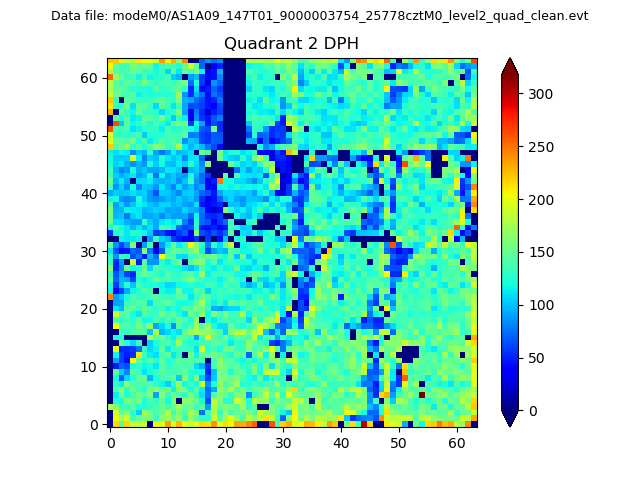
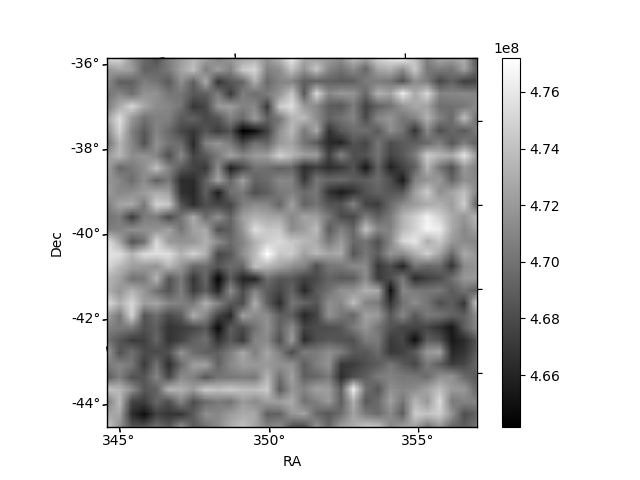
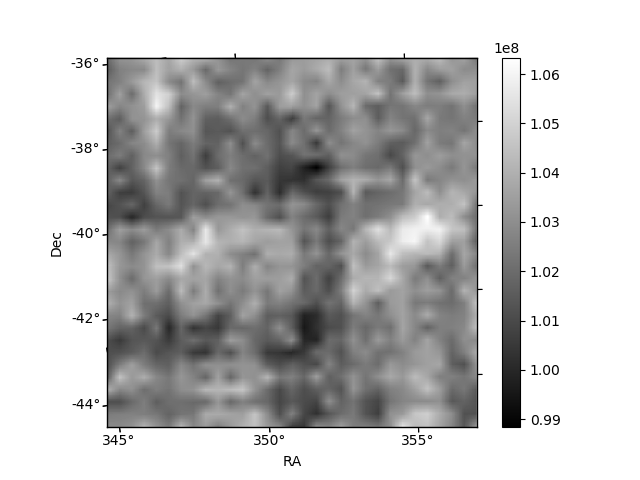
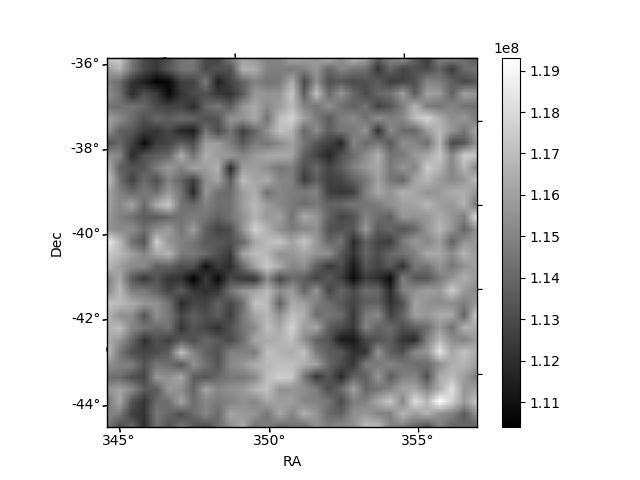
Histogram calculated using DETX and DETY for each event in the final _common_clean file
| Quadrant A | 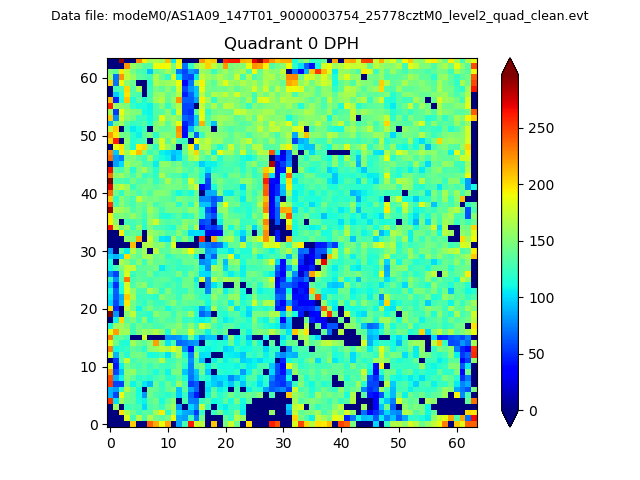 |
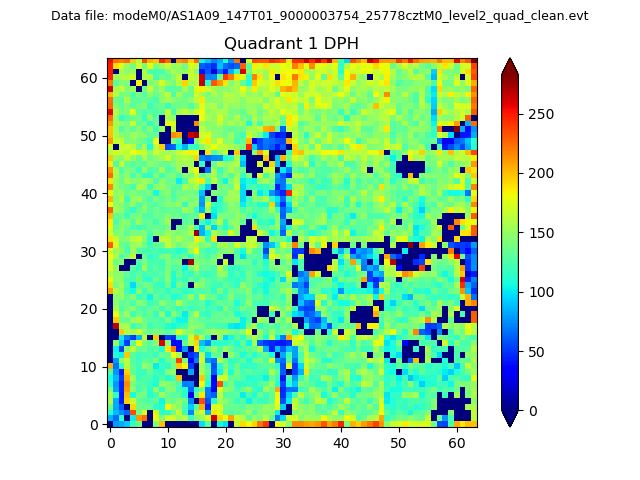 |
Quadrant B |
|---|---|---|---|
| Quadrant D | 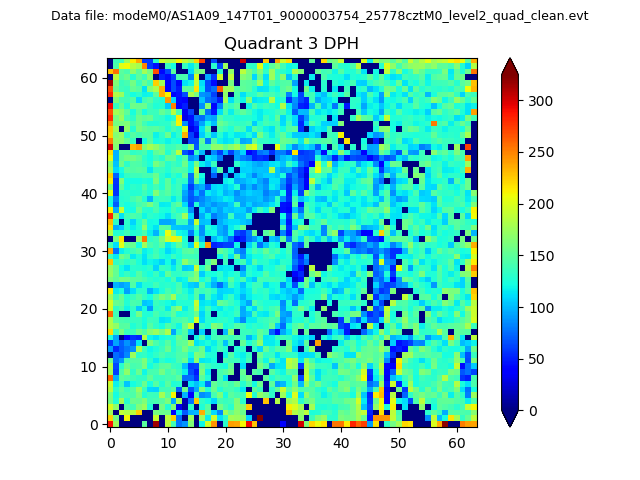 |
 |
Quadrant C |
| Plot type | Count rate plots | Images |
|---|---|---|
| Comparison with Poisson distribution Blue bars denote a histogram of data divided into 1 sec bins. Red curve is a Poisson curve with rate = median count rate of data. |
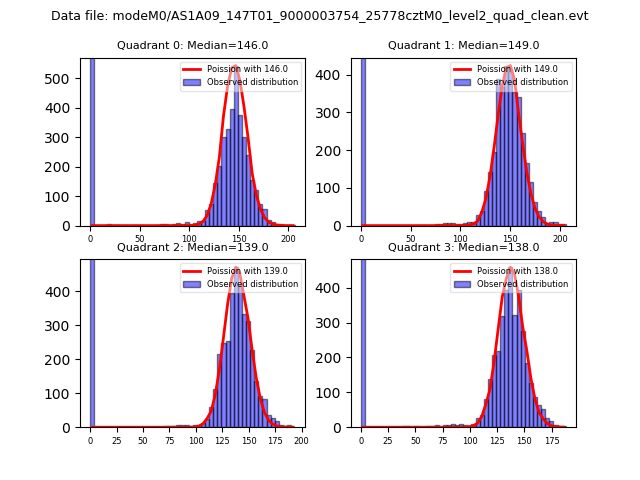 |
 |
| Quadrant-wise count rates Data is divided into 100 sec bins |
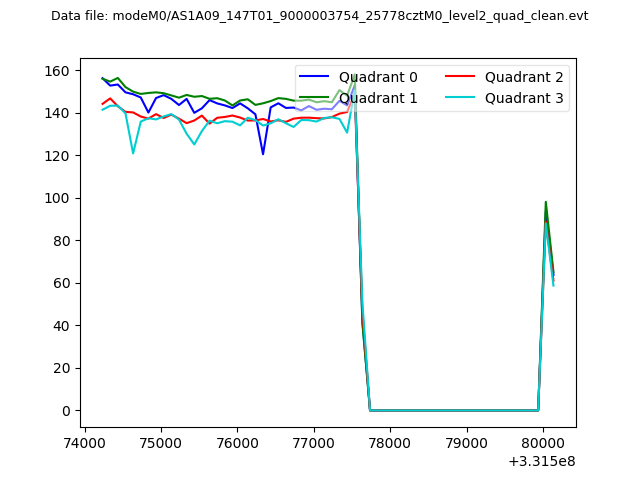 |
|
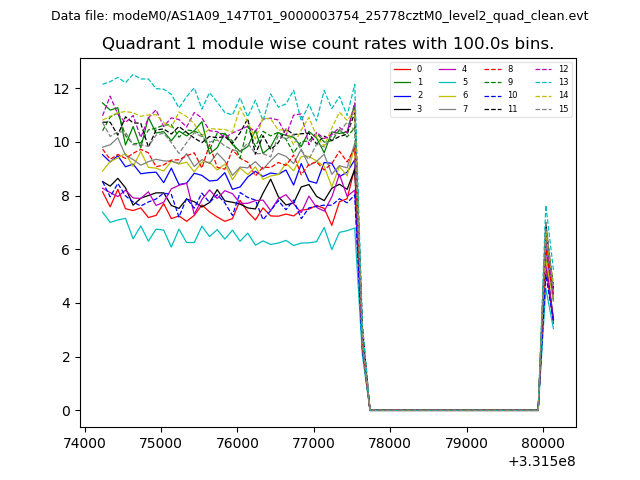
| Module-wise count rates for Quadrant A Data is divided into 100 sec bins |
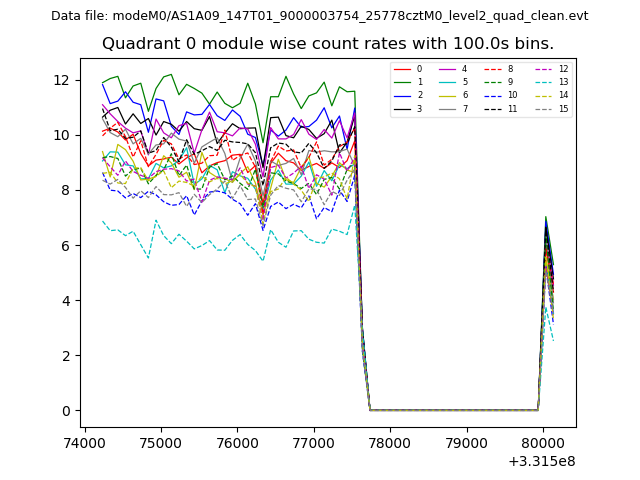 |
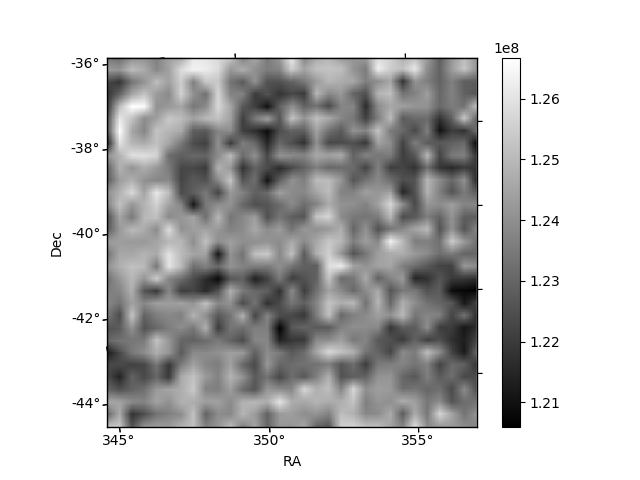 |
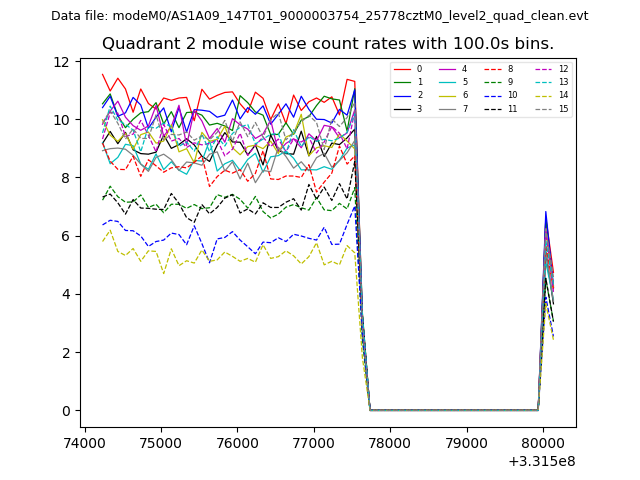
| Module-wise count rates for Quadrant B Data is divided into 100 sec bins |
 |
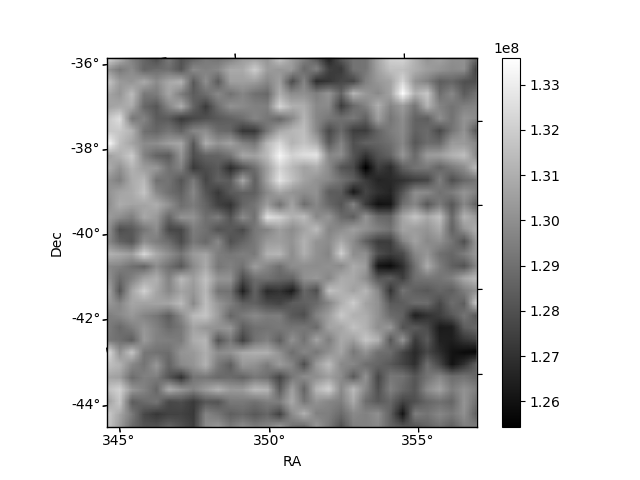 |
| Module-wise count rates for Quadrant C Data is divided into 100 sec bins |
 |
 |
| Module-wise count rates for Quadrant D Data is divided into 100 sec bins |
 |
 |
| Parameter | Plot |
|---|---|
| CZT HV Monitor | 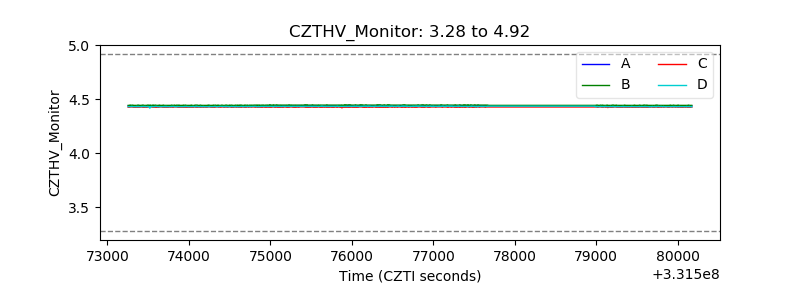 |
| D_VDD | 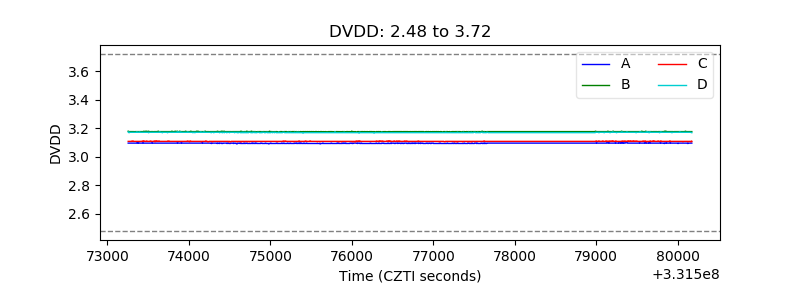 |
| Temperature 1 | 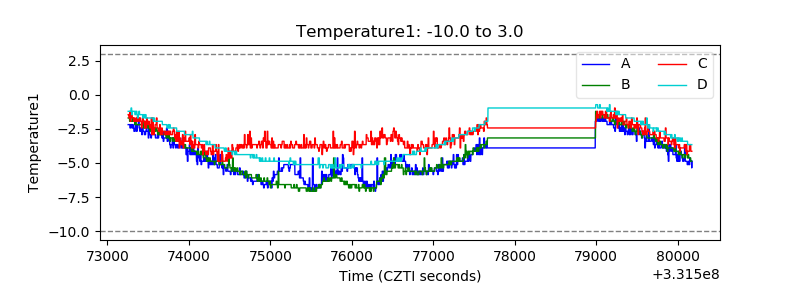 |
| Veto HV Monitor | 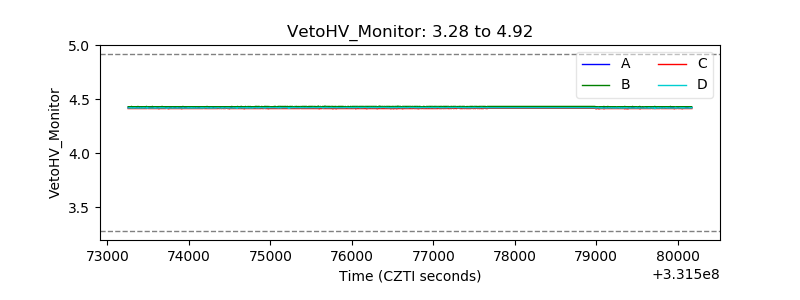 |
| Veto LLD | 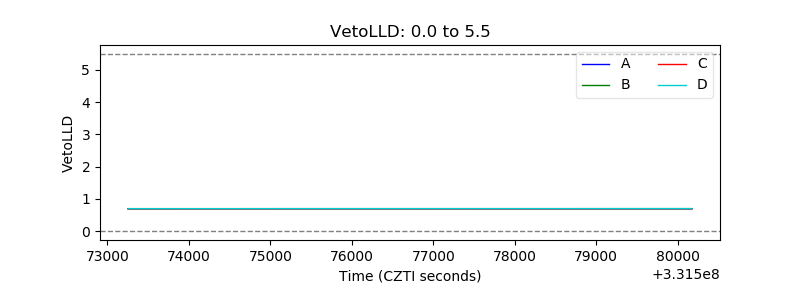 |
| Alpha Counter | 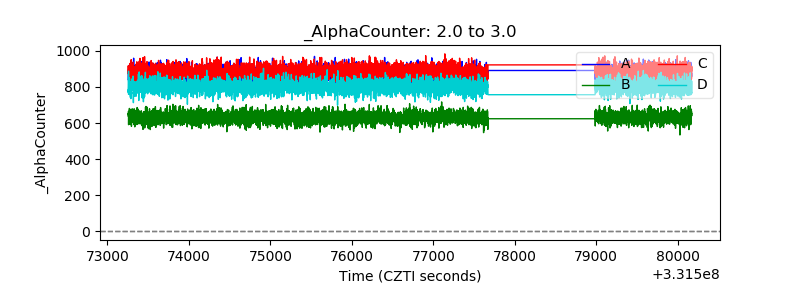 |
| _CPM_Rate | 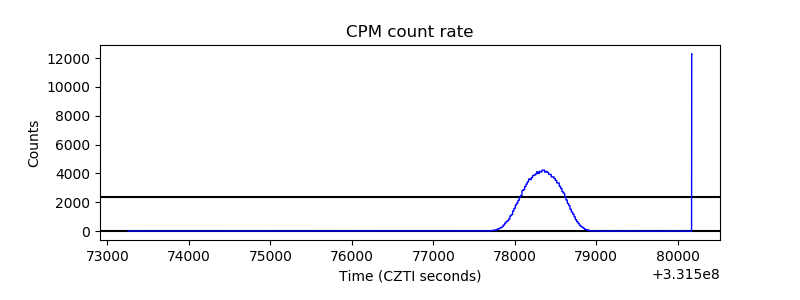 |
| CZT Counter | 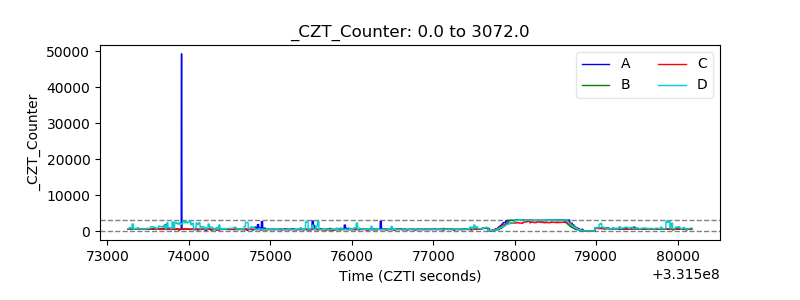 |
| +2.5 Volts monitor | 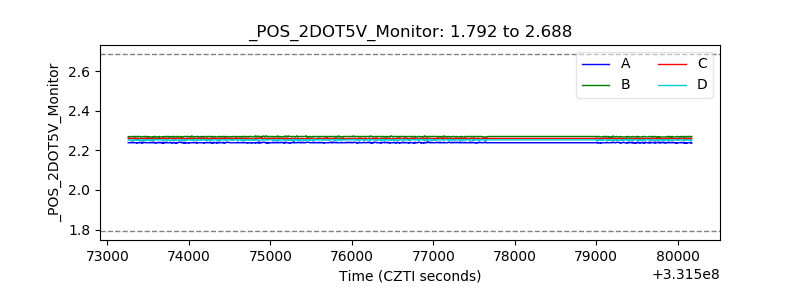 |
| +5 Volts monitor |  |
| _ROLL_ROT | 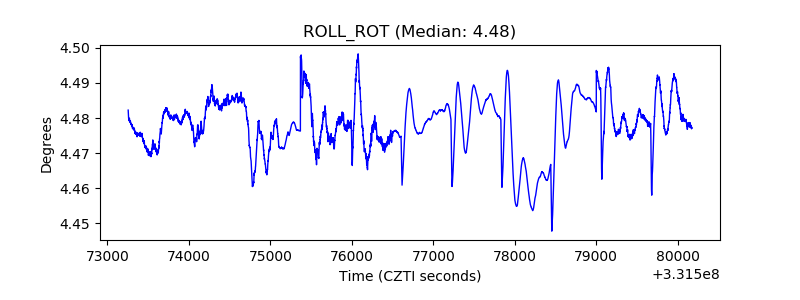 |
| _Roll_DEC | 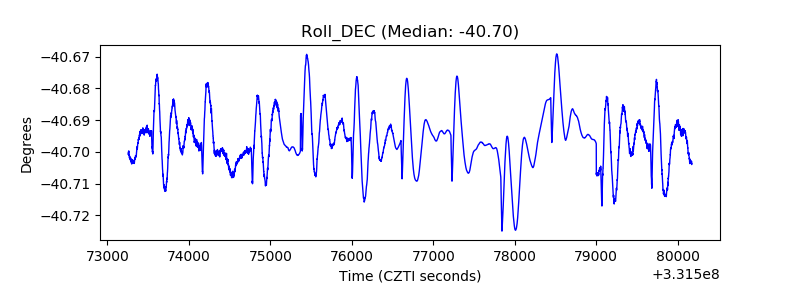 |
| _Roll_RA | 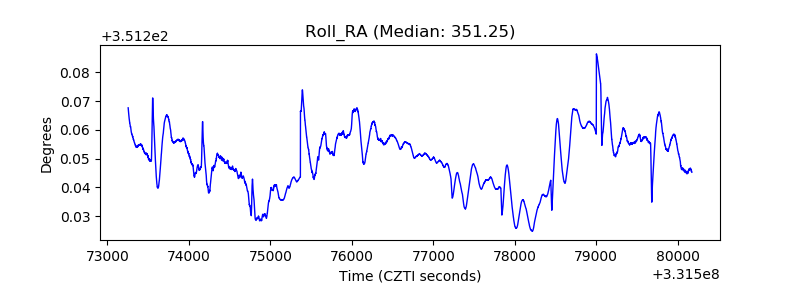 |
| Veto Counter | 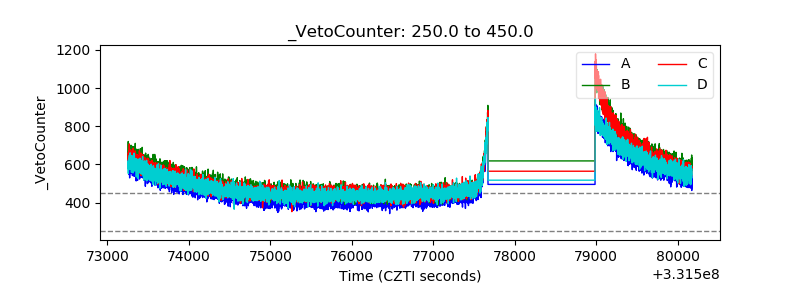 |