| Param | Original file | Final file |
|---|---|---|
| Filename | modeM0/AS1A09_147T01_9000003754_25779cztM0_level2.evt | modeM0/AS1A09_147T01_9000003754_25779cztM0_level2_quad_clean.evt |
| Size (bytes) | 502,171,200 | 99,181,440 |
| Size | 478.9 MB | 94.6 MB |
| Events in quadrant A | 3,764,724 | 657,142 |
| Events in quadrant B | 3,386,395 | 674,059 |
| Events in quadrant C | 3,337,854 | 629,255 |
| Events in quadrant D | 4,308,778 | 620,452 |
| Mode M9 | |||
|---|---|---|---|
| Quadrant | BADHDUFLAG | Total packets | Discarded packets |
| A | 0 | 14 | 0 |
| B | 0 | 15 | 0 |
| C | 0 | 15 | 0 |
| D | 0 | 15 | 0 |
| Mode M0 | |||
|---|---|---|---|
| Quadrant | BADHDUFLAG | Total packets | Discarded packets |
| A | 0 | 15235 | 0 |
| B | 0 | 13892 | 0 |
| C | 0 | 13660 | 0 |
| D | 0 | 16869 | 0 |
| Quadrant | Total seconds | Saturated seconds | Saturation percentage |
|---|---|---|---|
| A | 6059 | 156 | 2.574682% |
| B | 6059 | 62 | 1.023271% |
| C | 6059 | 83 | 1.369863% |
| D | 6059 | 182 | 3.003796% |
Noise dominated data is calculated using 1-second bins in cleaned event files. If a bin has >2000 counts, and if more than 50% of those come from <1% of pixels, then it is considered to be noise-dominated and hence unusable.
| Quadrant | # 1 sec bins | Bins with >0 counts | Bins with >2000 counts | High rate bins dominated by noise | Noise dominated (total time) | Noise dominated (detector-on time) | Marked lightcurve |
|---|---|---|---|---|---|---|---|
| A | 7454 | 6060 | 72 | 72 | 0.97% | 1.19% | 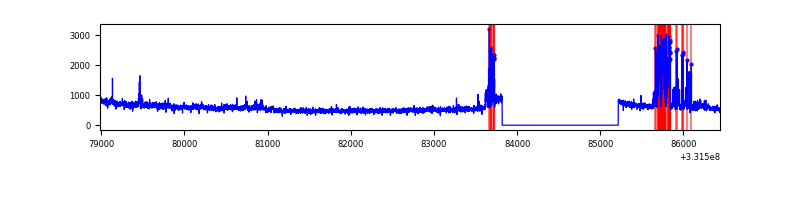 |
| B | 7454 | 6059 | 0 | 0 | 0.00% | 0.00% | 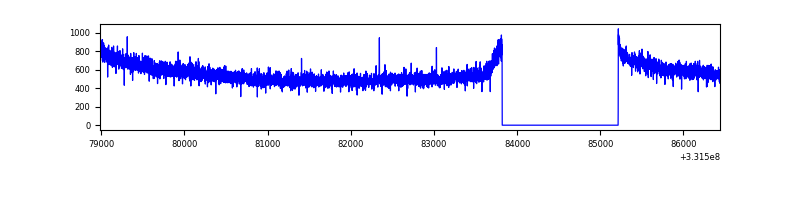 |
| C | 7454 | 6059 | 0 | 0 | 0.00% | 0.00% | 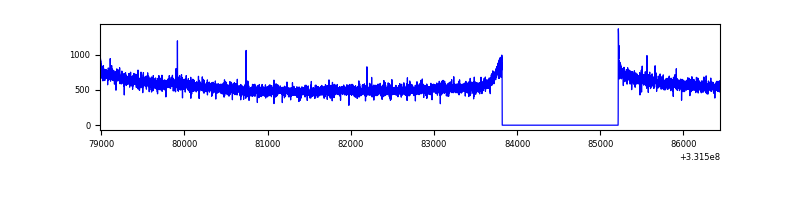 |
| D | 7454 | 6060 | 124 | 124 | 1.66% | 2.05% | 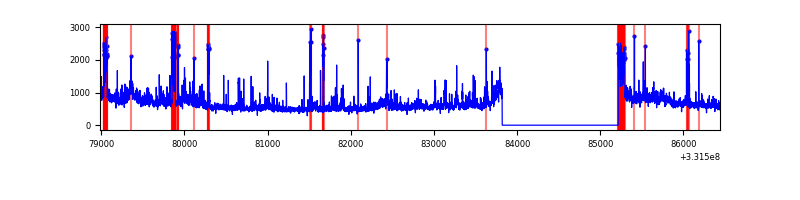 |
Top three noisy pixels from each quadrant. If the there are fewer than three noisy pixels in the level2.evt file, extra rows are filled as -1
| Pixel properties | Quadrant properties | ||||||
|---|---|---|---|---|---|---|---|
| Quadrant | DetID | PixID | Counts | Sigma | Mean | Median | Sigma |
| A | 0 | 13 | 460015 | 2743.42 | 854 | 842 | 167.4 |
| A | 6 | 16 | 8710 | 47.01 | 854 | 842 | 167.4 |
| A | 13 | 254 | 8540 | 45.99 | 854 | 842 | 167.4 |
| B | 12 | 111 | 17609 | 106.04 | 861 | 843 | 158.1 |
| B | 11 | 111 | 15946 | 95.52 | 861 | 843 | 158.1 |
| B | 0 | 219 | 15842 | 94.87 | 861 | 843 | 158.1 |
| C | 14 | 238 | 137040 | 726.96 | 817 | 826 | 187.4 |
| C | 3 | 233 | 17108 | 86.89 | 817 | 826 | 187.4 |
| C | 13 | 61 | 5666 | 25.83 | 817 | 826 | 187.4 |
| D | 7 | 80 | 434250 | 2240.66 | 814 | 796 | 193.4 |
| D | 8 | 195 | 406164 | 2095.47 | 814 | 796 | 193.4 |
| D | 1 | 52 | 293322 | 1512.16 | 814 | 796 | 193.4 |
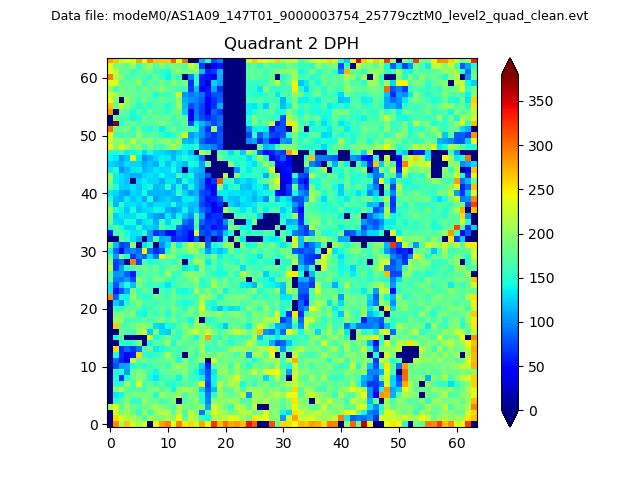
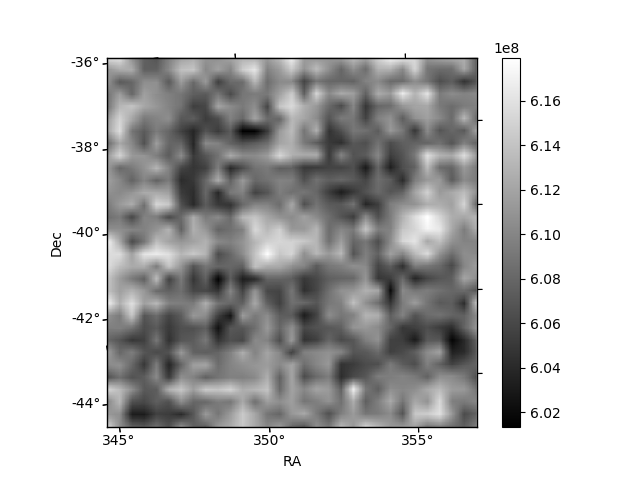
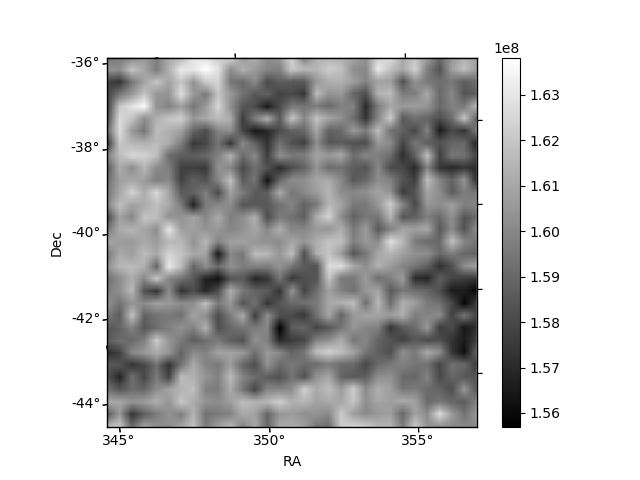
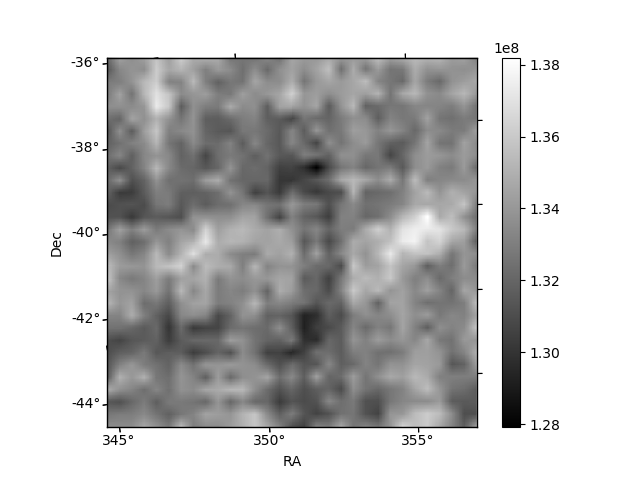
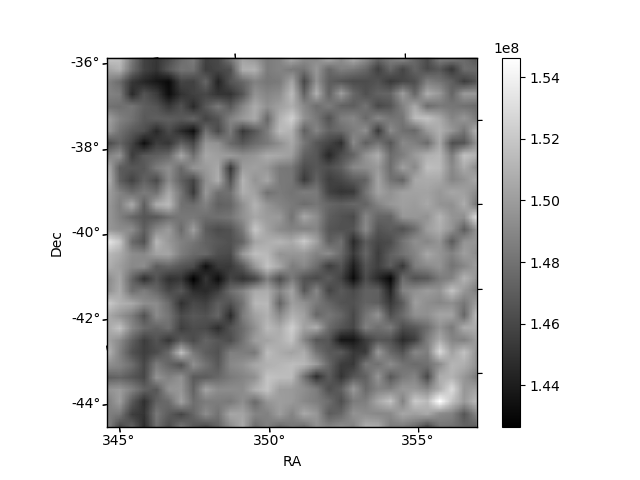
Histogram calculated using DETX and DETY for each event in the final _common_clean file
| Quadrant A | 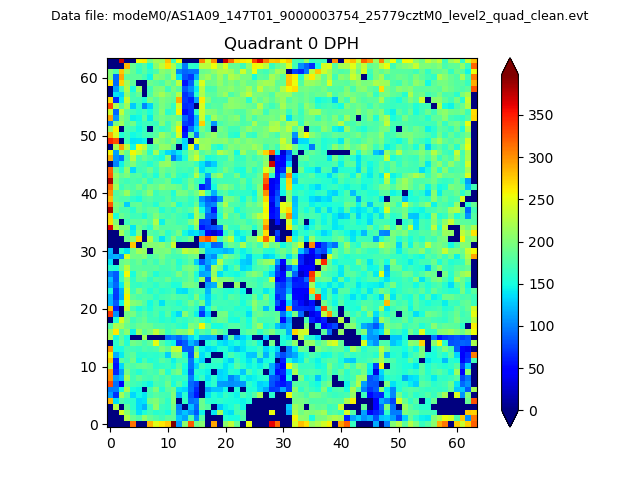 |
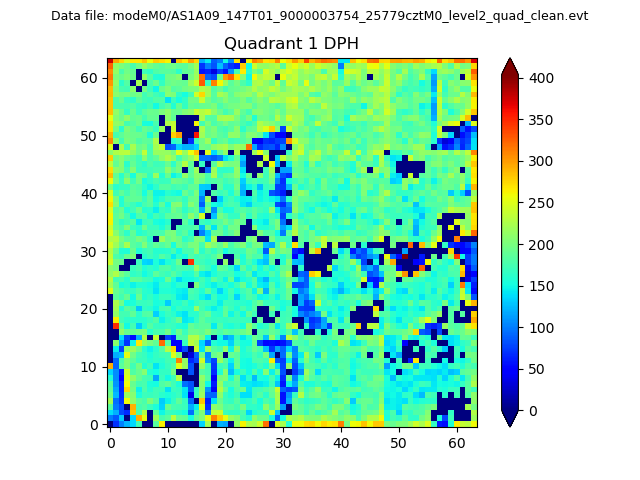 |
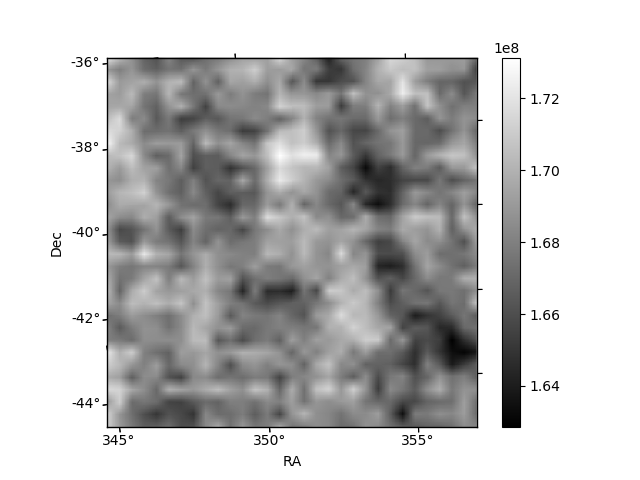
Quadrant B |
|---|---|---|---|
| Quadrant D | 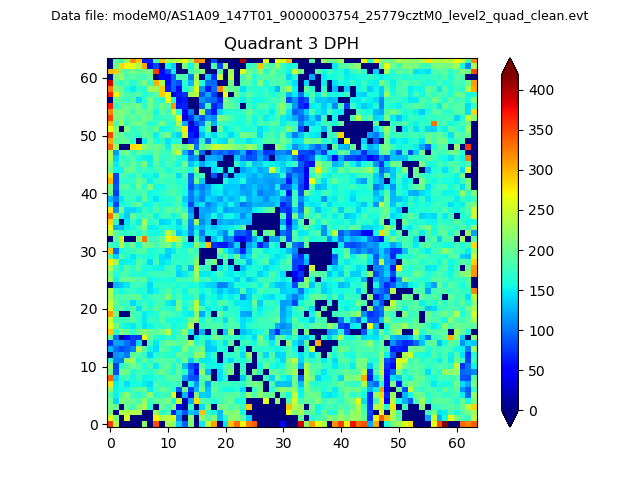 |
 |
Quadrant C |
| Plot type | Count rate plots | Images |
|---|---|---|
| Comparison with Poisson distribution Blue bars denote a histogram of data divided into 1 sec bins. Red curve is a Poisson curve with rate = median count rate of data. |
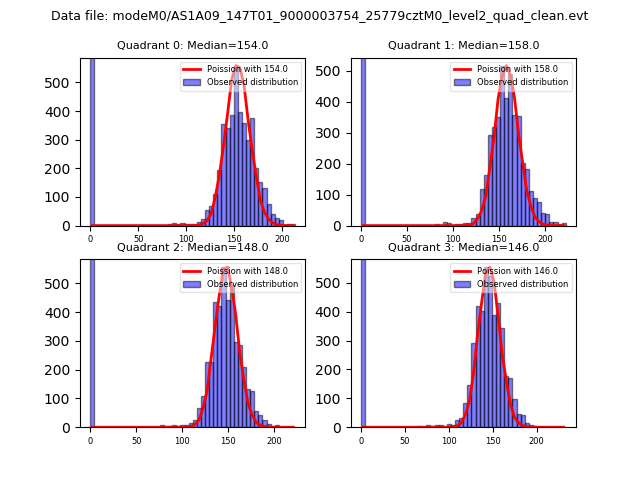 |
 |
| Quadrant-wise count rates Data is divided into 100 sec bins |
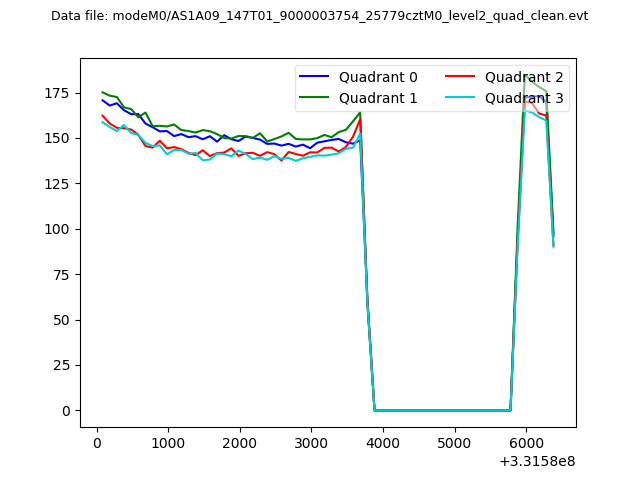 |
|
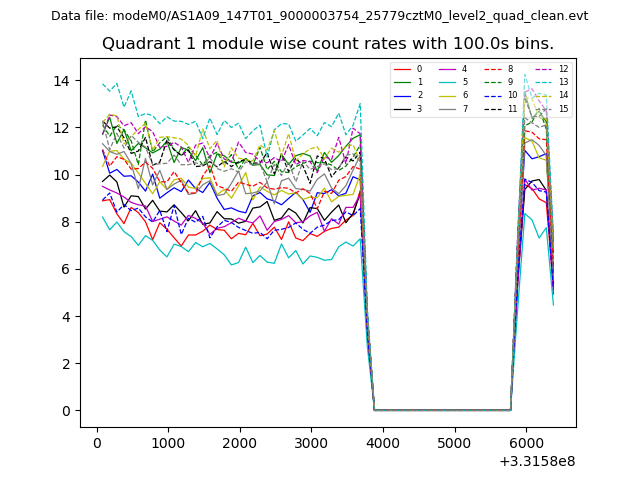
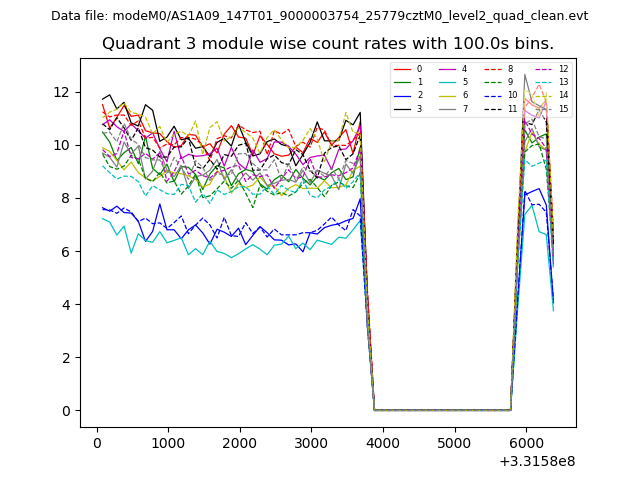
| Module-wise count rates for Quadrant A Data is divided into 100 sec bins |
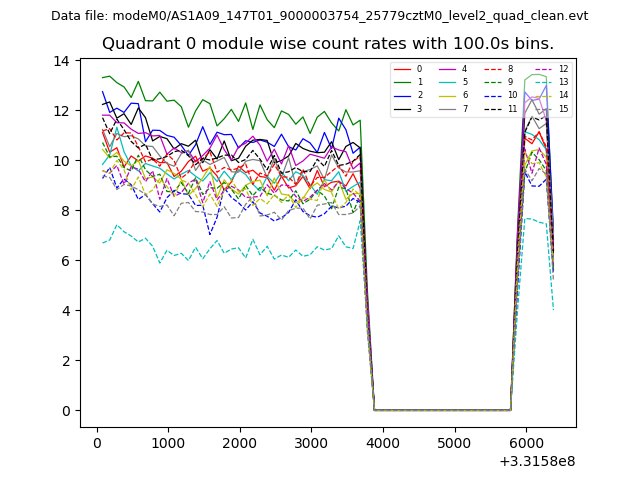 |
 |
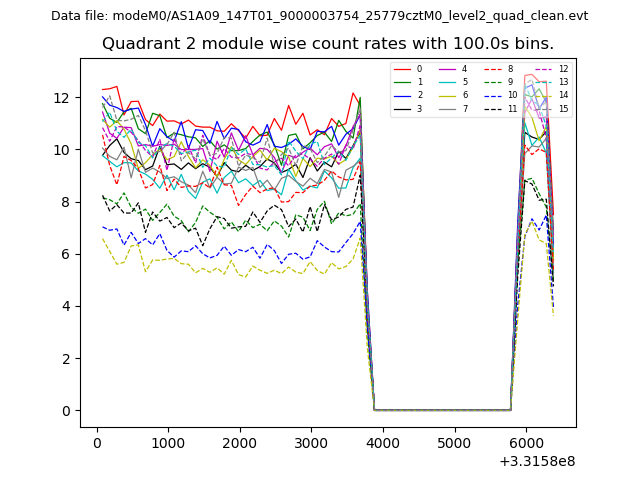
| Module-wise count rates for Quadrant B Data is divided into 100 sec bins |
 |
 |
| Module-wise count rates for Quadrant C Data is divided into 100 sec bins |
 |
 |
| Module-wise count rates for Quadrant D Data is divided into 100 sec bins |
 |
 |
| Parameter | Plot |
|---|---|
| CZT HV Monitor | 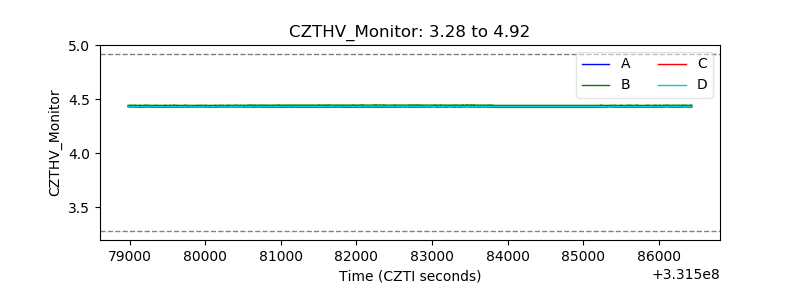 |
| D_VDD | 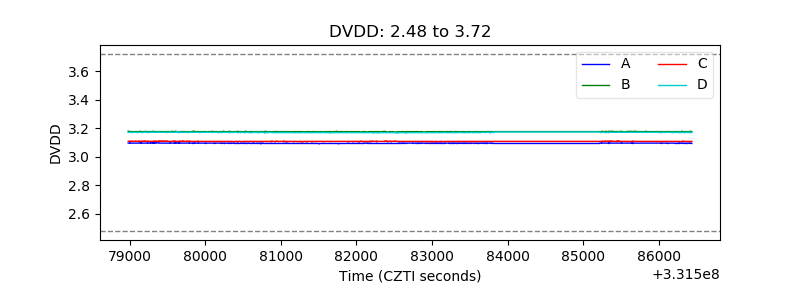 |
| Temperature 1 | 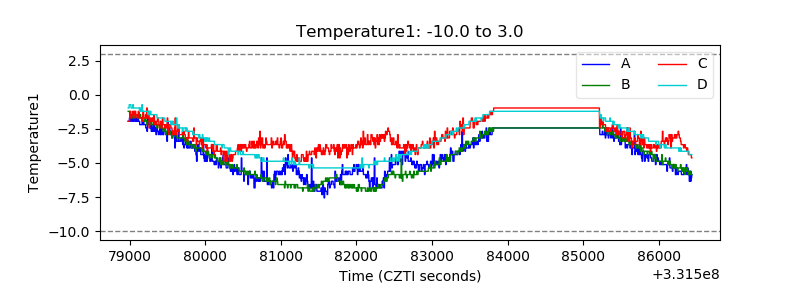 |
| Veto HV Monitor |  |
| Veto LLD | 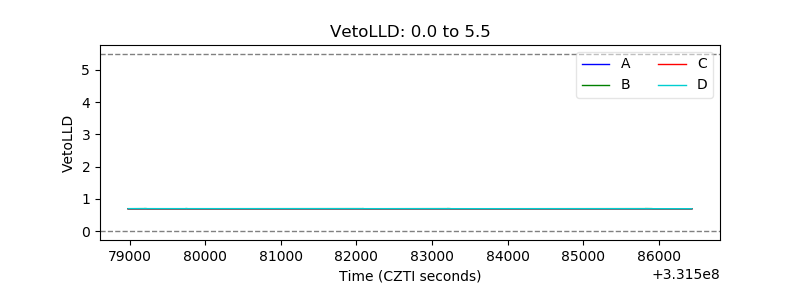 |
| Alpha Counter | 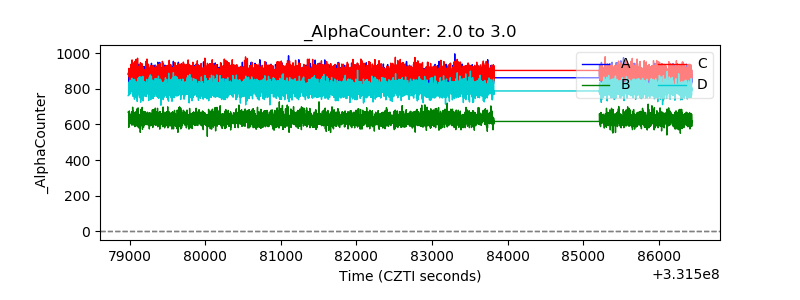 |
| _CPM_Rate | 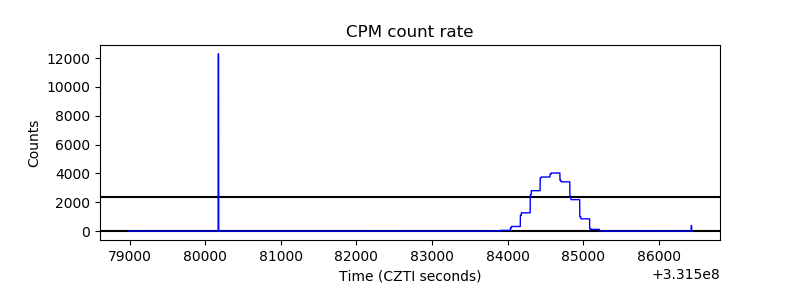 |
| CZT Counter | 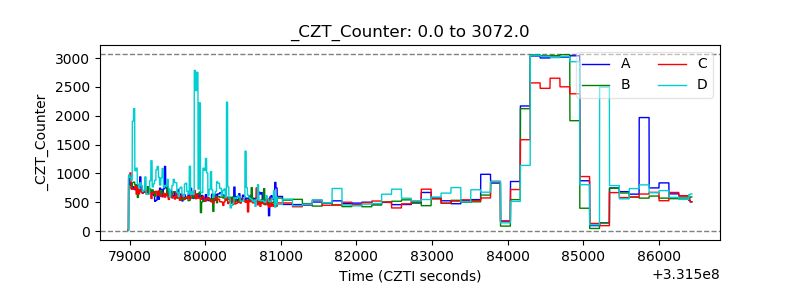 |
| +2.5 Volts monitor |  |
| +5 Volts monitor |  |
| _ROLL_ROT | 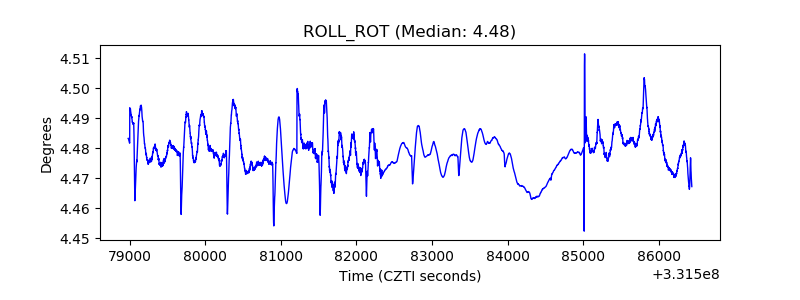 |
| _Roll_DEC | 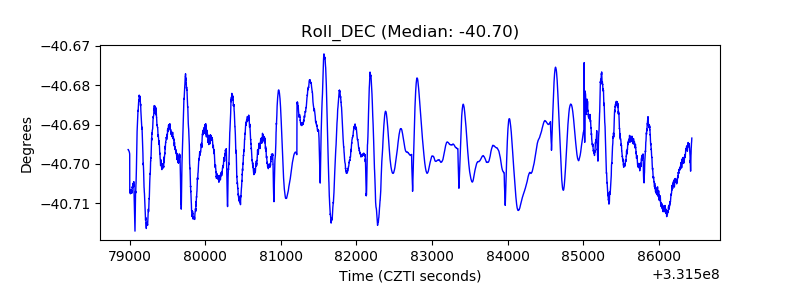 |
| _Roll_RA | 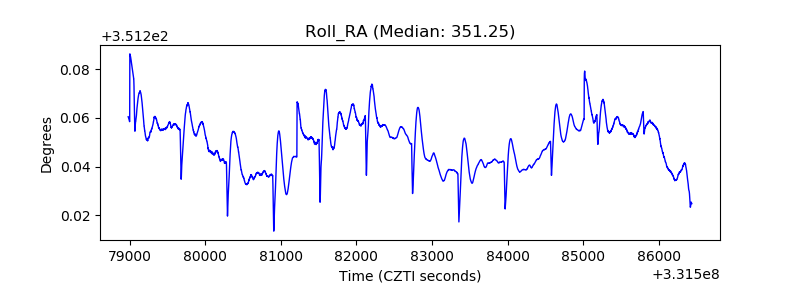 |
| Veto Counter | 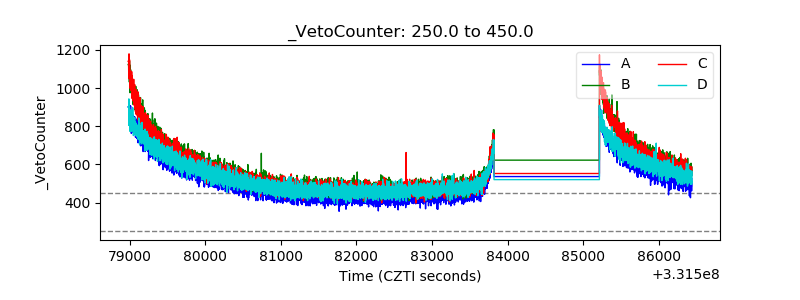 |