| Param | Original file | Final file |
|---|---|---|
| Filename | modeM0/AS1A09_147T01_9000003754_25780cztM0_level2.evt | modeM0/AS1A09_147T01_9000003754_25780cztM0_level2_quad_clean.evt |
| Size (bytes) | 552,248,640 | 106,836,480 |
| Size | 526.7 MB | 101.9 MB |
| Events in quadrant A | 3,508,895 | 729,837 |
| Events in quadrant B | 3,287,029 | 753,526 |
| Events in quadrant C | 3,286,733 | 707,258 |
| Events in quadrant D | 6,234,478 | 624,443 |
| Mode M9 | |||
|---|---|---|---|
| Quadrant | BADHDUFLAG | Total packets | Discarded packets |
| A | 0 | 25 | 0 |
| B | 0 | 26 | 0 |
| C | 0 | 26 | 0 |
| D | 0 | 26 | 0 |
| Mode M0 | |||
|---|---|---|---|
| Quadrant | BADHDUFLAG | Total packets | Discarded packets |
| A | 0 | 14204 | 0 |
| B | 0 | 13492 | 0 |
| C | 0 | 13382 | 0 |
| D | 0 | 22587 | 0 |
| Quadrant | Total seconds | Saturated seconds | Saturation percentage |
|---|---|---|---|
| A | 6020 | 138 | 2.292359% |
| B | 6020 | 75 | 1.245847% |
| C | 6020 | 98 | 1.627907% |
| D | 6019 | 870 | 14.454228% |
Noise dominated data is calculated using 1-second bins in cleaned event files. If a bin has >2000 counts, and if more than 50% of those come from <1% of pixels, then it is considered to be noise-dominated and hence unusable.
| Quadrant | # 1 sec bins | Bins with >0 counts | Bins with >2000 counts | High rate bins dominated by noise | Noise dominated (total time) | Noise dominated (detector-on time) | Marked lightcurve |
|---|---|---|---|---|---|---|---|
| A | 7425 | 6020 | 64 | 64 | 0.86% | 1.06% | 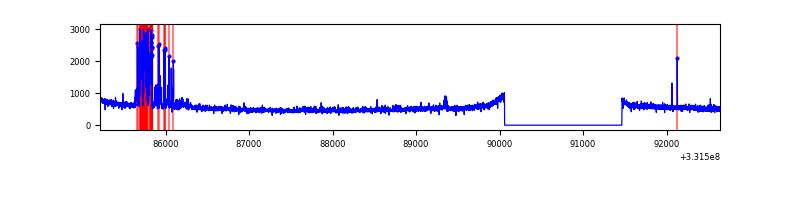 |
| B | 7425 | 6020 | 2 | 2 | 0.03% | 0.03% | 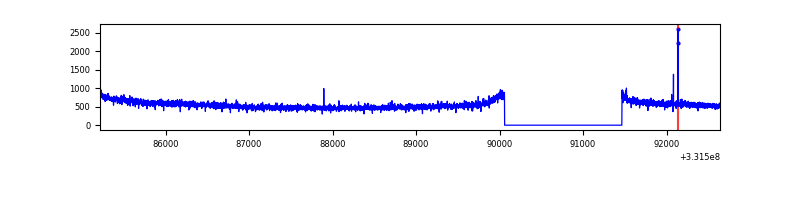 |
| C | 7425 | 6020 | 0 | 0 | 0.00% | 0.00% | 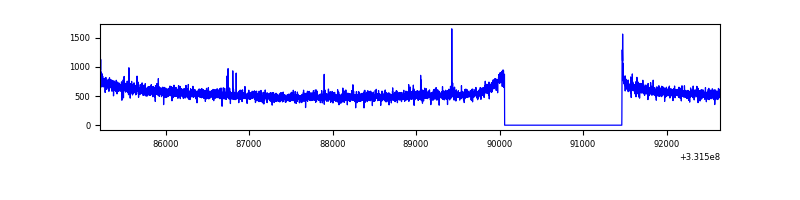 |
| D | 7424 | 6019 | 784 | 784 | 10.56% | 13.03% | 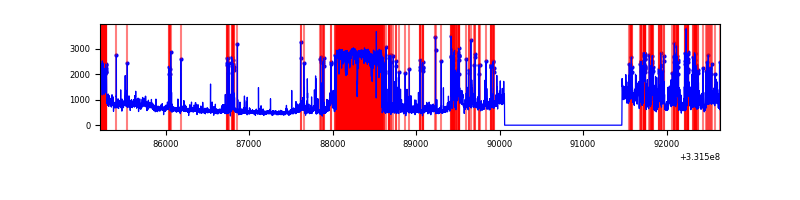 |
Top three noisy pixels from each quadrant. If the there are fewer than three noisy pixels in the level2.evt file, extra rows are filled as -1
| Pixel properties | Quadrant properties | ||||||
|---|---|---|---|---|---|---|---|
| Quadrant | DetID | PixID | Counts | Sigma | Mean | Median | Sigma |
| A | 0 | 13 | 281423 | 1712.16 | 827 | 812 | 163.9 |
| A | 6 | 16 | 30431 | 180.72 | 827 | 812 | 163.9 |
| A | 13 | 254 | 9000 | 49.96 | 827 | 812 | 163.9 |
| B | 12 | 111 | 17526 | 108.92 | 836 | 819 | 153.4 |
| B | 11 | 111 | 15645 | 96.66 | 836 | 819 | 153.4 |
| B | 14 | 111 | 14189 | 87.16 | 836 | 819 | 153.4 |
| C | 14 | 238 | 131466 | 710.45 | 800 | 807 | 183.9 |
| C | 3 | 233 | 34953 | 185.67 | 800 | 807 | 183.9 |
| C | 13 | 61 | 5432 | 25.15 | 800 | 807 | 183.9 |
| D | 7 | 80 | 1460991 | 8303.1 | 750 | 734 | 175.9 |
| D | 1 | 52 | 1070081 | 6080.36 | 750 | 734 | 175.9 |
| D | 8 | 195 | 682919 | 3878.94 | 750 | 734 | 175.9 |
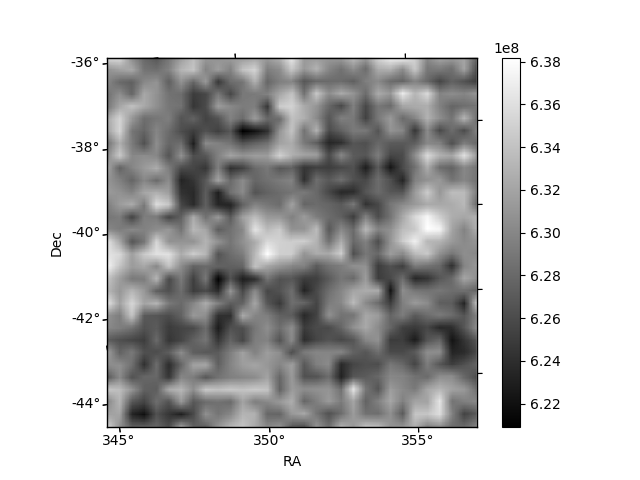
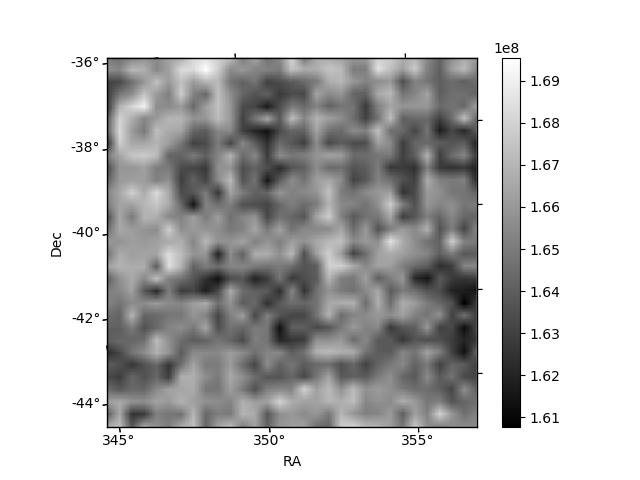
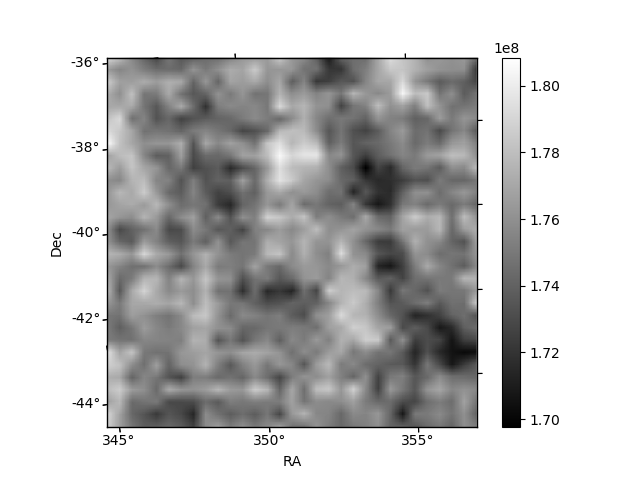
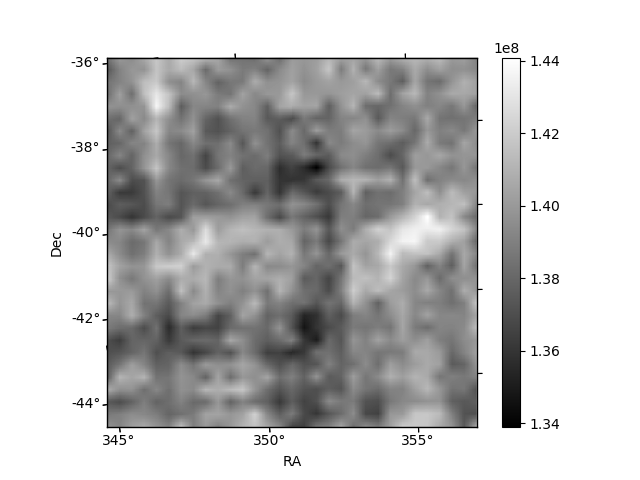
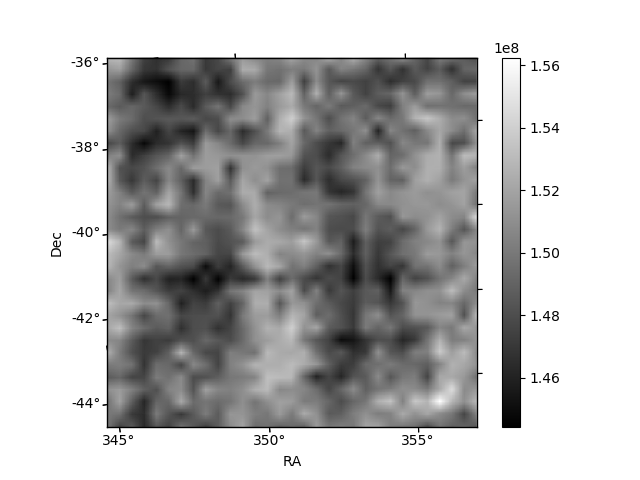
Histogram calculated using DETX and DETY for each event in the final _common_clean file
| Quadrant A | 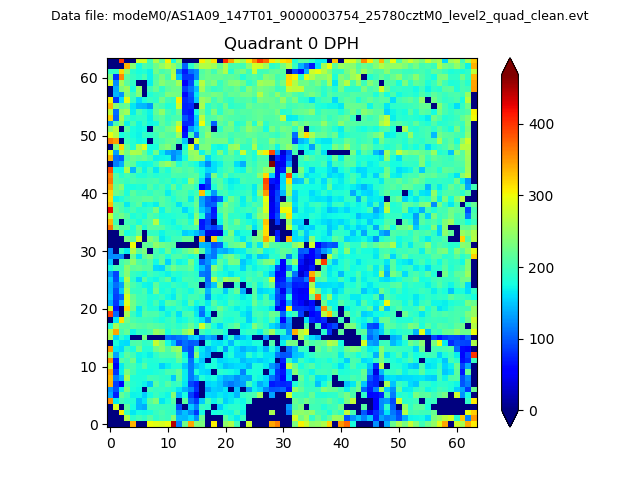 |
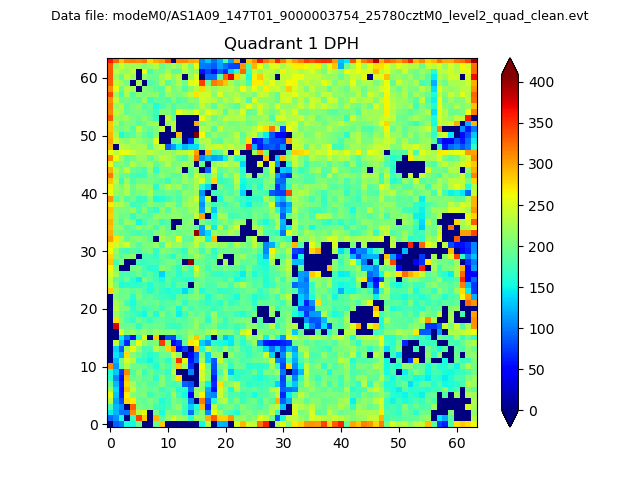 |
Quadrant B |
|---|---|---|---|
| Quadrant D | 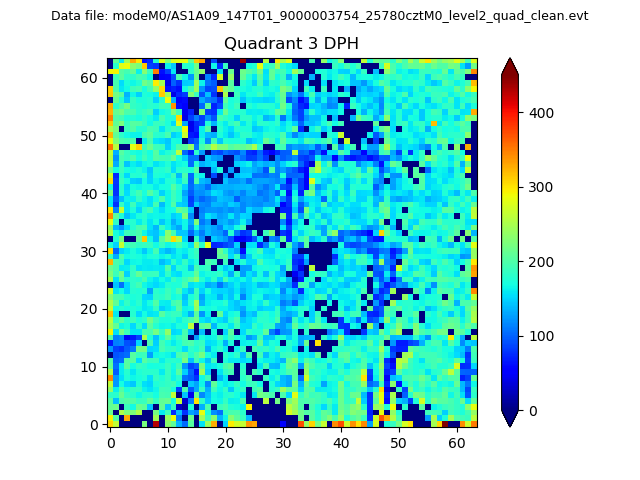 |
 |
Quadrant C |
| Plot type | Count rate plots | Images |
|---|---|---|
| Comparison with Poisson distribution Blue bars denote a histogram of data divided into 1 sec bins. Red curve is a Poisson curve with rate = median count rate of data. |
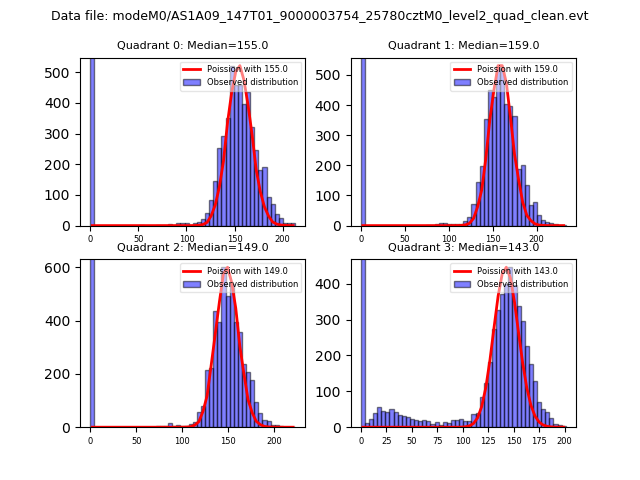 |
 |
| Quadrant-wise count rates Data is divided into 100 sec bins |
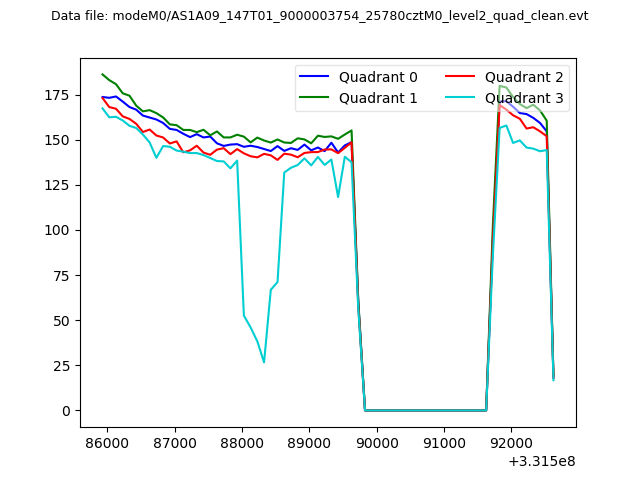 |
|
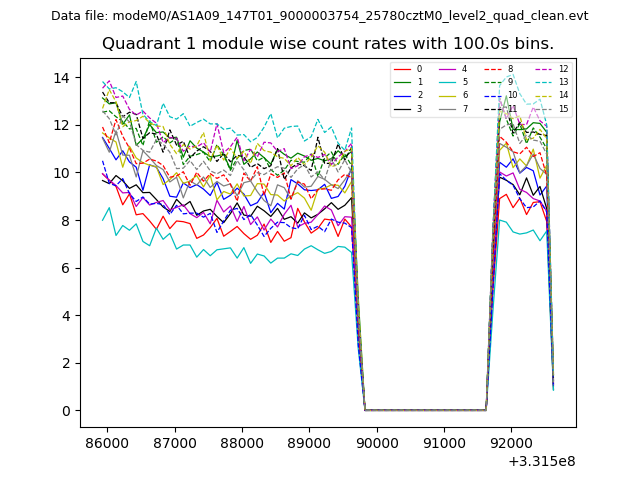
| Module-wise count rates for Quadrant A Data is divided into 100 sec bins |
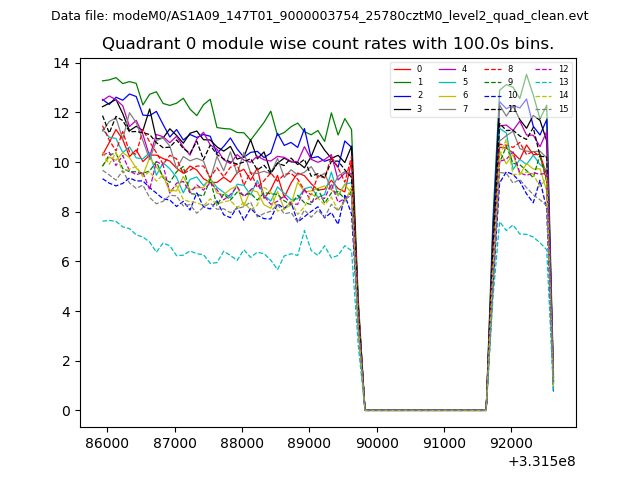 |
 |
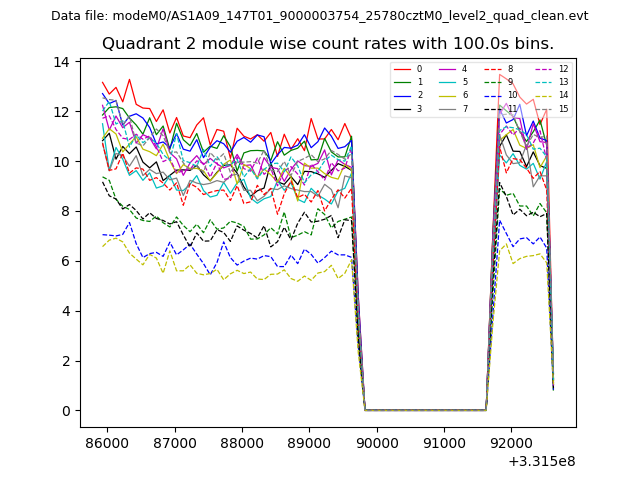
| Module-wise count rates for Quadrant B Data is divided into 100 sec bins |
 |
 |
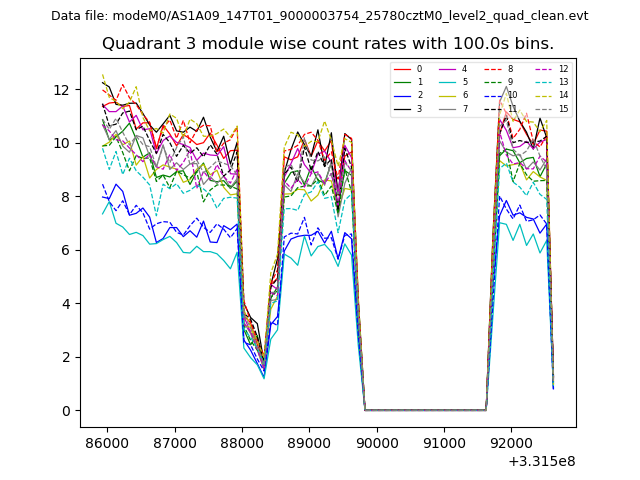
| Module-wise count rates for Quadrant C Data is divided into 100 sec bins |
 |
 |
| Module-wise count rates for Quadrant D Data is divided into 100 sec bins |
 |
 |
| Parameter | Plot |
|---|---|
| CZT HV Monitor | 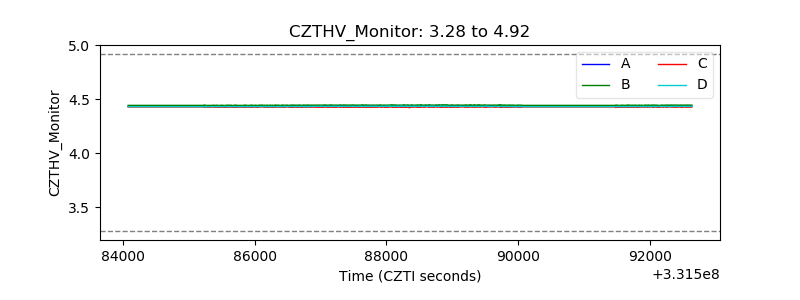 |
| D_VDD | 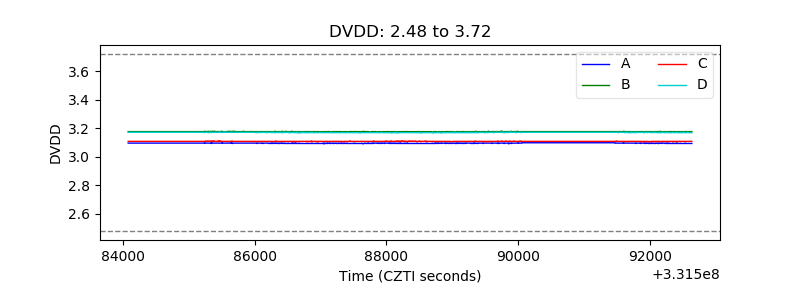 |
| Temperature 1 | 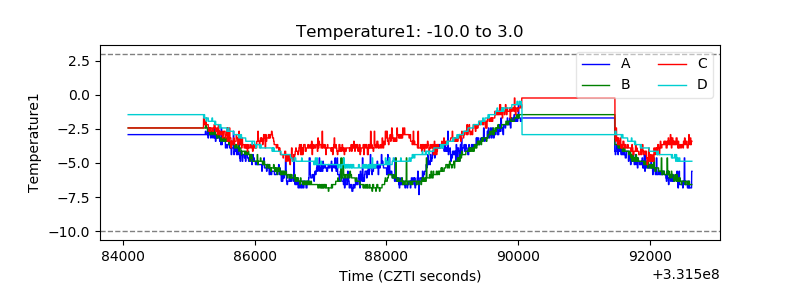 |
| Veto HV Monitor | 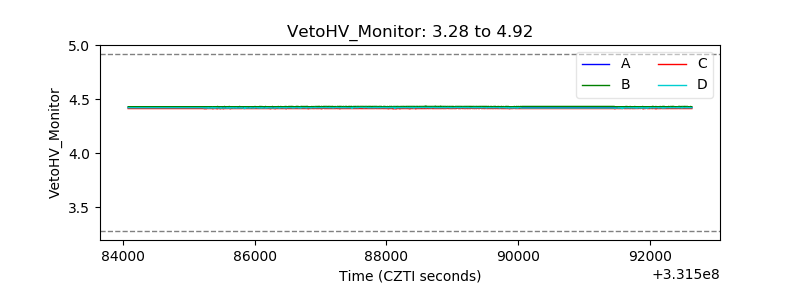 |
| Veto LLD | 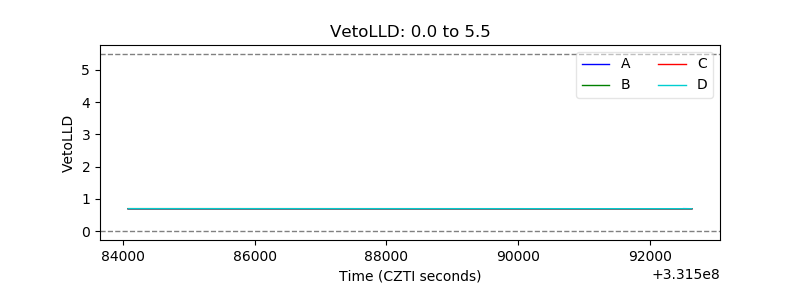 |
| Alpha Counter | 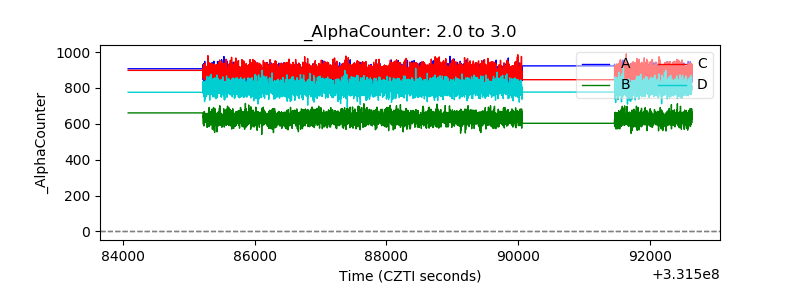 |
| _CPM_Rate | 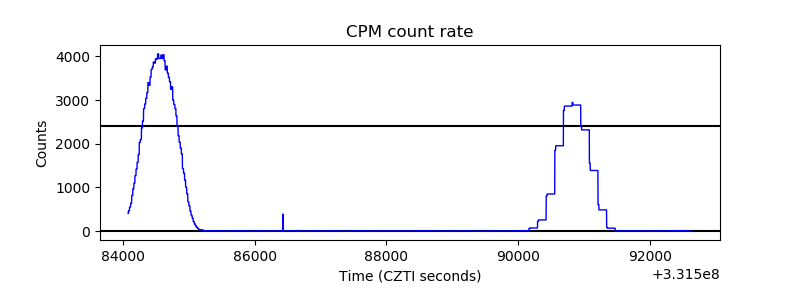 |
| CZT Counter | 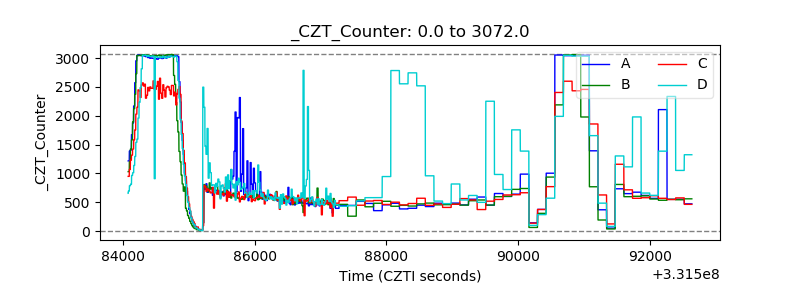 |
| +2.5 Volts monitor |  |
| +5 Volts monitor | 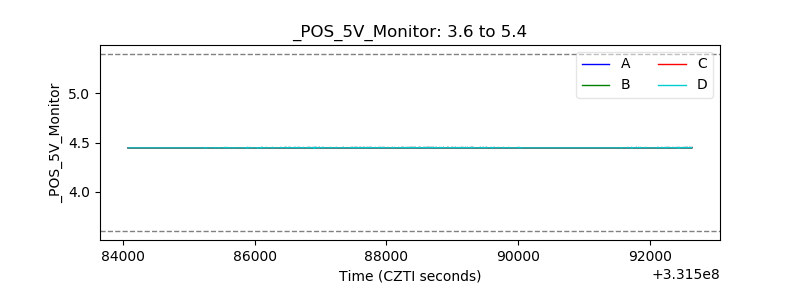 |
| _ROLL_ROT | 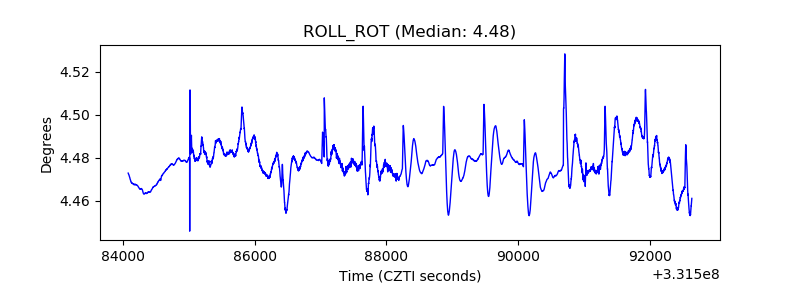 |
| _Roll_DEC | 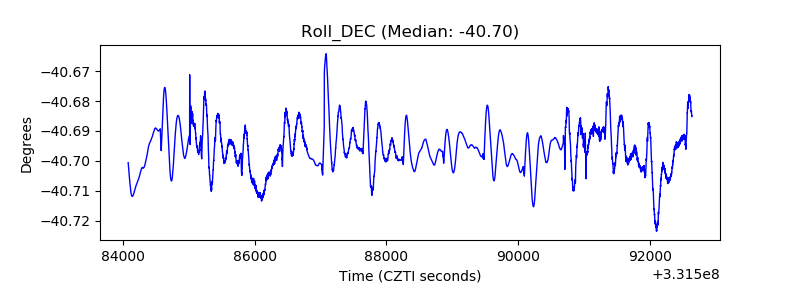 |
| _Roll_RA | 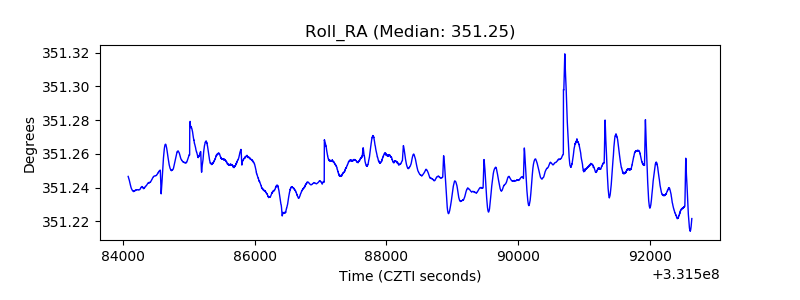 |
| Veto Counter | 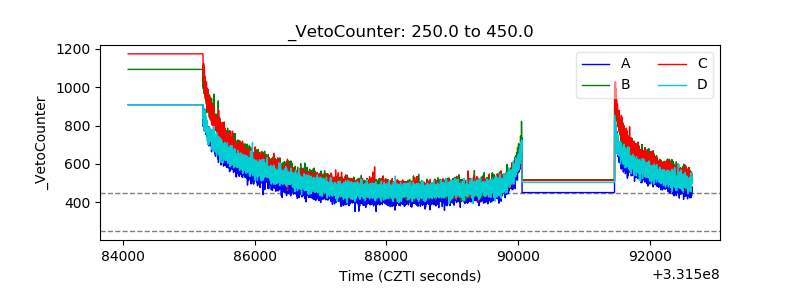 |