| Param | Original file | Final file |
|---|---|---|
| Filename | modeM0/AS1A09_147T01_9000003754_25781cztM0_level2.evt | modeM0/AS1A09_147T01_9000003754_25781cztM0_level2_quad_clean.evt |
| Size (bytes) | 528,327,360 | 113,163,840 |
| Size | 503.9 MB | 107.9 MB |
| Events in quadrant A | 3,215,037 | 759,020 |
| Events in quadrant B | 3,223,510 | 786,577 |
| Events in quadrant C | 3,214,987 | 743,282 |
| Events in quadrant D | 5,927,132 | 705,954 |
| Mode M9 | |||
|---|---|---|---|
| Quadrant | BADHDUFLAG | Total packets | Discarded packets |
| A | 0 | 14 | 0 |
| B | 0 | 15 | 0 |
| C | 0 | 15 | 0 |
| D | 0 | 15 | 0 |
| Mode M0 | |||
|---|---|---|---|
| Quadrant | BADHDUFLAG | Total packets | Discarded packets |
| A | 0 | 13296 | 0 |
| B | 0 | 13295 | 0 |
| C | 0 | 13165 | 0 |
| D | 0 | 21911 | 0 |
| Quadrant | Total seconds | Saturated seconds | Saturation percentage |
|---|---|---|---|
| A | 6189 | 27 | 0.436258% |
| B | 6189 | 35 | 0.565519% |
| C | 6188 | 62 | 1.001939% |
| D | 6188 | 371 | 5.995475% |
Noise dominated data is calculated using 1-second bins in cleaned event files. If a bin has >2000 counts, and if more than 50% of those come from <1% of pixels, then it is considered to be noise-dominated and hence unusable.
| Quadrant | # 1 sec bins | Bins with >0 counts | Bins with >2000 counts | High rate bins dominated by noise | Noise dominated (total time) | Noise dominated (detector-on time) | Marked lightcurve |
|---|---|---|---|---|---|---|---|
| A | 7524 | 6190 | 3 | 3 | 0.04% | 0.05% | 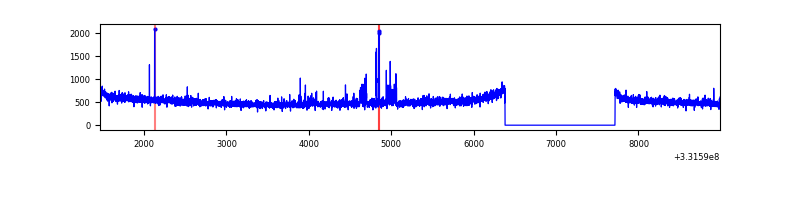 |
| B | 7524 | 6190 | 2 | 2 | 0.03% | 0.03% | 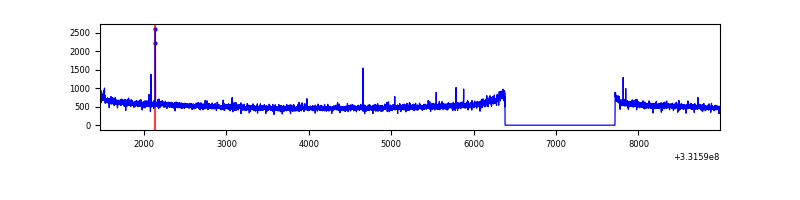 |
| C | 7523 | 6189 | 0 | 0 | 0.00% | 0.00% | 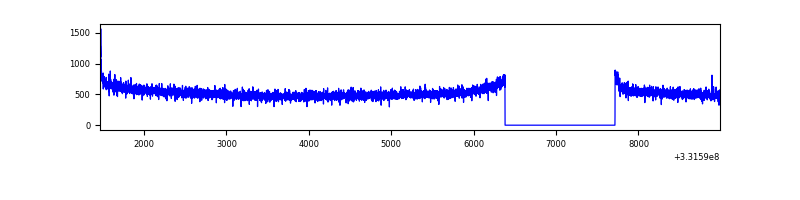 |
| D | 7523 | 6188 | 284 | 284 | 3.78% | 4.59% | 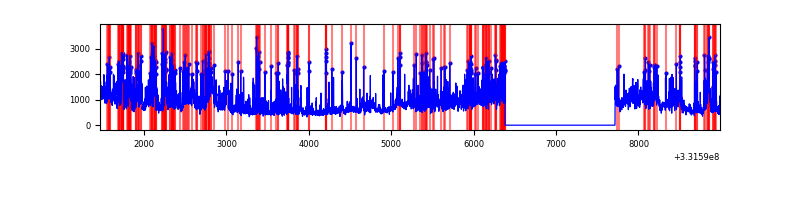 |
Top three noisy pixels from each quadrant. If the there are fewer than three noisy pixels in the level2.evt file, extra rows are filled as -1
| Pixel properties | Quadrant properties | ||||||
|---|---|---|---|---|---|---|---|
| Quadrant | DetID | PixID | Counts | Sigma | Mean | Median | Sigma |
| A | 0 | 13 | 85951 | 533.93 | 811 | 798 | 159.5 |
| A | 13 | 254 | 8306 | 47.08 | 811 | 798 | 159.5 |
| A | 3 | 137 | 7029 | 39.07 | 811 | 798 | 159.5 |
| B | 12 | 111 | 17613 | 111.34 | 816 | 799 | 151.0 |
| B | 11 | 111 | 16095 | 101.29 | 816 | 799 | 151.0 |
| B | 14 | 111 | 14647 | 91.7 | 816 | 799 | 151.0 |
| C | 14 | 238 | 127857 | 698.93 | 787 | 794 | 181.8 |
| C | 3 | 233 | 17566 | 92.26 | 787 | 794 | 181.8 |
| C | 13 | 61 | 5455 | 25.64 | 787 | 794 | 181.8 |
| D | 1 | 52 | 2087639 | 11508.48 | 771 | 755 | 181.3 |
| D | 8 | 195 | 474482 | 2612.45 | 771 | 755 | 181.3 |
| D | 7 | 80 | 319435 | 1757.42 | 771 | 755 | 181.3 |
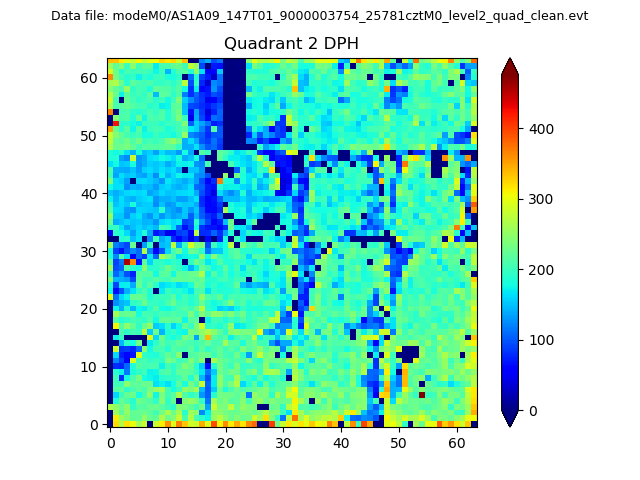
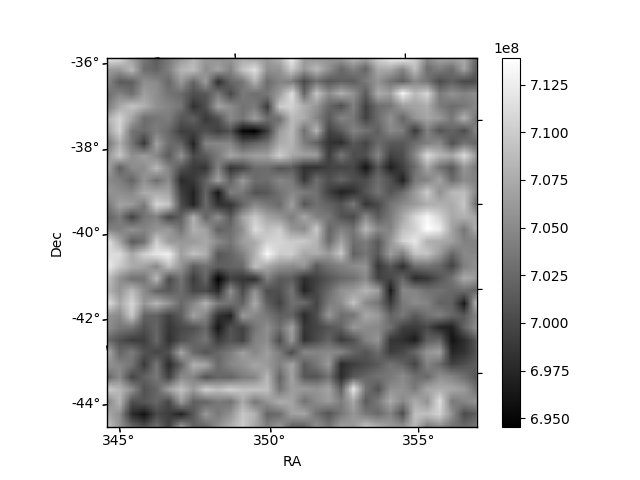
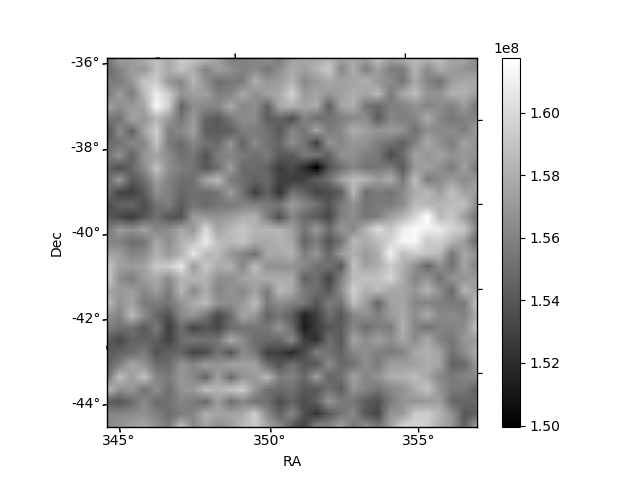
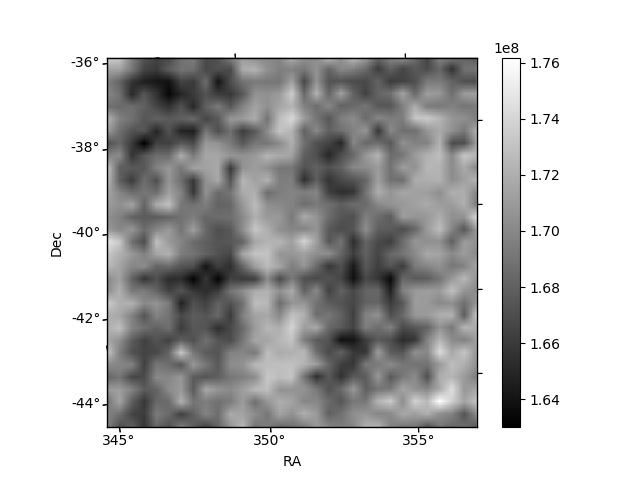
Histogram calculated using DETX and DETY for each event in the final _common_clean file
| Quadrant A | 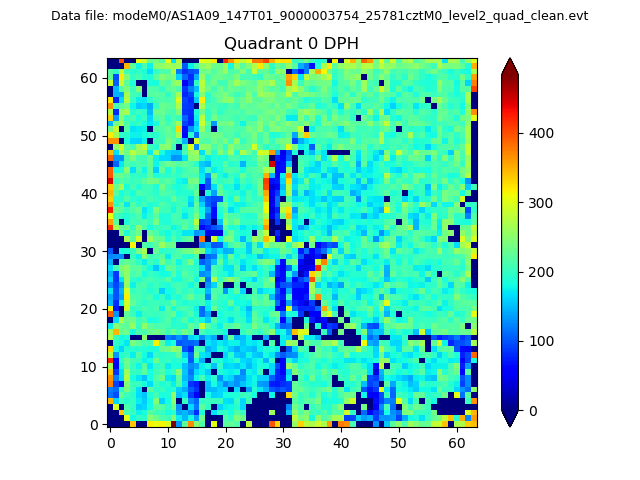 |
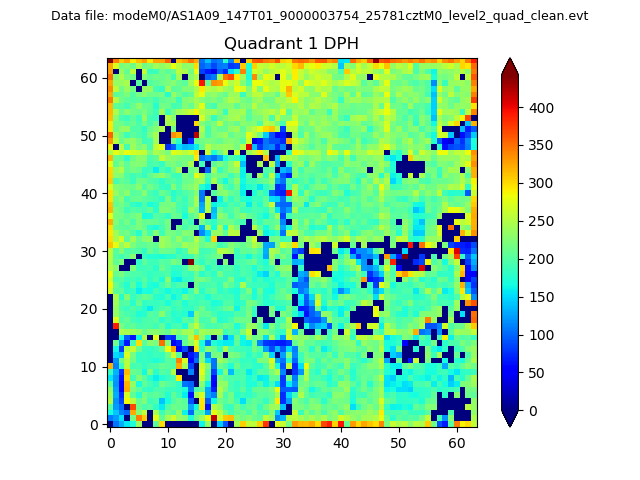 |
Quadrant B |
|---|---|---|---|
| Quadrant D | 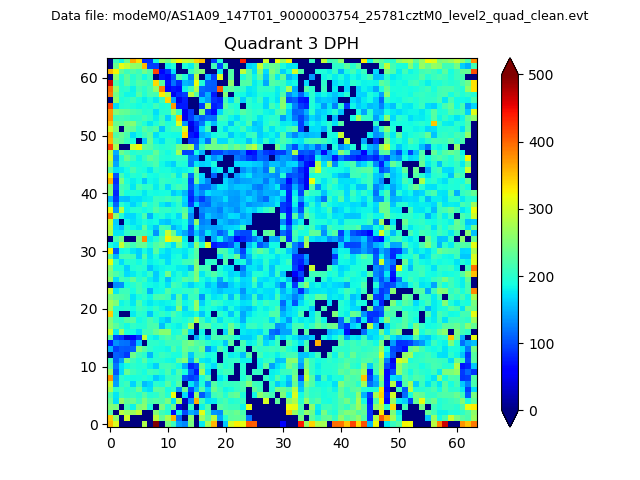 |
 |
Quadrant C |
| Plot type | Count rate plots | Images |
|---|---|---|
| Comparison with Poisson distribution Blue bars denote a histogram of data divided into 1 sec bins. Red curve is a Poisson curve with rate = median count rate of data. |
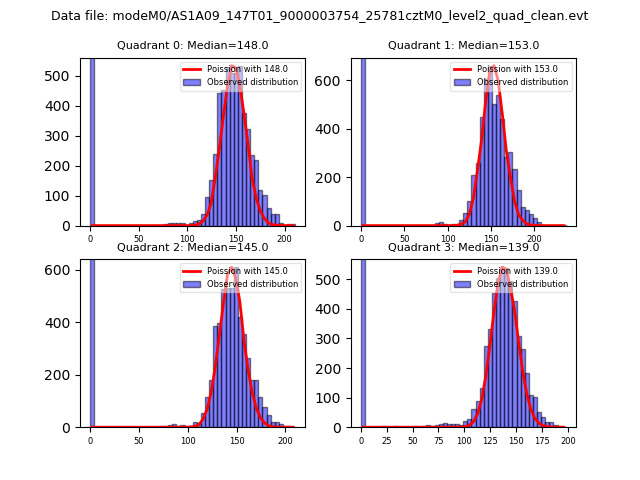 |
 |
| Quadrant-wise count rates Data is divided into 100 sec bins |
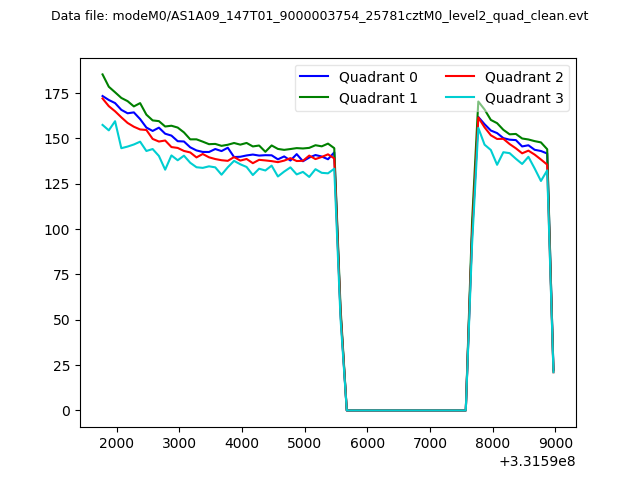 |
|
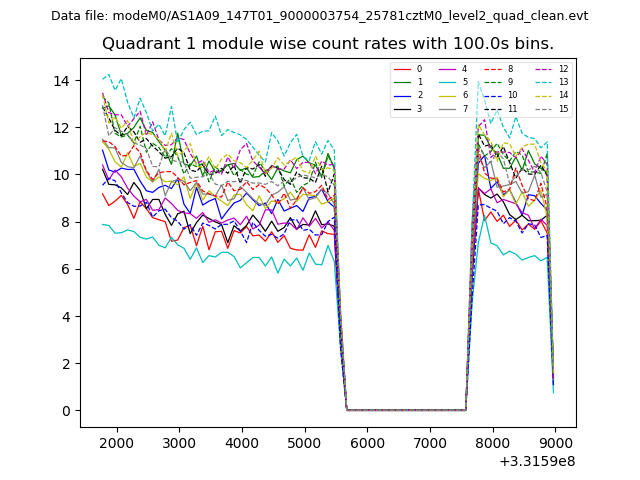
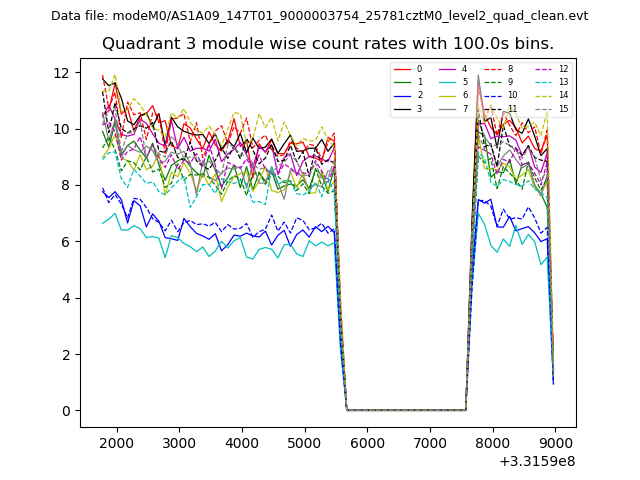
| Module-wise count rates for Quadrant A Data is divided into 100 sec bins |
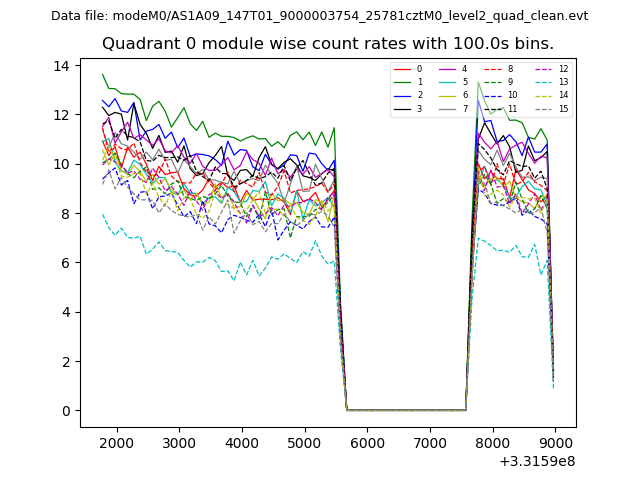 |
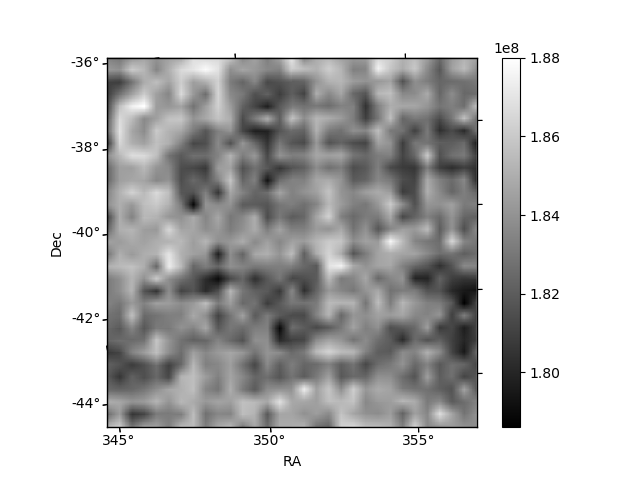 |
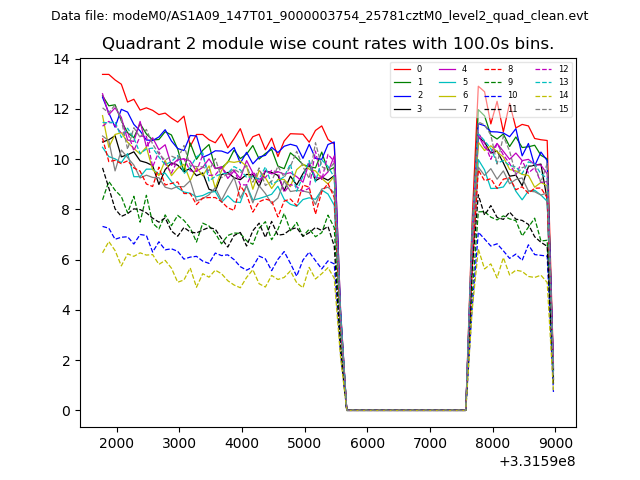
| Module-wise count rates for Quadrant B Data is divided into 100 sec bins |
 |
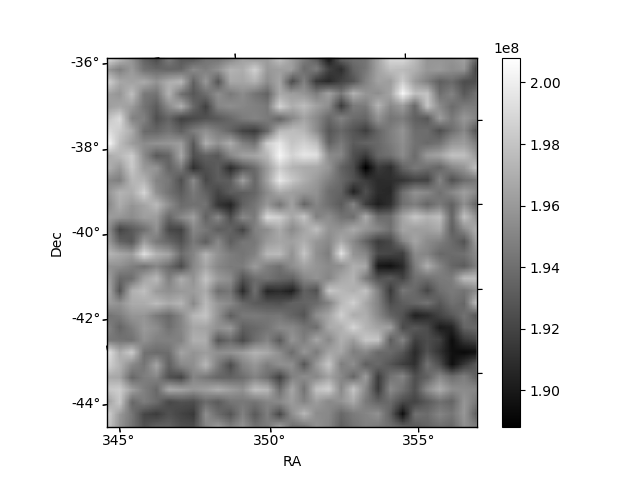 |
| Module-wise count rates for Quadrant C Data is divided into 100 sec bins |
 |
 |
| Module-wise count rates for Quadrant D Data is divided into 100 sec bins |
 |
 |
| Parameter | Plot |
|---|---|
| CZT HV Monitor | 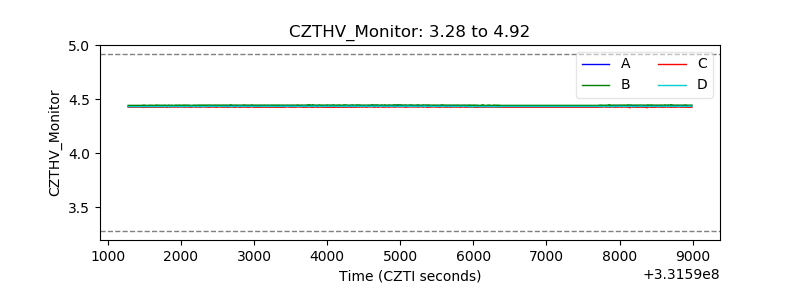 |
| D_VDD | 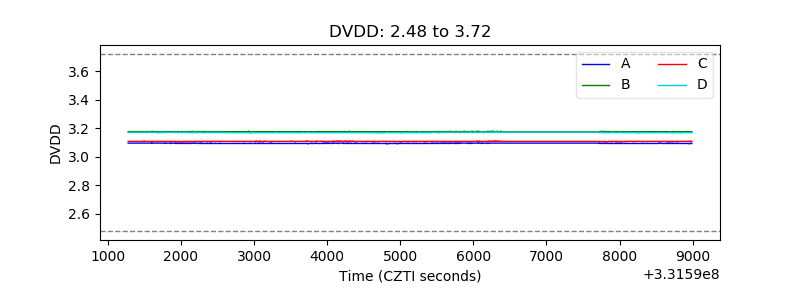 |
| Temperature 1 | 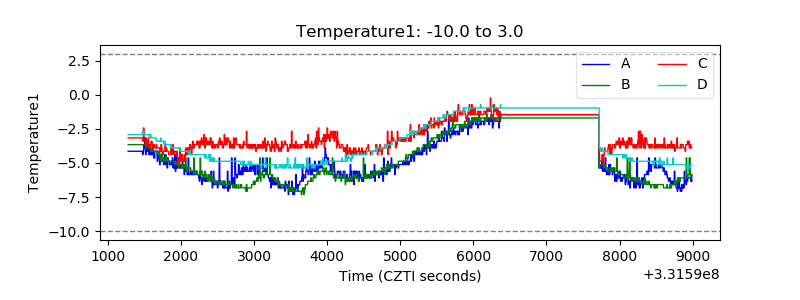 |
| Veto HV Monitor | 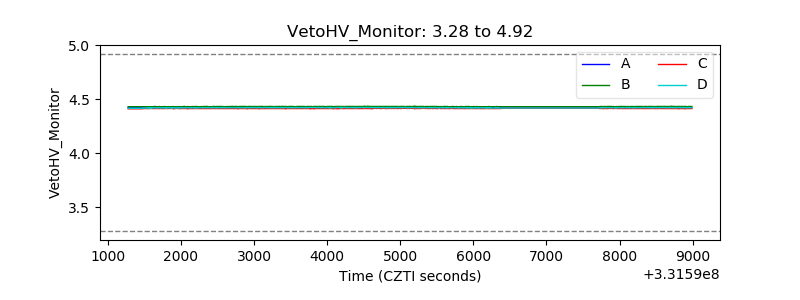 |
| Veto LLD | 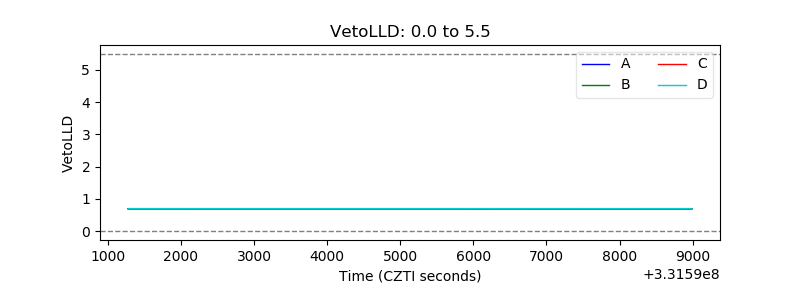 |
| Alpha Counter | 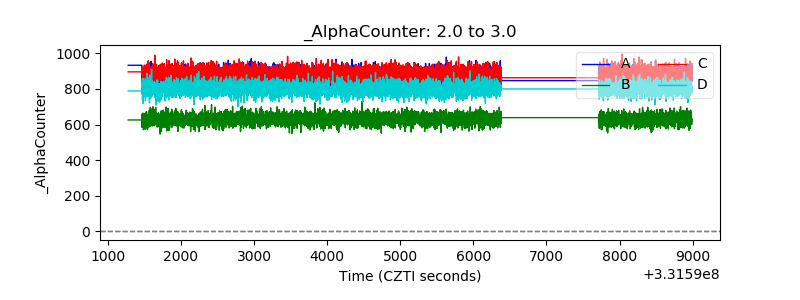 |
| _CPM_Rate | 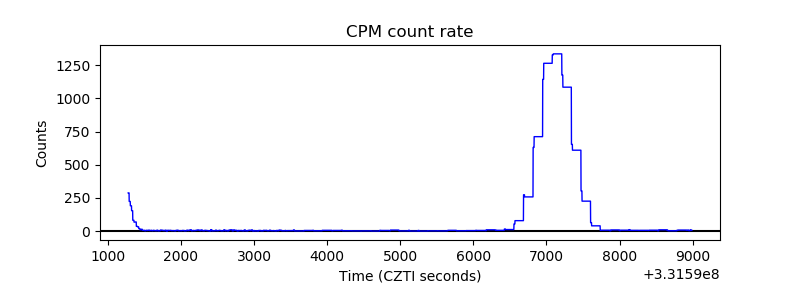 |
| CZT Counter | 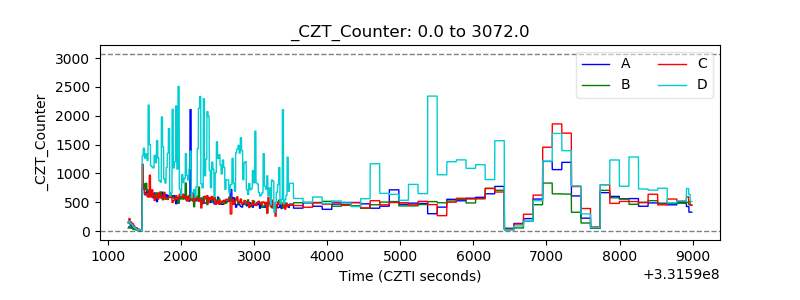 |
| +2.5 Volts monitor |  |
| +5 Volts monitor |  |
| _ROLL_ROT | 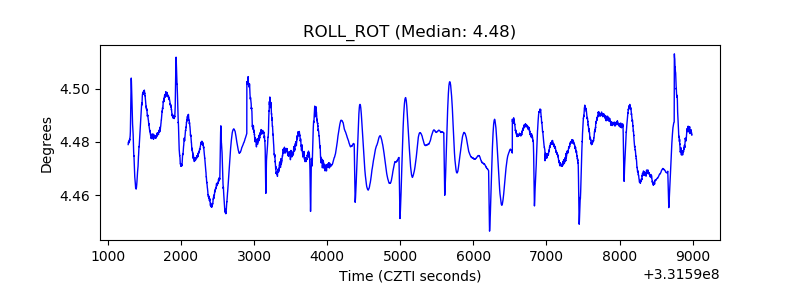 |
| _Roll_DEC |  |
| _Roll_RA | 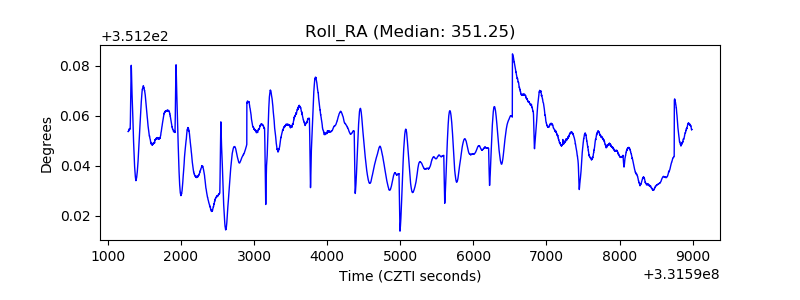 |
| Veto Counter | 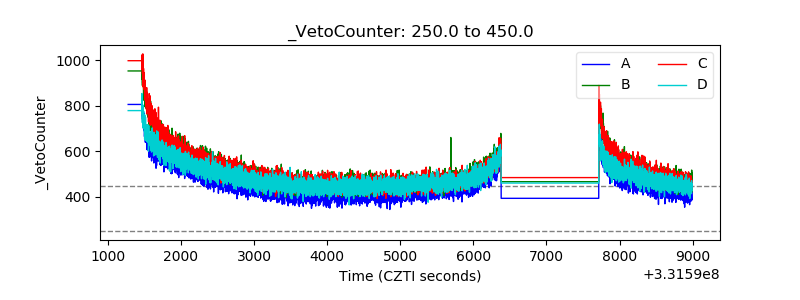 |