| Param | Original file | Final file |
|---|---|---|
| Filename | modeM0/AS1A09_147T01_9000003754_25782cztM0_level2.evt | modeM0/AS1A09_147T01_9000003754_25782cztM0_level2_quad_clean.evt |
| Size (bytes) | 558,708,480 | 108,216,000 |
| Size | 532.8 MB | 103.2 MB |
| Events in quadrant A | 3,326,274 | 712,306 |
| Events in quadrant B | 3,283,035 | 735,947 |
| Events in quadrant C | 3,314,052 | 701,281 |
| Events in quadrant D | 6,547,732 | 665,607 |
| Mode M9 | |||
|---|---|---|---|
| Quadrant | BADHDUFLAG | Total packets | Discarded packets |
| A | 0 | 21 | 0 |
| B | 0 | 22 | 0 |
| C | 0 | 22 | 0 |
| D | 0 | 22 | 0 |
| Mode M0 | |||
|---|---|---|---|
| Quadrant | BADHDUFLAG | Total packets | Discarded packets |
| A | 0 | 13953 | 0 |
| B | 0 | 13829 | 0 |
| C | 0 | 13780 | 0 |
| D | 0 | 23987 | 0 |
| Quadrant | Total seconds | Saturated seconds | Saturation percentage |
|---|---|---|---|
| A | 6634 | 44 | 0.663250% |
| B | 6634 | 56 | 0.844136% |
| C | 6633 | 87 | 1.311624% |
| D | 6633 | 740 | 11.156340% |
Noise dominated data is calculated using 1-second bins in cleaned event files. If a bin has >2000 counts, and if more than 50% of those come from <1% of pixels, then it is considered to be noise-dominated and hence unusable.
| Quadrant | # 1 sec bins | Bins with >0 counts | Bins with >2000 counts | High rate bins dominated by noise | Noise dominated (total time) | Noise dominated (detector-on time) | Marked lightcurve |
|---|---|---|---|---|---|---|---|
| A | 7589 | 6635 | 16 | 16 | 0.21% | 0.24% | 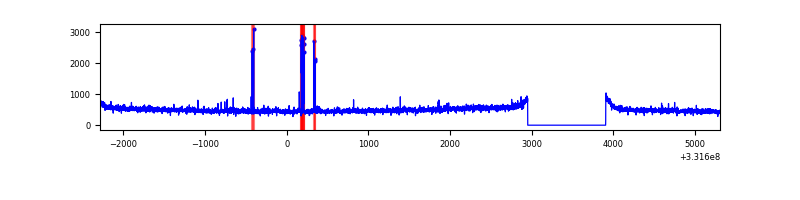 |
| B | 7589 | 6635 | 0 | 0 | 0.00% | 0.00% | 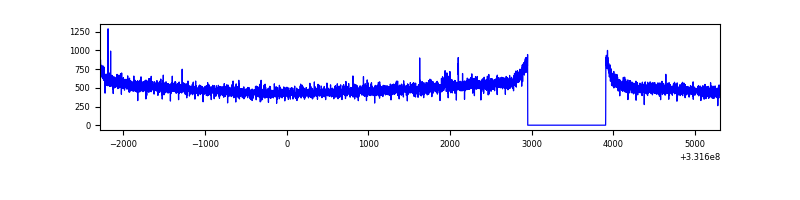 |
| C | 7588 | 6633 | 0 | 0 | 0.00% | 0.00% | 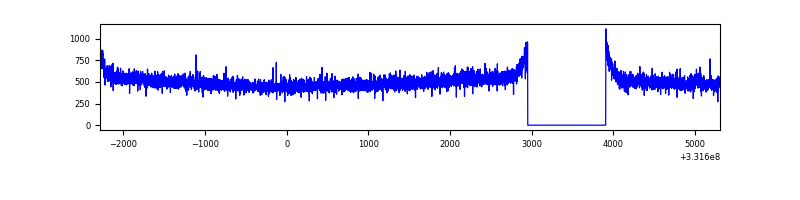 |
| D | 7588 | 6633 | 613 | 613 | 8.08% | 9.24% | 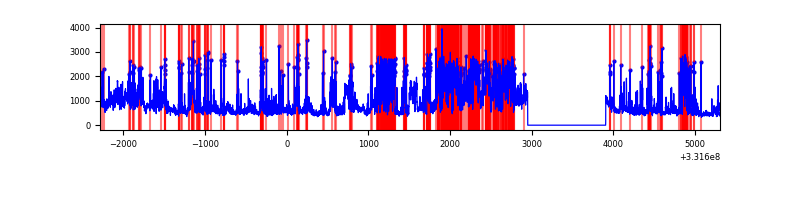 |
Top three noisy pixels from each quadrant. If the there are fewer than three noisy pixels in the level2.evt file, extra rows are filled as -1
| Pixel properties | Quadrant properties | ||||||
|---|---|---|---|---|---|---|---|
| Quadrant | DetID | PixID | Counts | Sigma | Mean | Median | Sigma |
| A | 0 | 13 | 98282 | 583.42 | 834 | 816 | 167.1 |
| A | 13 | 254 | 9108 | 49.64 | 834 | 816 | 167.1 |
| A | 6 | 16 | 8280 | 44.68 | 834 | 816 | 167.1 |
| B | 12 | 111 | 18747 | 113.23 | 837 | 815 | 158.4 |
| B | 11 | 111 | 17058 | 102.57 | 837 | 815 | 158.4 |
| B | 14 | 111 | 15395 | 92.07 | 837 | 815 | 158.4 |
| C | 14 | 238 | 131959 | 688.08 | 813 | 817 | 190.6 |
| C | 3 | 233 | 16181 | 80.61 | 813 | 817 | 190.6 |
| C | 13 | 61 | 5581 | 25.0 | 813 | 817 | 190.6 |
| D | 1 | 52 | 2618873 | 14080.06 | 787 | 769 | 185.9 |
| D | 7 | 80 | 426158 | 2287.73 | 787 | 769 | 185.9 |
| D | 13 | 104 | 414709 | 2226.15 | 787 | 769 | 185.9 |
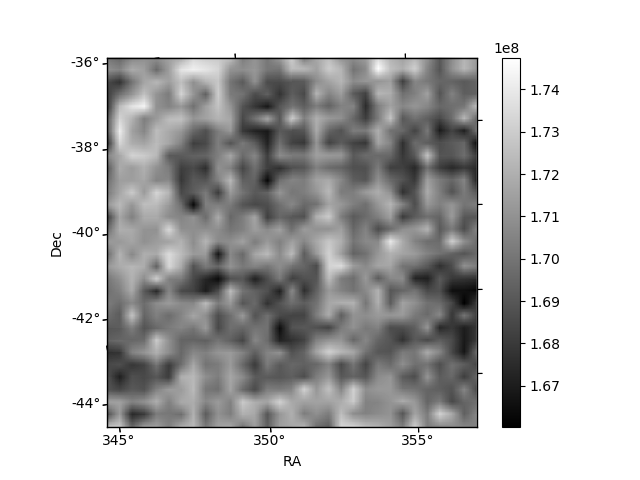
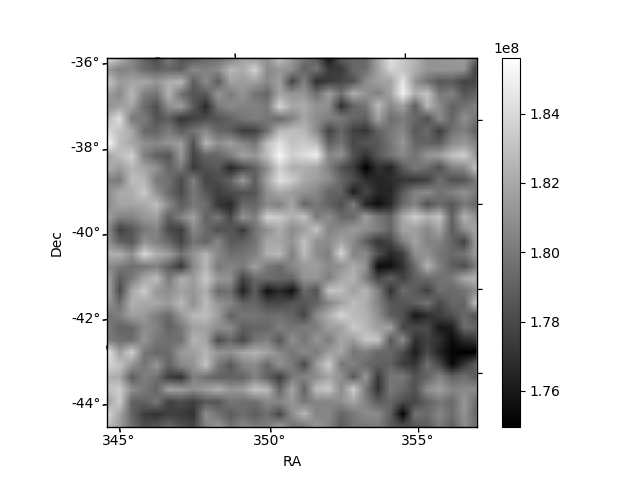
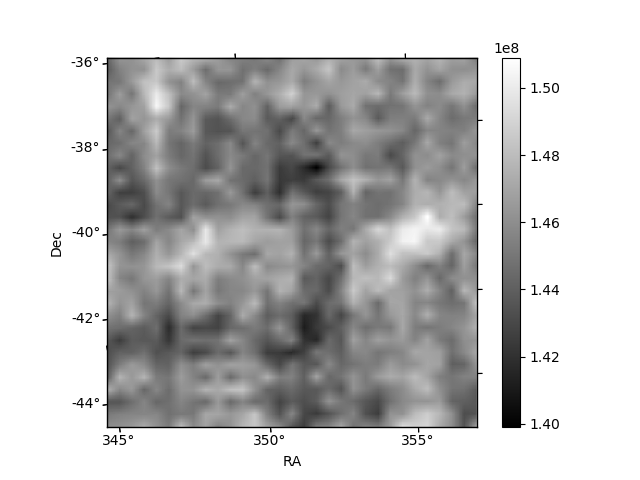
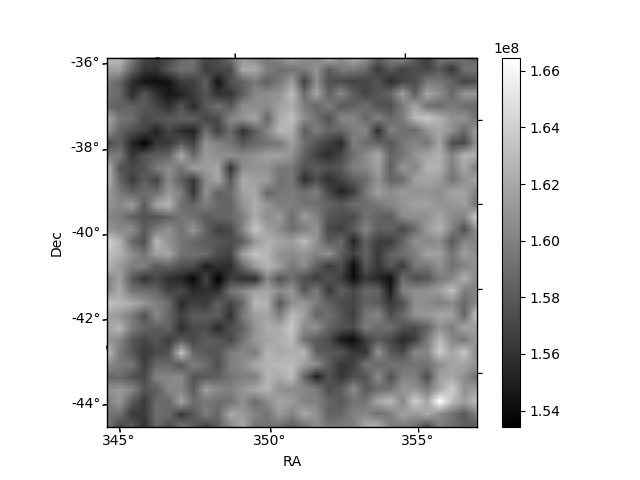
Histogram calculated using DETX and DETY for each event in the final _common_clean file
| Quadrant A | 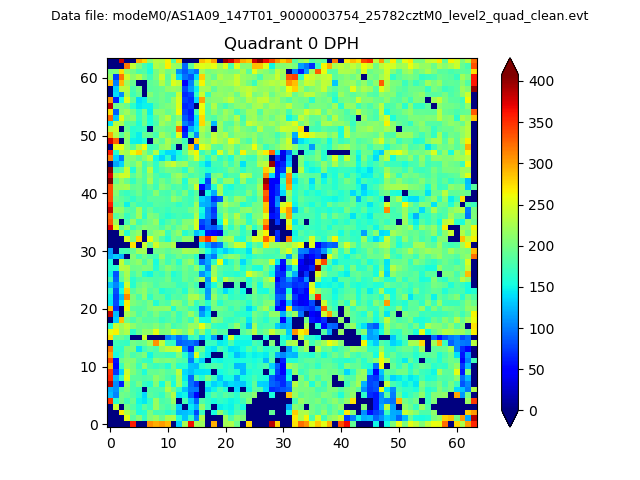 |
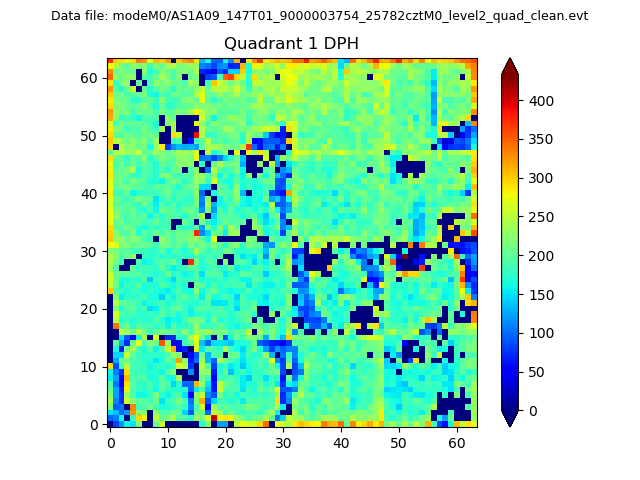 |
Quadrant B |
|---|---|---|---|
| Quadrant D | 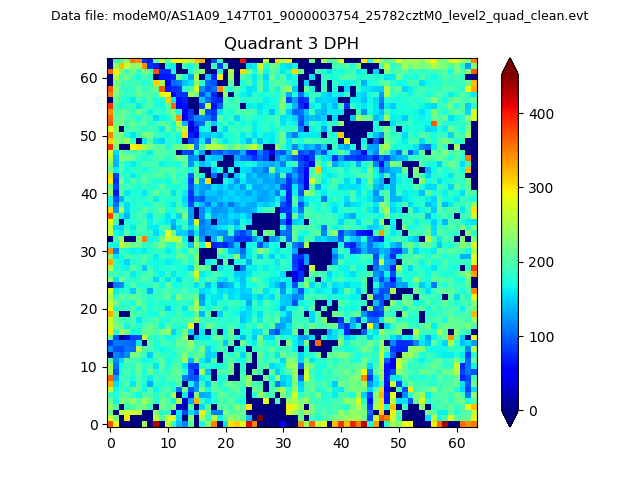 |
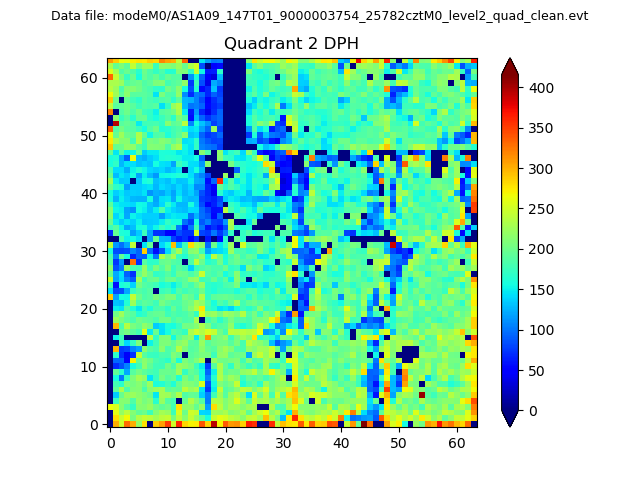 |
Quadrant C |
| Plot type | Count rate plots | Images |
|---|---|---|
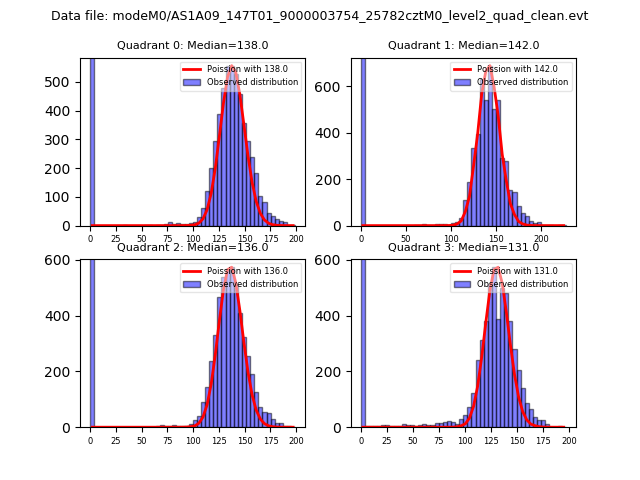
| Comparison with Poisson distribution Blue bars denote a histogram of data divided into 1 sec bins. Red curve is a Poisson curve with rate = median count rate of data. |
 |
 |
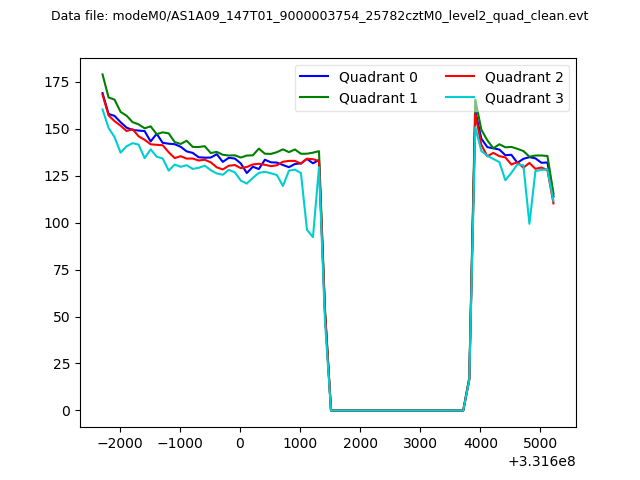
| Quadrant-wise count rates Data is divided into 100 sec bins |
 |
|
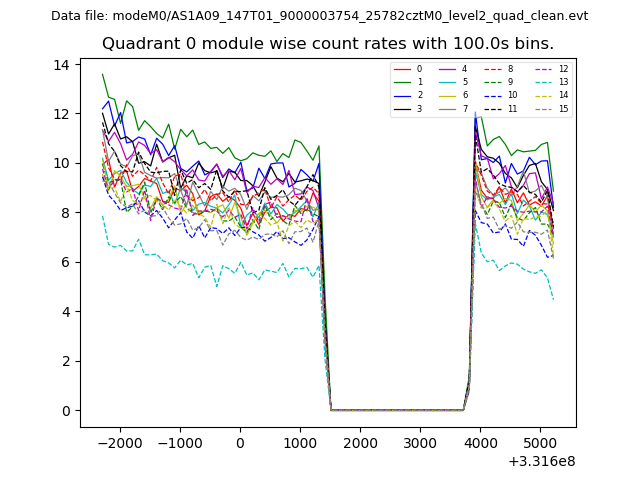
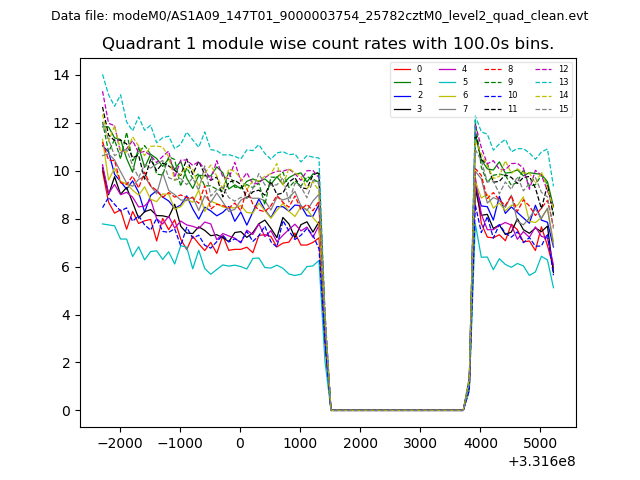
| Module-wise count rates for Quadrant A Data is divided into 100 sec bins |
 |
 |
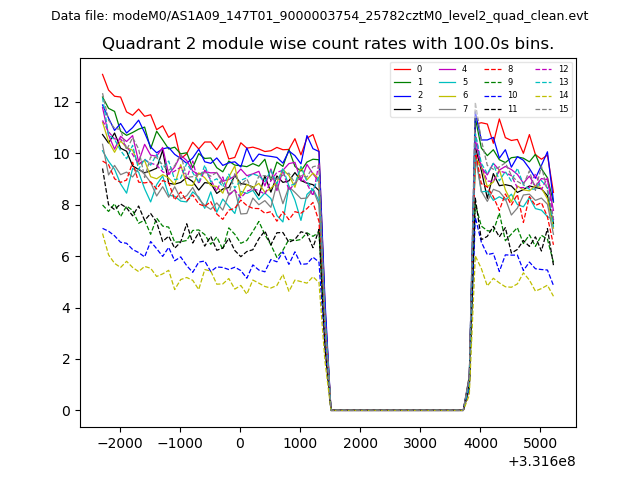
| Module-wise count rates for Quadrant B Data is divided into 100 sec bins |
 |
 |
| Module-wise count rates for Quadrant C Data is divided into 100 sec bins |
 |
 |
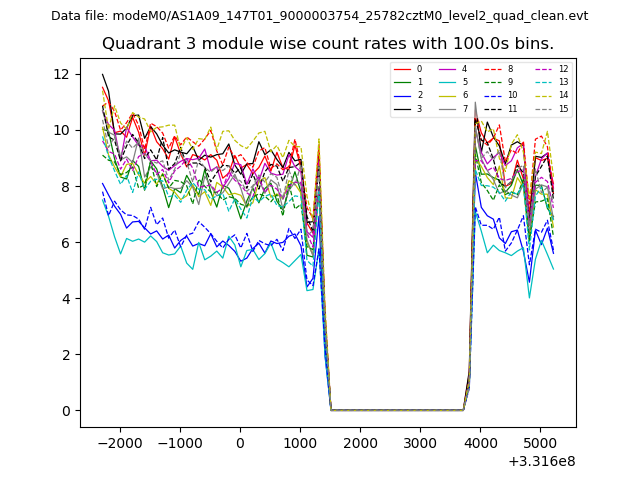
| Module-wise count rates for Quadrant D Data is divided into 100 sec bins |
 |
 |
| Parameter | Plot |
|---|---|
| CZT HV Monitor | 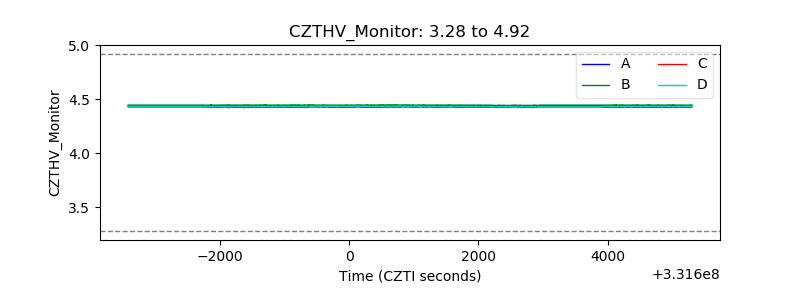 |
| D_VDD | 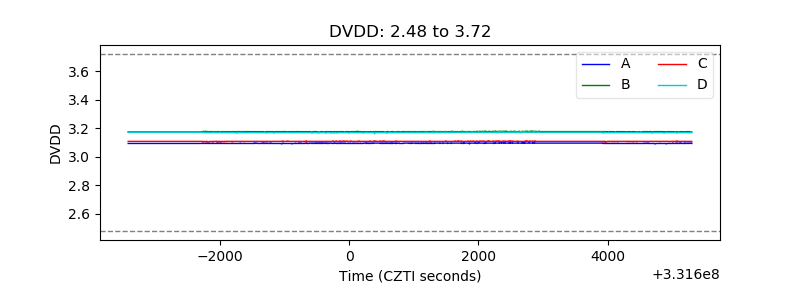 |
| Temperature 1 | 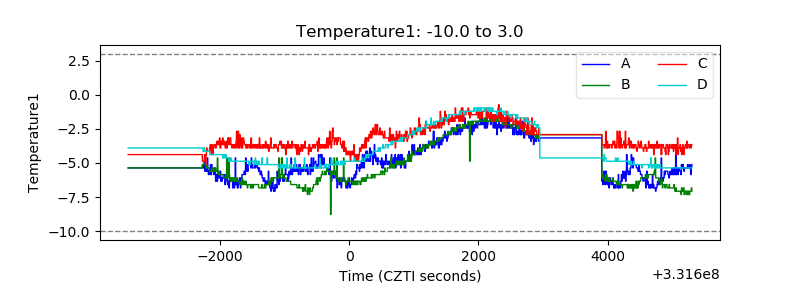 |
| Veto HV Monitor | 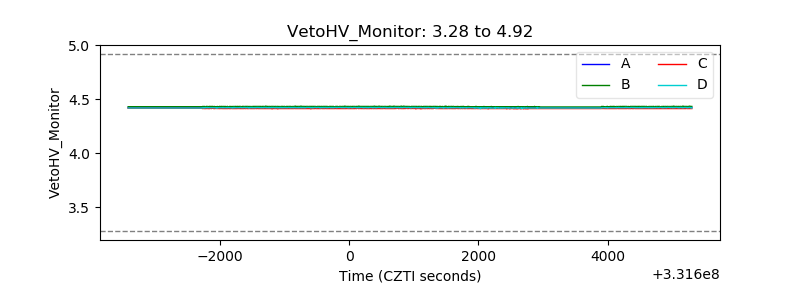 |
| Veto LLD | 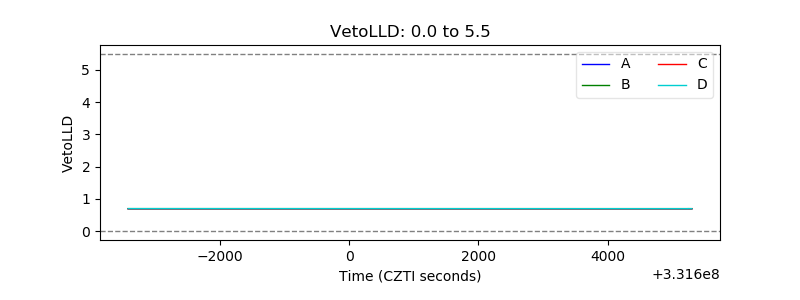 |
| Alpha Counter | 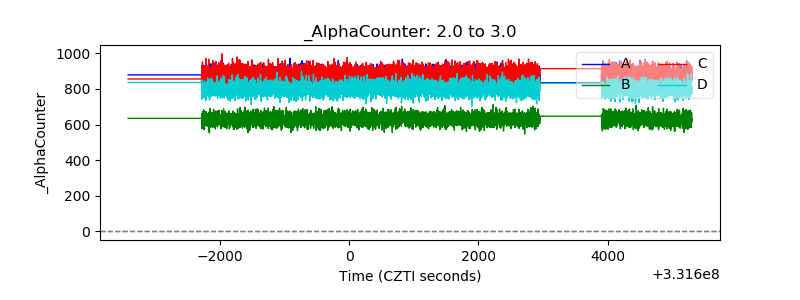 |
| _CPM_Rate | 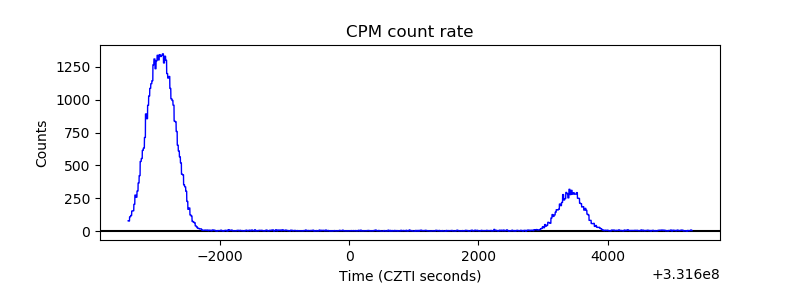 |
| CZT Counter | 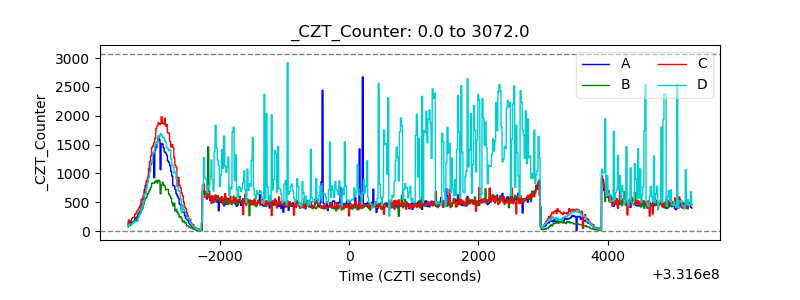 |
| +2.5 Volts monitor | 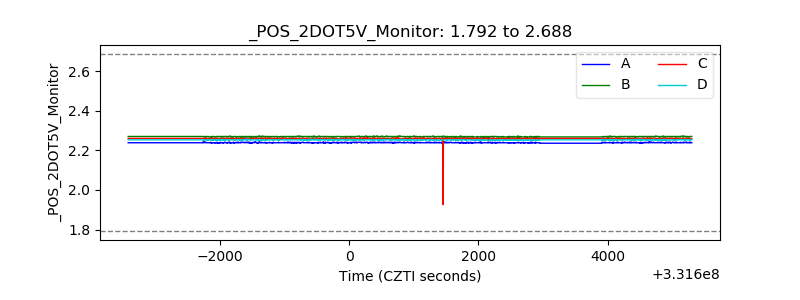 |
| +5 Volts monitor |  |
| _ROLL_ROT | 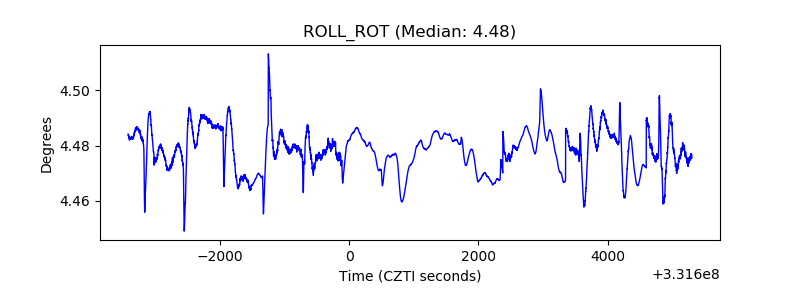 |
| _Roll_DEC | 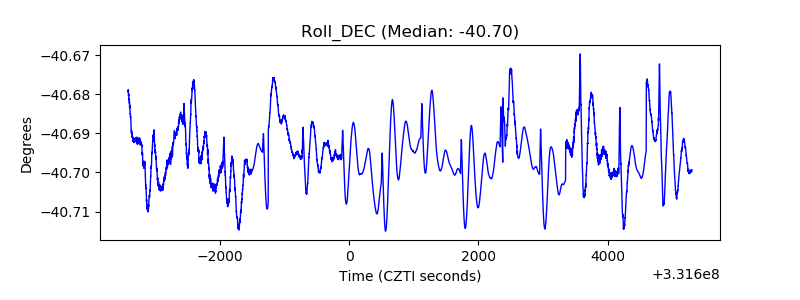 |
| _Roll_RA |  |
| Veto Counter | 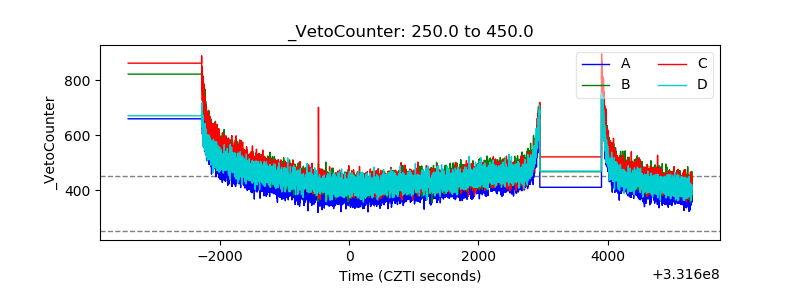 |