| Param | Original file | Final file |
|---|---|---|
| Filename | modeM0/AS1A09_147T01_9000003754_25783cztM0_level2.evt | modeM0/AS1A09_147T01_9000003754_25783cztM0_level2_quad_clean.evt |
| Size (bytes) | 551,018,880 | 105,563,520 |
| Size | 525.5 MB | 100.7 MB |
| Events in quadrant A | 3,453,206 | 686,569 |
| Events in quadrant B | 3,503,002 | 703,621 |
| Events in quadrant C | 3,554,704 | 671,520 |
| Events in quadrant D | 5,688,333 | 633,696 |
| Mode M9 | |||
|---|---|---|---|
| Quadrant | BADHDUFLAG | Total packets | Discarded packets |
| A | 0 | 13 | 0 |
| B | 0 | 14 | 0 |
| C | 0 | 14 | 0 |
| D | 0 | 14 | 0 |
| Mode M0 | |||
|---|---|---|---|
| Quadrant | BADHDUFLAG | Total packets | Discarded packets |
| A | 0 | 14894 | 0 |
| B | 0 | 14938 | 0 |
| C | 0 | 14945 | 0 |
| D | 0 | 21954 | 0 |
| Quadrant | Total seconds | Saturated seconds | Saturation percentage |
|---|---|---|---|
| A | 7201 | 52 | 0.722122% |
| B | 7200 | 92 | 1.277778% |
| C | 7200 | 146 | 2.027778% |
| D | 7200 | 505 | 7.013889% |
Noise dominated data is calculated using 1-second bins in cleaned event files. If a bin has >2000 counts, and if more than 50% of those come from <1% of pixels, then it is considered to be noise-dominated and hence unusable.
| Quadrant | # 1 sec bins | Bins with >0 counts | Bins with >2000 counts | High rate bins dominated by noise | Noise dominated (total time) | Noise dominated (detector-on time) | Marked lightcurve |
|---|---|---|---|---|---|---|---|
| A | 7706 | 7202 | 0 | 0 | 0.00% | 0.00% | 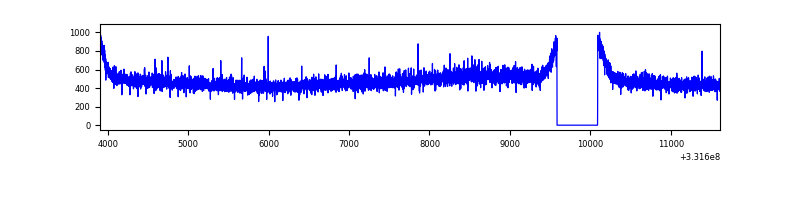 |
| B | 7705 | 7201 | 2 | 2 | 0.03% | 0.03% | 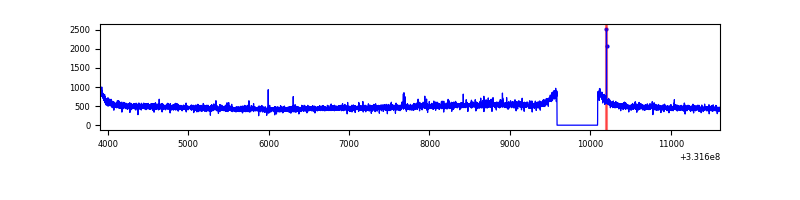 |
| C | 7705 | 7200 | 0 | 0 | 0.00% | 0.00% | 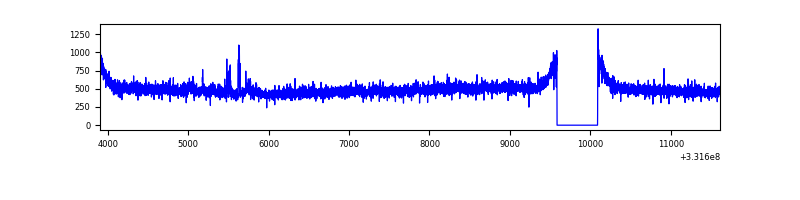 |
| D | 7705 | 7201 | 419 | 419 | 5.44% | 5.82% | 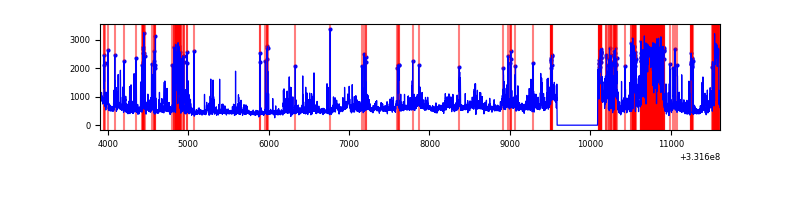 |
Top three noisy pixels from each quadrant. If the there are fewer than three noisy pixels in the level2.evt file, extra rows are filled as -1
| Pixel properties | Quadrant properties | ||||||
|---|---|---|---|---|---|---|---|
| Quadrant | DetID | PixID | Counts | Sigma | Mean | Median | Sigma |
| A | 13 | 254 | 10618 | 54.42 | 891 | 870 | 179.1 |
| A | 6 | 16 | 8525 | 42.74 | 891 | 870 | 179.1 |
| A | 3 | 137 | 8201 | 40.93 | 891 | 870 | 179.1 |
| B | 12 | 111 | 20886 | 118.69 | 889 | 864 | 168.7 |
| B | 11 | 111 | 19026 | 107.66 | 889 | 864 | 168.7 |
| B | 14 | 111 | 16804 | 94.49 | 889 | 864 | 168.7 |
| C | 14 | 238 | 137071 | 671.47 | 865 | 870 | 202.8 |
| C | 3 | 233 | 47749 | 231.11 | 865 | 870 | 202.8 |
| C | 13 | 61 | 5752 | 24.07 | 865 | 870 | 202.8 |
| D | 7 | 80 | 1194328 | 5923.26 | 847 | 826 | 201.5 |
| D | 1 | 52 | 921053 | 4567.02 | 847 | 826 | 201.5 |
| D | 13 | 104 | 254739 | 1260.15 | 847 | 826 | 201.5 |
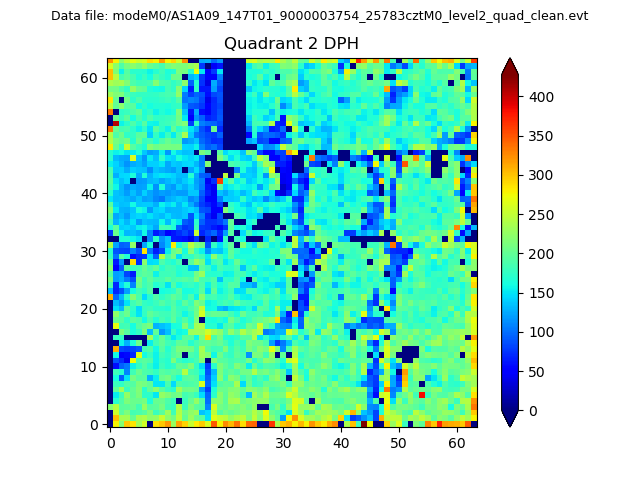
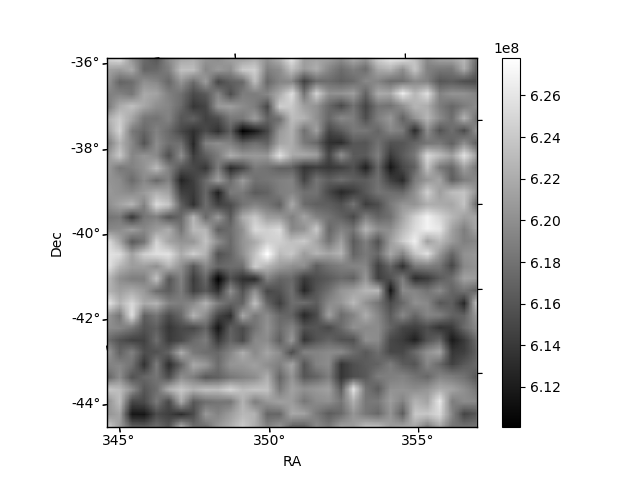
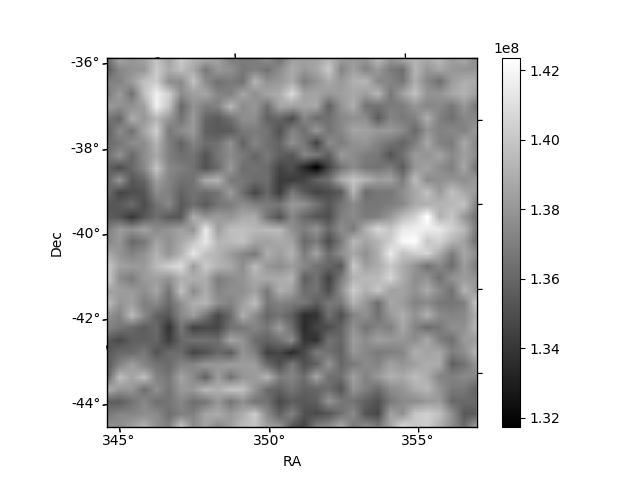
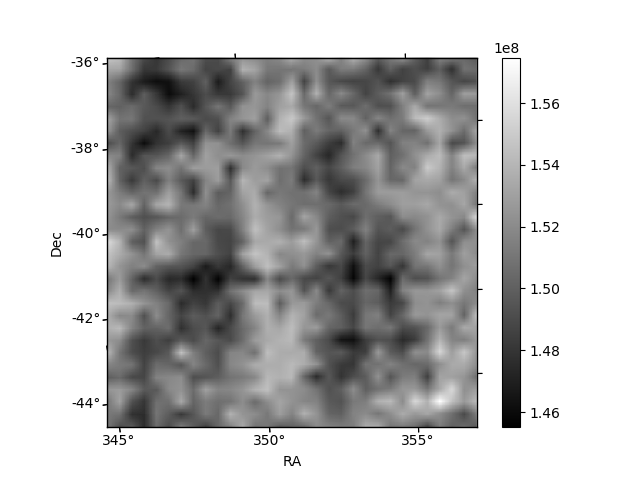
Histogram calculated using DETX and DETY for each event in the final _common_clean file
| Quadrant A | 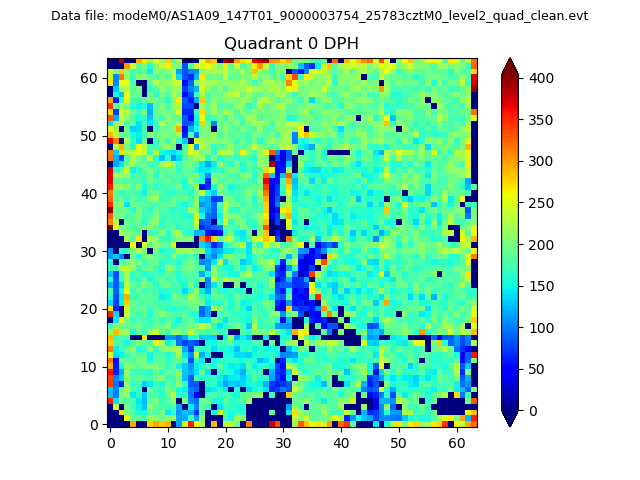 |
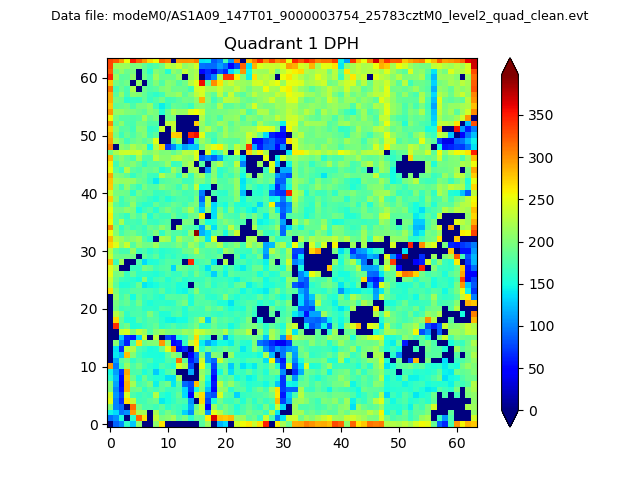 |
Quadrant B |
|---|---|---|---|
| Quadrant D | 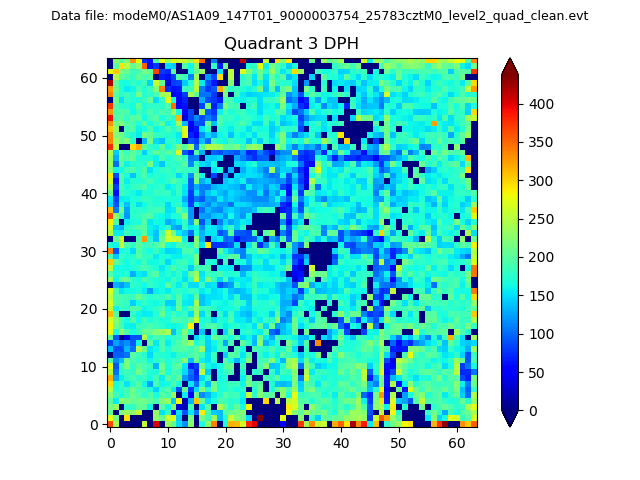 |
 |
Quadrant C |
| Plot type | Count rate plots | Images |
|---|---|---|
| Comparison with Poisson distribution Blue bars denote a histogram of data divided into 1 sec bins. Red curve is a Poisson curve with rate = median count rate of data. |
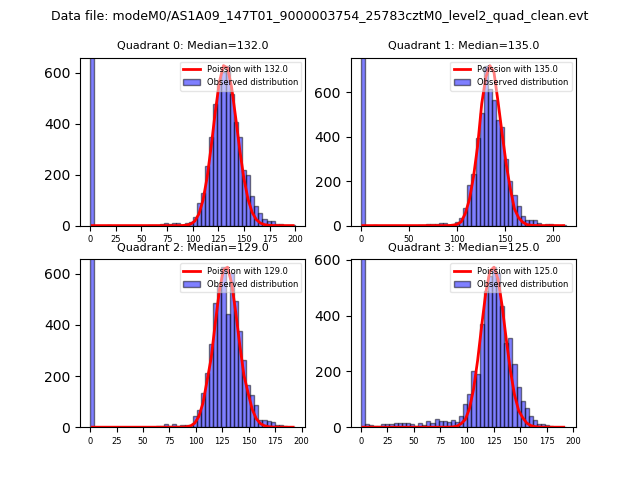 |
 |
| Quadrant-wise count rates Data is divided into 100 sec bins |
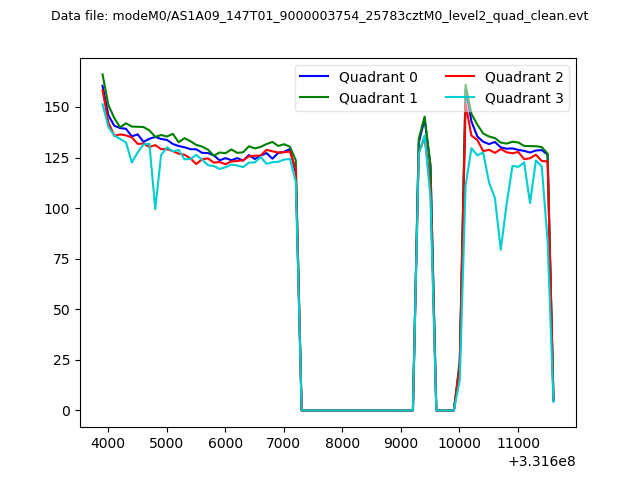 |
|
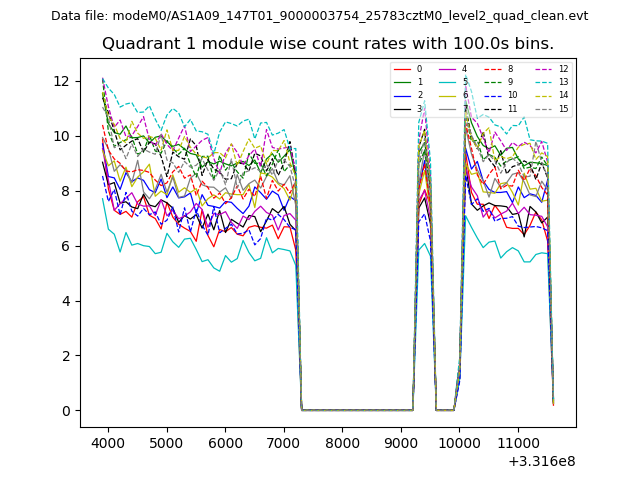
| Module-wise count rates for Quadrant A Data is divided into 100 sec bins |
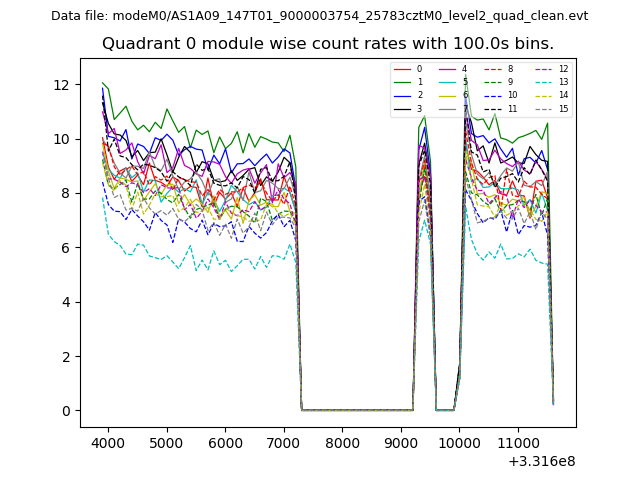 |
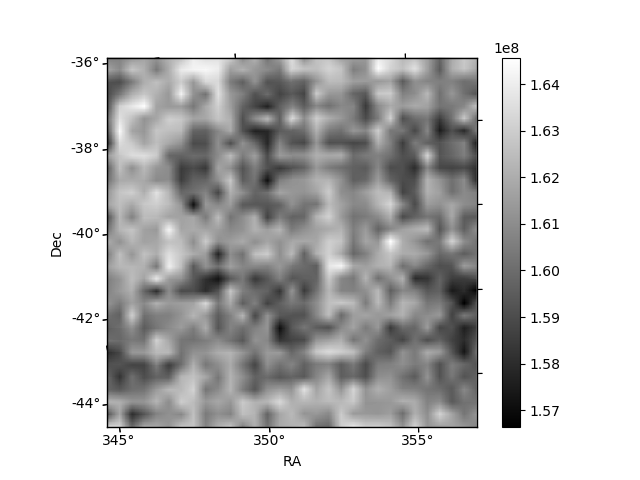 |
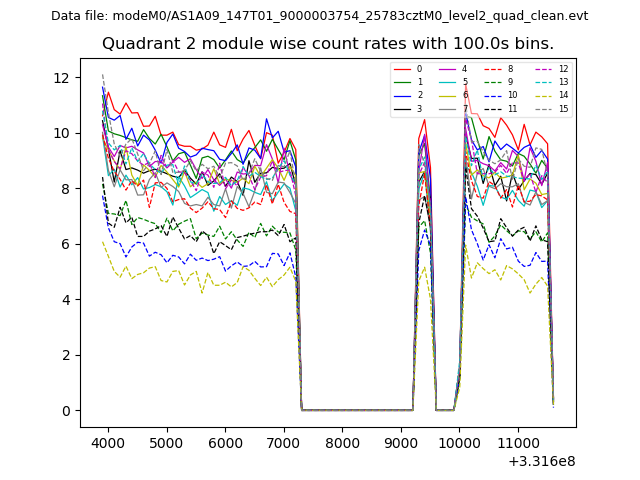
| Module-wise count rates for Quadrant B Data is divided into 100 sec bins |
 |
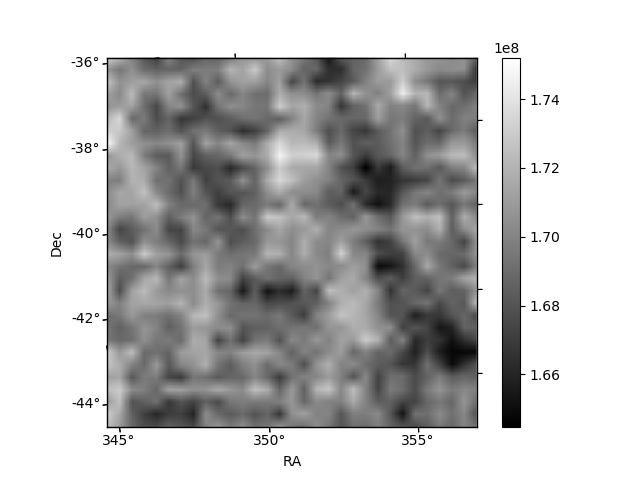 |
| Module-wise count rates for Quadrant C Data is divided into 100 sec bins |
 |
 |
| Module-wise count rates for Quadrant D Data is divided into 100 sec bins |
 |
 |
| Parameter | Plot |
|---|---|
| CZT HV Monitor | 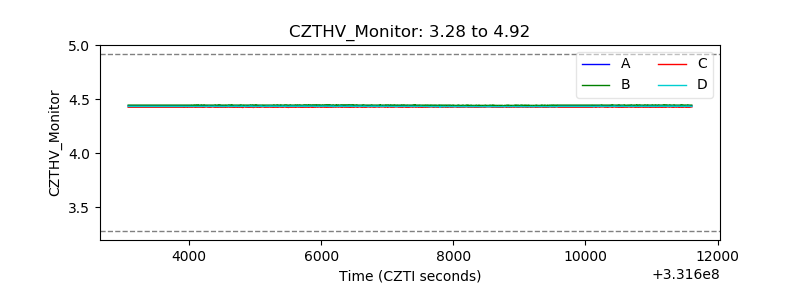 |
| D_VDD | 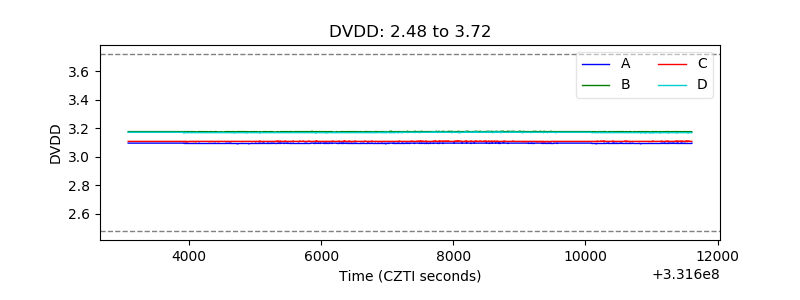 |
| Temperature 1 | 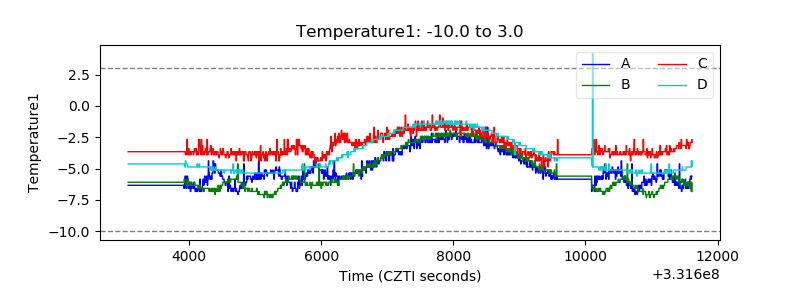 |
| Veto HV Monitor | 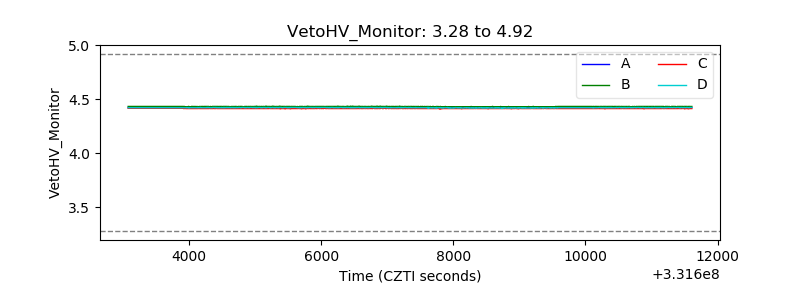 |
| Veto LLD | 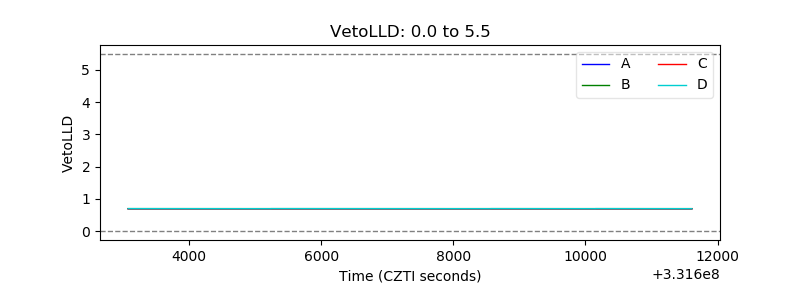 |
| Alpha Counter | 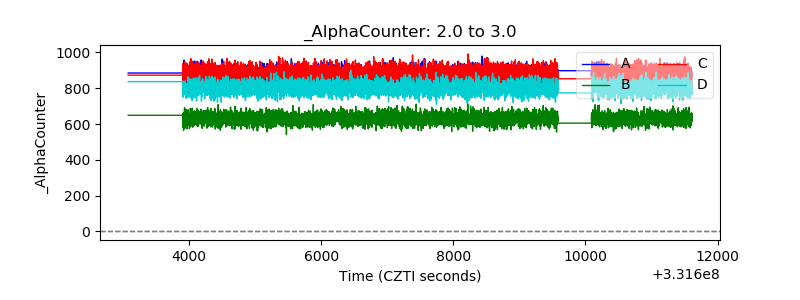 |
| _CPM_Rate | 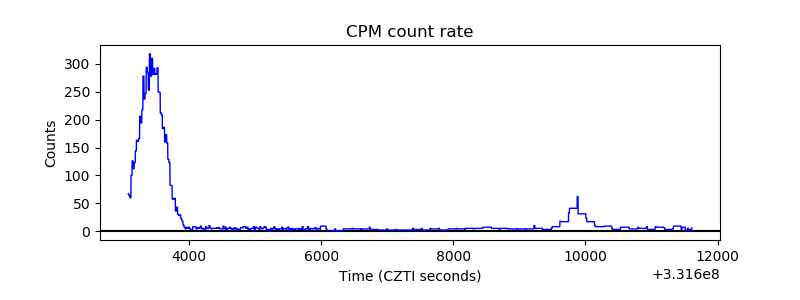 |
| CZT Counter | 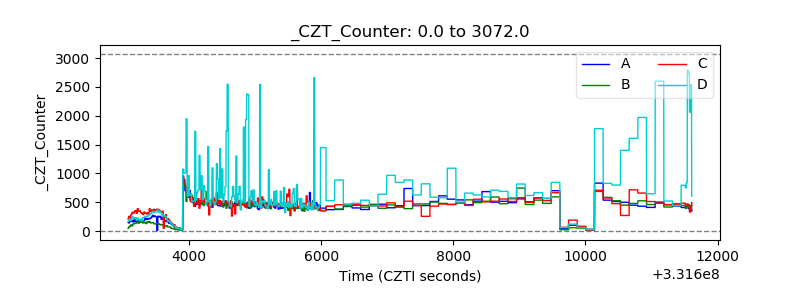 |
| +2.5 Volts monitor |  |
| +5 Volts monitor | 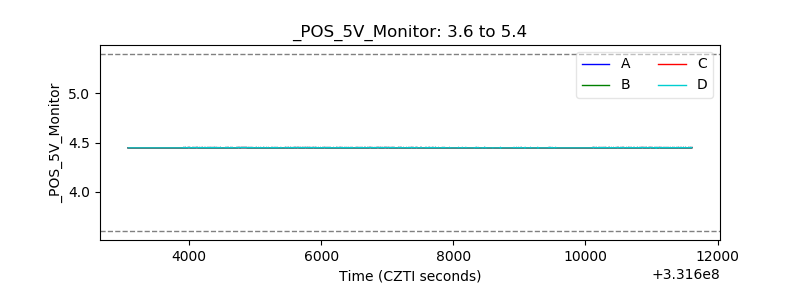 |
| _ROLL_ROT | 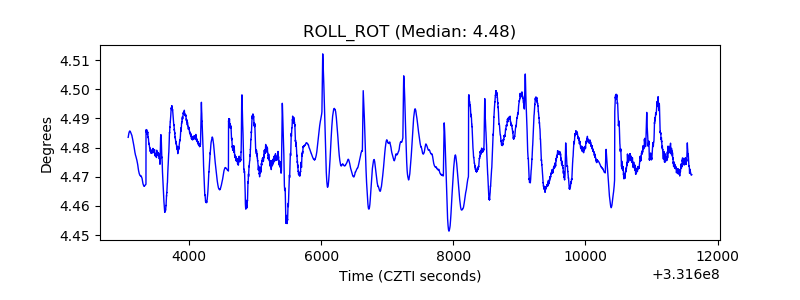 |
| _Roll_DEC |  |
| _Roll_RA | 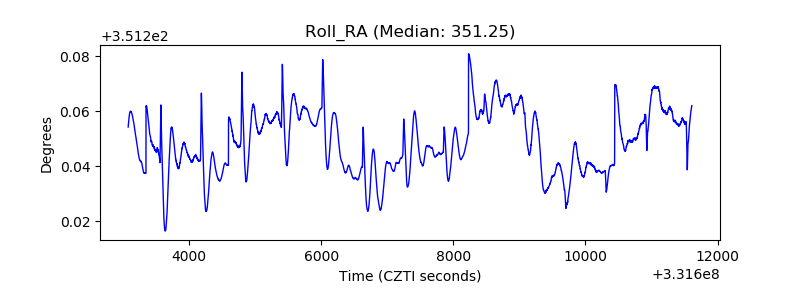 |
| Veto Counter | 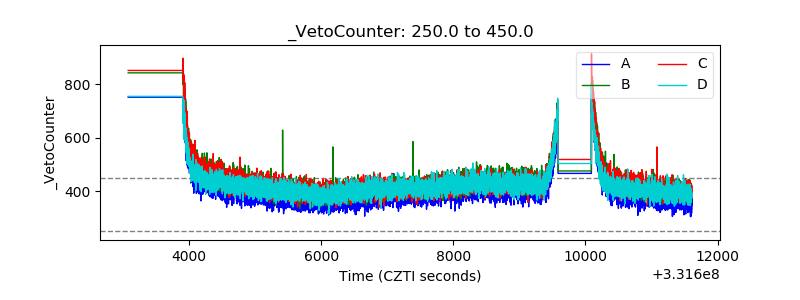 |